• Products
  • Community
  • Markets
  • Brokers
  • More
Get started
  • Markets
  • /World stocks
  • /Ideas
AEGISVOPAK - Efforts Vs Result to be watchNSE:AEGISVOPAK Efforts Vs Result Trade Plan Near History of Price Action: Aegis Vopak Terminals Ltd. , had expressed sharp up move with nice expanded volume historically leaving a identifiable demand area responsible for that up momentum. Meanwhile with time, the price exhausted up momentum as reached to previously known supply area and finally corrected downside with negative RSI divergence with high volume activity expressing the strength of supply area. Current Price Action:
NSE:AEGISVOPAKLong
by KingDoxa_trades
SBIN - Potential Bullish Reversal from Demand ZoneSBIN is showing early signs of a potential reversal from its previous demand zone. In May 2026, the stock made a low near 933.90, followed by a rally towards 1,124.50. After the subsequent correction, it revisited the demand zone and formed a slightly higher low near 937.50. The recent price action suggests buying interest is emerging at these levels, with early signs of a short-term bullish structure. A decisive breakout above the immediate resistance zone of 988-1,001 could strengthen the s
NSE:SBIN
by SatpalS
4
Fractal Analytics cmp 835.65 Daily Chart since listedFractal Analytics cmp 835.65 Daily Chart since listed - Resistance Zone 845 to 950 price band - Support Zone ATL 696.30 to 800 price band - Bullish "W" Double Bottom by Resistance neckline - Heavy Volumes spike seen twice, over past few days - Volumes supported Breakout from Resistance Price Channel - Breakout of Resistance Zone necessary for Fresh Price Uptrend
NSE:FRACTAL
by PIYUSHCHAVDA
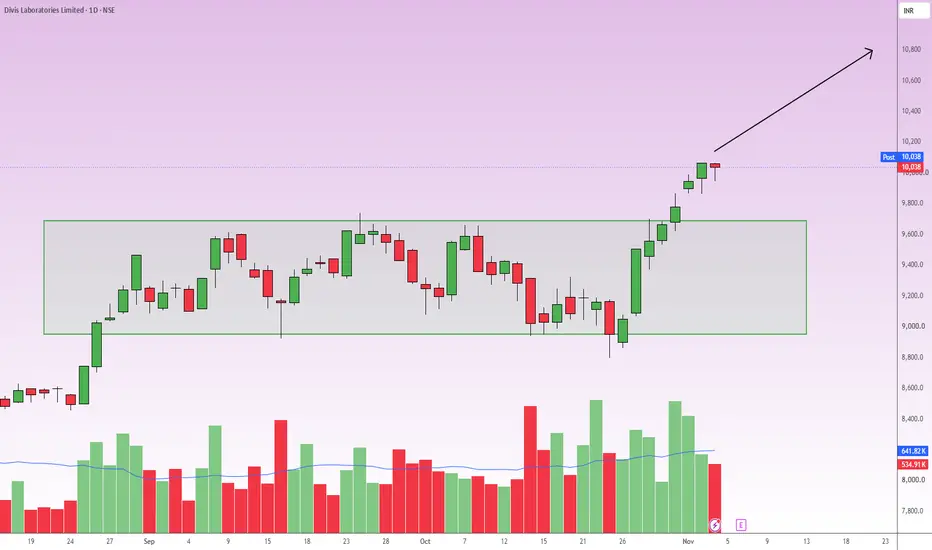
DIVISLAB Strong Multi-Week Consolidation BoxLooking at the daily chart for Divi's Laboratories Limited, the price action has recently emerged from a distinct consolidation phase. For several weeks, the stock was trading within a tight rectangular zone (highlighted by the green box) with support near 9,000 and resistance near 9,650. We have now witnessed a decisive breakout above this upper resistance boundary. More importantly, this breakout is validated by a significant surge in buying volume (indicated by the tall green volume bars at
NSE:DIVISLAB
by ParamjitMahapatro
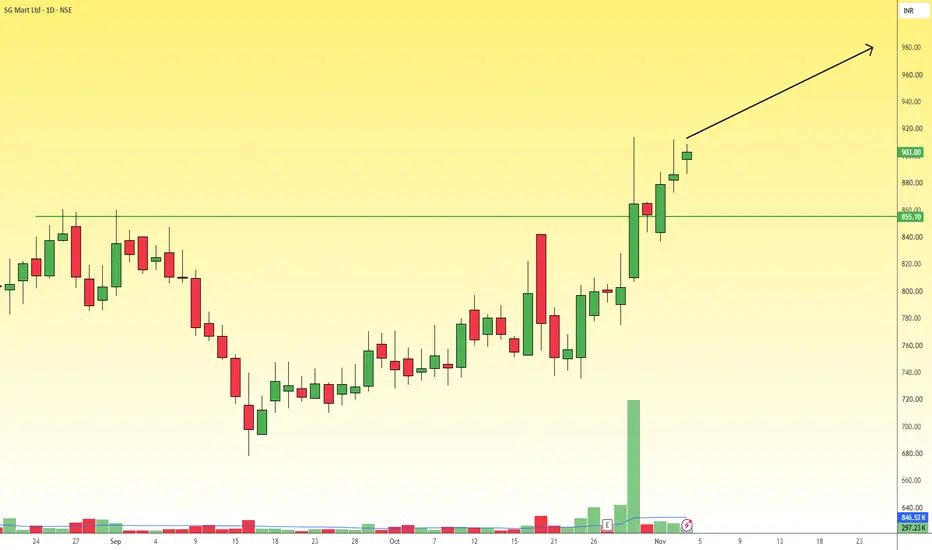
SGMART Strong Breakout Continuation on Daily ChartLooking at the daily timeframe for SG Mart Ltd, the stock has successfully broken out of its recent consolidation phase, clearing a crucial resistance level marked by the green horizontal line at 855.10. This previous resistance has now flipped into a structural support zone. It is important to note the massive volume spike that occurred just before the breakout. This extreme volume surge validates the aggressive buying interest and confirms the fundamental strength of the move. The price is
NSE:SGMART
by ParamjitMahapatro
MBAPL Bullish Breakout from Multi-Month ConsolidationLooking at the daily timeframe for Madhya Bharat Agro Products Ltd., the stock has demonstrated a classic and powerful technical setup. Following a strong upward rally earlier in the year, the price entered a prolonged phase of sideways consolidation. This created a clear rectangular base, with price oscillating roughly between the 155 (support) and 175 (resistance) levels. Recently, the stock has decisively broken out above this upper resistance boundary. This breakout is accompanied by a not
NSE:MBAPL
by ParamjitMahapatro
KMEW Bullish Bounce at Key Support ConfluenceMarket Bias: Long Expected Duration: Short to medium-term swing trade (1 to 4 weeks) Technical Analysis & Chart Breakdown: Knowledge Marine & Engineering Works is currently presenting a highly favorable risk-to-reward long setup on the daily (1D) timeframe. The stock has been trading in a steady macro uptrend and has formed a clean ascending parallel channel. The rationale for this setup is based on a confluence of two strong technical support factors: Horizontal Breakout Retest: The price p
NSE:KMEW
by ParamjitMahapatro
Buy Today, Sell Tomorrow for 3-5% - Daily Breakout SetupHMAAGRO — BTST BREAKOUT SETUP Entry, Stop Loss & Targets Are Clearly Defined — Helping You Plan Your Trade With Confidence. 📊 Stock Strength: 97/100 (Note: Higher score indicates stronger stock conditions, not guaranteed returns.) A bullish breakout has appeared on the 1D timeframe with positive price action and strong volume expansion. 🔄 Trade Type: BTST ──────────────────── 🎯 TRADE LEVELS ENTRY: ₹28 🛑 STOP LOSS ATR SL: ₹26 🎯 TARGETS 3–5% ──────────────────── 📈 VOLUME 20D Volume: 683
NSE:HMAAGROLong
by nemichandbhati
SYMBIOTEC Long Opportunity at Ascending Channel SupportChart Analysis & Reasoning The stock is currently trading within a well-defined ascending channel on the daily timeframe. The price has recently tested the lower trendline support of this channel and is beginning to exhibit a bullish bounce. The primary reasoning for this setup is that this lower boundary has historically acted as a reliable accumulation zone, and the current price action indicates the broader uptrend is likely to continue. Trade Setup To provide a complete trading idea, the
S
by ParamjitMahapatro
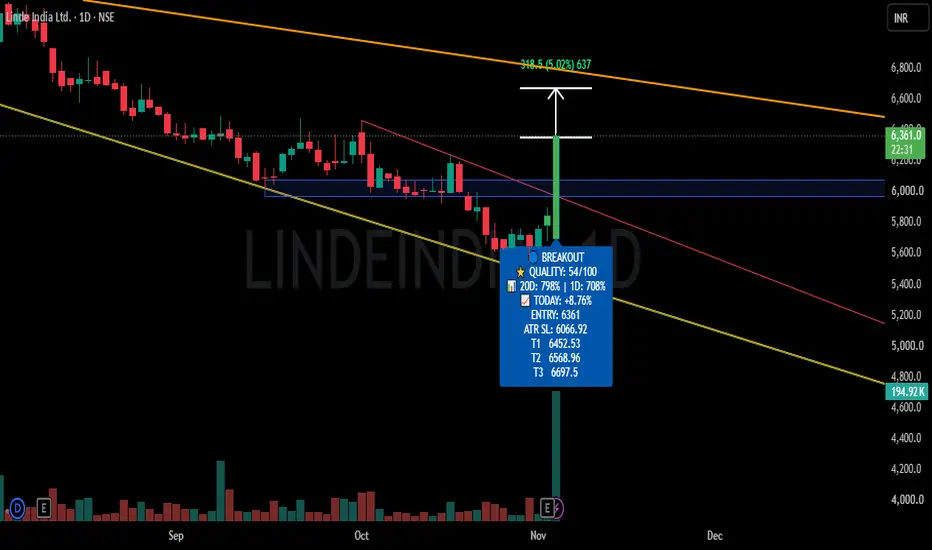
Buy Today, Sell Tomorrow for 3-5% - Daily Breakout SetupLINDE — BTST BREAKOUT SETUP Entry, Stop Loss & Targets Are Clearly Defined — Helping You Plan Your Trade With Confidence. A bullish breakout has appeared on the 1D timeframe with positive price action and volume expansion. 🔄 Trade Type: BTST ──────────────────── 🎯 TRADE LEVELS ENTRY: ₹6342 🛑 STOP LOSS ₹6080 🎯 TARGETS 3–5% ──────────────────── 📈 VOLUME 20D Volume: 793% 1D Volume: 672% ──────────────────── ⏱ Timeframe: 1 Day 📌 Trade Entry: Take the trade only after 3:15 PM. The posi
NSE:LINDEINDIALong
by nemichandbhati
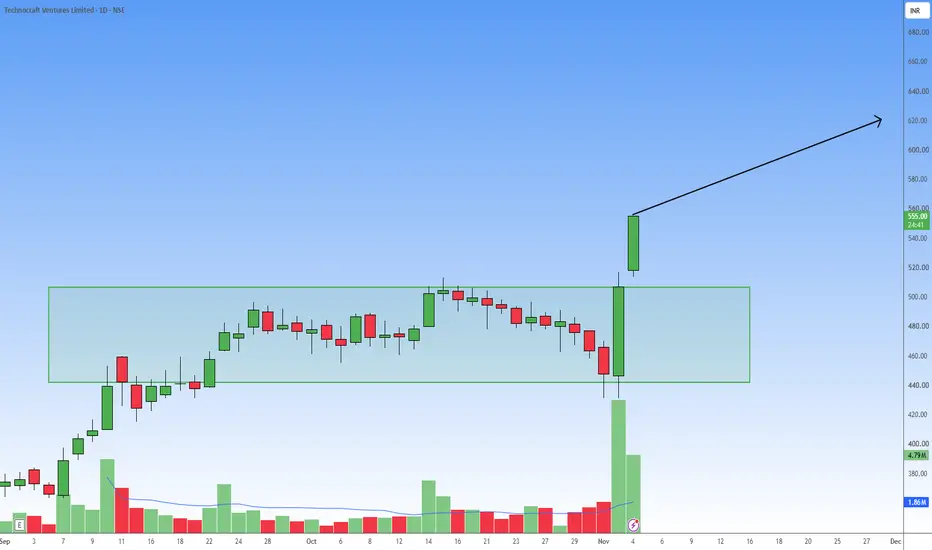
TECHNOCRAF Strong Box Pattern Breakout with Massive VolumeOn the daily timeframe, Technocraft Ventures has demonstrated a textbook breakout from a prolonged consolidation phase. For the past several weeks, the price was range-bound within a distinct rectangular box pattern, fluctuating roughly between the 440 support and 510 resistance levels. Recently, the stock breached this upper resistance with a highly bullish momentum candle. The most compelling technical factor supporting this move is the massive surge in trading volume that accompanied the bre
T
by ParamjitMahapatro
Gland Pharma: Multi-Year Consolidation BreakoutGland Pharma: Multi-Year Consolidation Breakout with Strong Momentum Gland Pharma has emerged from a prolonged consolidation phase following its major downtrend. After spending several years moving within a broad ₹1,300–₹2,200 range, the stock eventually broke above the important resistance zone of ₹2,607 with strong volume participation. Since the breakout, the stock has rallied approximately 21.7% and is currently trading around ₹3,171.7. Another positive observation is the improving Relati
NSE:GLAND
by Chart_Momentum
4
Buy Today, Sell Tomorrow for 3-5% - Daily Breakout SetupICIL — BTST BREAKOUT SETUP Entry, Stop Loss & Targets Are Clearly Defined — Helping You Plan Your Trade With Confidence. 📊 Stock Strength: 75/100 (Note: Higher score indicates stronger stock conditions, not guaranteed returns.) A bullish breakout has appeared on the 1D timeframe with positive price action and strong volume expansion. 🔄 Trade Type: BTST ──────────────────── 🎯 TRADE LEVELS ENTRY: ₹520 🛑 STOP LOSS Previous Candle Low 🎯 TARGETS 3–5% ──────────────────── 📈 VOLUME 20D Volum
NSE:ICILLong
by nemichandbhati
SONACOMS Multi-Year Resistance Breakout – Long SetupBias: Long / Bullish Expected Duration: Mid to Long-term (Several weeks to months, based on the weekly timeframe) Technical Analysis & Reasoning: Multi-Year Breakout: Sona BLW Precision Forgings has successfully broken out above a major long-term resistance level at 834 on the weekly chart. This resistance zone had been acting as a ceiling since early 2022, and clearing it is a significant bullish signal. Strong Momentum: The recent price action shows a strong, full-bodied bullish candle clo
NSE:SONACOMS
by ParamjitMahapatro
Profits Without Protection: The Psychology of Reckless WinningMaking money in the market should make a trader more confident, but sometimes it does the opposite of what it should. After a few successful trades, traders often begin taking risks they would normally avoid. Position sizes increase, stop-losses become flexible, and trading decisions become less selective. This behaviour is closely connected to the House Money Effect , a psychological bias in which people become more willing to take risks with money they have recently gained than with their or
NASDAQ:MSFTEducation
by BrightRally_Research
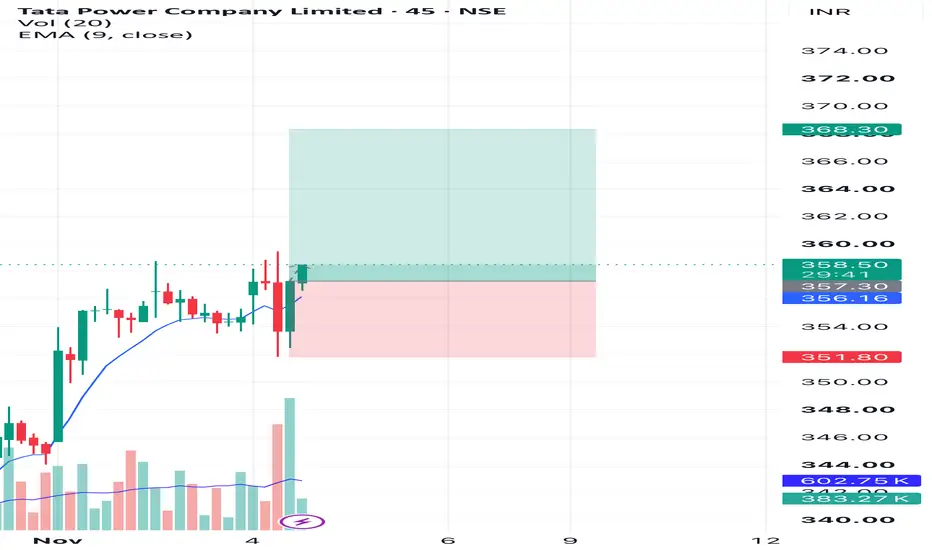
About to breakoutIf you see the 45-minute chart, it is making a bullish engulfing candle where the second green candle has more volume than the previous red candle. It is not breaking the structure upwards, but there is good resistance at that level, which means it can be broken anytime. Overall, it is an uptrend, so the chances of a breakout are higher than a breakdown.
NSE:TATAPOWER
by drmukur
Ambuja Cements Ltd - Potential Long-Term Reversal Setup XABCD# 📊 Ambuja Cements Ltd. (NSE: AMBUJACEM) — Potential Long-Term Reversal Setup Reversal watch Weekly timeframe Ambuja Cements is trading near ₹372.65, showing a strong weekly candle of approximately +7.07% on the chart dated November 4, 2026. The weekly chart highlights a potential XABCD harmonic reversal structure, with price approaching the projected D-zone around ₹347–₹373. This is an important area to watch for a possible base formation and recovery. ## Key technical levels | Level
NSE:AMBUJACEMLong
by KMKB
Waaree Energies - Inverted Head and Shoulder PatternWaaree Energies is developing a potential Inverse Head & Shoulders reversal pattern, indicating a possible shift in short-term market structure from bearish to bullish. Key Technical Observations: Left Shoulder: ₹2,310–₹2,320 Head: Around ₹2,160 Right Shoulder: ₹2,310–₹2,320 Neckline Resistance: ₹2,355–₹2,365 Trigger: A decisive breakout above the neckline, supported by strong volume and sustained price action, would strengthen the bullish reversal setup. Technical View: The patter
NSE:WAAREEENER
by Arvind_Share_Academy
Avalon Technologies: Wave 5 Targets a New HighAvalon Technologies is showing a clear bullish Elliott Wave structure on the daily chart. The stock appears to have completed Wave (4) near 1,629 and is now progressing into Wave (5). Price is holding above the rising trendline and the 50 EMA, keeping the overall structure positive. The recent move above the previous swing area also supports the idea that bullish momentum is returning. As long as the broader rising structure remains intact, Wave (5) can continue higher. The Fibonacci projecti
NSE:AVALON
by BrightRally_Research
Updated
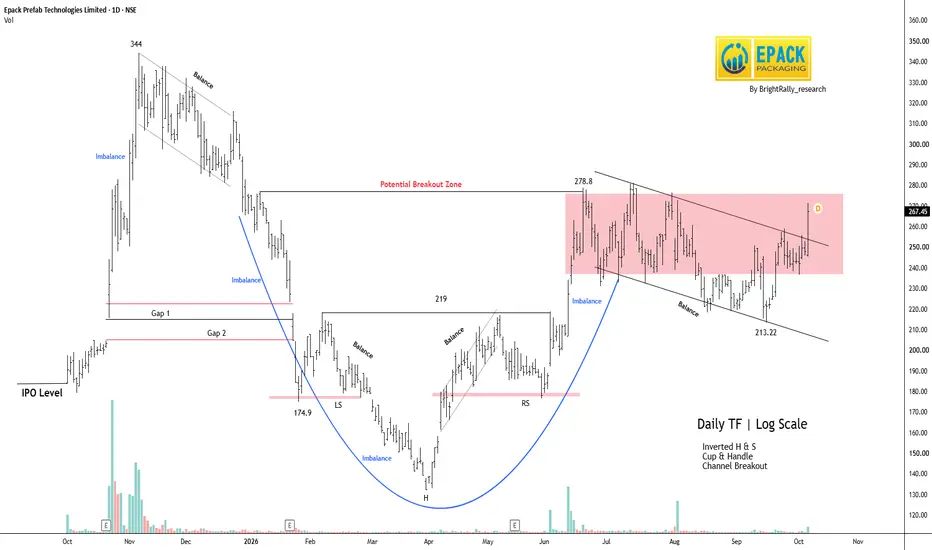
EPACKPEB: Bullish Breakout Setup, 278.8 Is the Key TriggerShort Term levels: 286 and 314 Intraday Support: 260 NSE:EPACKPEB is showing strong bullish momentum after breaking above the recent channel. Price is now near 267, with buyers clearly in control. The main hurdle is 278.8; a clean breakout can strengthen the move. Volume expansion would add confidence to the breakout. On the downside, 250 is the first important support to watch. As long as price holds above this area, the bullish setup remains intact. A move below 240 would weaken the struc
NSE:EPACKPEBLong
by BrightRally_Research
Updated
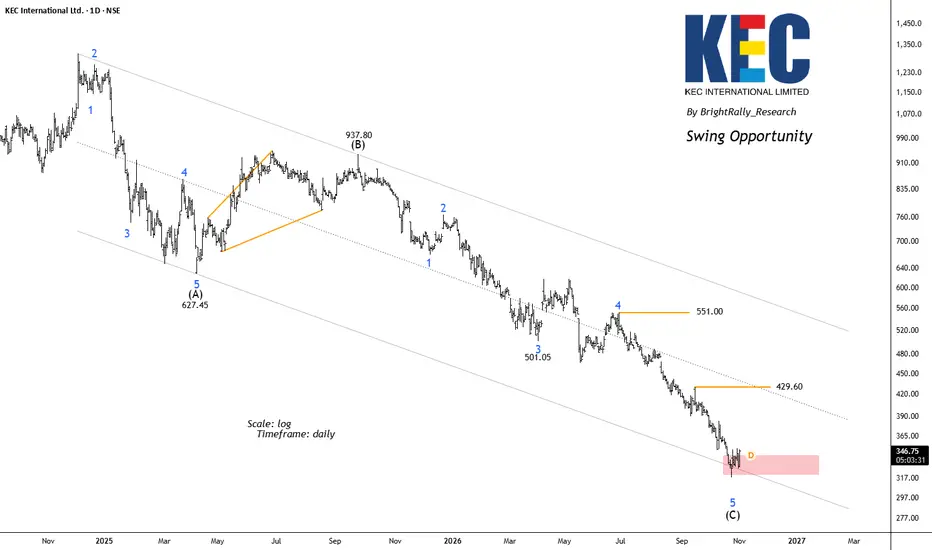
KEC: Is a Swing Reversal Taking Shape Near the Bottom?KEC International has been trading inside a broad descending channel, reflecting a prolonged corrective phase. The Elliott Wave structure suggests that the stock may be approaching the final stages of a larger Wave (C) decline. The chart shows Wave (A) ending near ₹627.45 , followed by a recovery into Wave (B) near ₹937.80 . Since then, the stock has continued its downward journey in a developing Wave (C) structure. The recent decline appears to be completing Wave 5, with the price now enter
NSE:KECLong
by BrightRally_Research
Updated
L&T FINANCE: Volatility Contraction Pattern (VCP)LTF is displaying a potential VCP structure, characterised by successive price contractions and narrowing volatility. Key Technical Observations: - Successive pullbacks indicate a reduction in selling pressure. - Price is consolidating near the ₹257–₹258 resistance zone. - The ₹244–₹246 zone represents an important support area. - Contracting volume during consolidation may indicate reduced selling activity. Confirmation Trigger: A decisive breakout above resistance, supported by strong volum
NSE:LTF
by Arvind_Share_Academy
Swiggy: Is a Major Reversal Around the Corner?Swiggy is trading in a strong long-term downtrend, with the price consistently making lower highs and lower lows inside a falling channel. The recent breakdown below prior support has increased selling pressure, suggesting sellers still dominate the trend. The stock is now approaching an important zone where a potential recovery could develop. According to Elliott Wave theory, the stock appears to be approaching the final leg of its larger corrective decline, labelled Wave 5 of Wave C. The 160
NSE:SWIGGYLong
by BrightRally_Research
A trading opportunity BHEL CMP 421.80 I remember being bearish on this counter around the 300 levels. The stock did correct sharply from there but then took a U turn from 225 and went berserk. Elliott- what has extended the rally is the complex corrective pattern. The previous rally was just the wave A and now the C wave has started. Conclusion - the minimum tgt is at 540 which is still a good 30% from here.
NSE:BHELLong
by singh17vivek
123456789101112131415161718192021222324252627282930313233343536373839404142
…999

Made by humans

Select market data provided by ICE Data Services. Select reference data provided by FactSet. Copyright © 2026 FactSet Research Systems Inc.Copyright © 2026, American Bankers Association. CUSIP Database provided by FactSet Research Systems Inc. All rights reserved. SEC filings and other documents provided by Quartr.© 2026 TradingView, Inc.

SOC 2 CompliantGDPR Compliant
More than a product
  • Supercharts
Screeners
  • Stocks
  • ETFs
  • Bonds
  • Crypto coins
  • CEX pairs
  • DEX pairs
  • Pine
Heatmaps
  • Stocks
  • ETFs
  • Crypto coins
Calendars
  • Economic
  • Earnings
  • Dividends
  • IPOs
More products
  • News Flow
  • Portfolios
  • Fundamental Graphs
  • Yield Curves
  • Options
  • Macro Maps
  • Pine Script®
  • MCP Server
Apps
  • Mobile
  • Desktop
Community
  • Social network
  • Wall of Love
  • Refer a friend
  • Creator program
  • House Rules
  • Moderators
Ideas
  • Trading
  • Education
  • Editors' picks
Pine Script
  • Indicators & strategies
  • Wizards
  • Freelancers
  • Marketplace
Tools & subscriptions
  • Features
  • Pricing
  • Market data
  • Gift plans
Trading
  • Overview
  • Brokers
  • Brokers comparison
  • The Leap
Special offers
  • CME Group futures
  • Eurex futures
  • US stocks bundle
About company
  • Who we are
  • Space mission
  • Blog
  • Help Center
  • Careers
  • Media kit
Merch
  • Tarot cards for traders
  • The C63 TradeTime
Policies & security
  • Terms of Use
  • Disclaimer
  • Privacy Policy
  • Cookies Policy
  • Accessibility Statement
  • Trust Center
  • Security tips
  • Bug Bounty program
  • Status page
Business solutions
  • Widgets
  • Charting libraries
  • Lightweight Charts™
  • Advanced Charts
  • Trading Platform
Growth opportunities
  • Advertising
  • Brokerage integration
  • Partner program
  • Education program
Community
  • Social network
  • Wall of Love
  • Refer a friend
  • Creator program
  • House Rules
  • Moderators
Ideas
  • Trading
  • Education
  • Editors' picks
Pine Script
  • Indicators & strategies
  • Wizards
  • Freelancers
  • Marketplace
Business solutions
  • Widgets
  • Charting libraries
  • Lightweight Charts™
  • Advanced Charts
  • Trading Platform
Growth opportunities
  • Advertising
  • Brokerage integration
  • Partner program
  • Education program
Look FirstLook First