One 97 Communications (PAYTM): Waves, Volume and RSIEducational wave study only. Not a buy or sell recommendation.
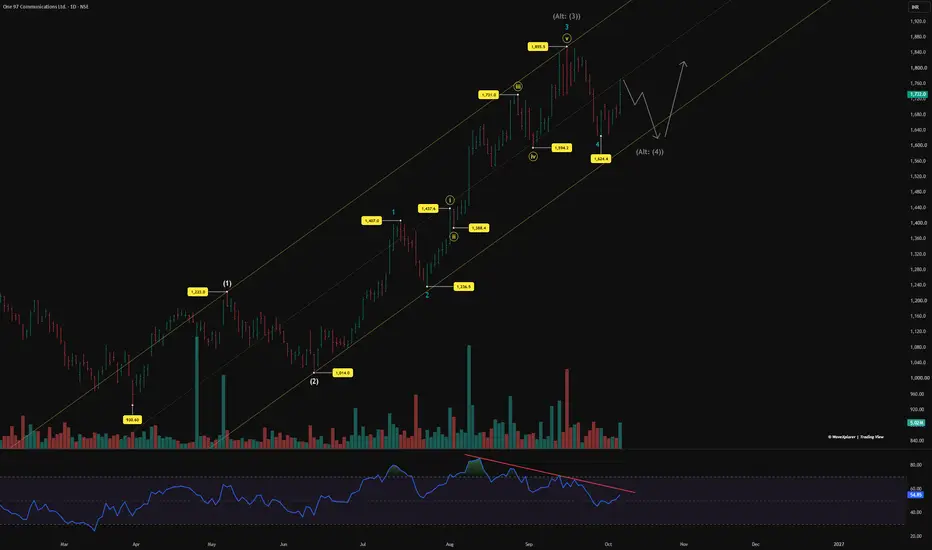
From the March low of 930.6, this stock has moved up in a clean rising channel. The waves, the volume and the RSI all tell the same story.
Wave (1) and (2): Wave (1) went from 930.6 to 1,223 in a choppy, overlapping way. It looks like a leading diagonal. Wave (2) then fell to 1,014, taking back 71.5%. A deep wave 2 is normal after a diagonal.
Wave (3) so far:
Wave 1 topped at 1,407.
Wave 2 fell to 1,236.5.
Wave 3 ran to
Physicswallah (D): DUAL CONFLUENCE BREAKOUTTimeframe: Daily | Chart Scale: Linear
Explosive +5.85% surge today backed by a massive 34.92M volume spike! 🔥
Technical Highlights:
✅ Breakout: Cleared & closed above BOTH an angular AND horizontal resistance (active since Jul '26).
✅ Volume Reversal: Volume rising over the past couple of days, breaking a recent dry spell.
✅ Momentum: Short-term EMAs in positive crossover (Daily/Weekly). MACD & RSI rising. 🚀
Key Levels to Watch:
🎯 Target: 150
🛡️ Support / Pullback: 137.
Epack Prefab Technologies (D): STRUCTURAL BREAKOUTTimeframe: Daily | Chart Scale: Linear
Explosive +7.92% surge today backed by a massive 3.55M volume spike! 🔥
Technical Highlights:
✅ Breakout: Cleared & closed above short-term angular resistance (active since Nov '25).
✅ Volume Reversal: Volume rising over the past couple of days, breaking a recent dry spell.
✅ Momentum: Short-term EMAs in positive crossover (Daily/Weekly). MACD & RSI rising. 🚀
Key Levels to Watch:
🎯 Target: 298
🛡️ Support / Pullback: 259 (Previous re
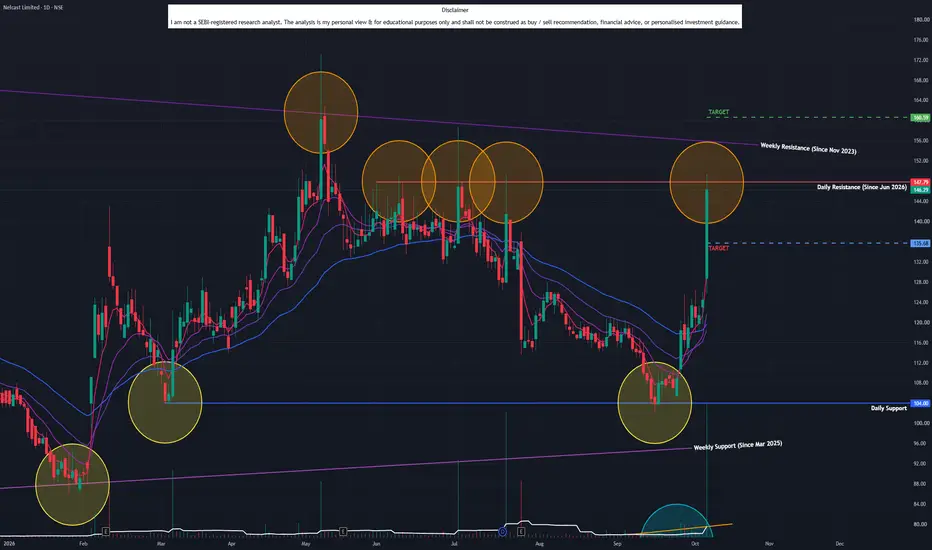
Nelcast Ltd (D): MASSIVE VOLUME SURGETimeframe: Daily | Chart Scale: Linear
Explosive +17.52% surge today backed by a massive 6.71M volume spike! 🔥
Technical Highlights:
⚠️ Resistance Test: Pushed above short-term horizontal resistance (Jun '26) but couldn't secure the close. Needs to also clear a major angular resistance (Nov '23).
✅ Volume Reversal: Volume rising over the last 5-6 days, breaking a recent dry spell.
✅ Momentum: Short-term EMAs in positive crossover (Daily/Weekly/Monthly). MACD & RSI rising. 🚀
Triangle in 4th wave correction. get ready for breakout.Elliott Wave Analysis:-
1st possibility:-
minor wave in major 4th D wave or entire B waveis in a triangle c wave. with red C wave inside the triangel as stop we can go for buy. after a small retracement or immediate entry is also ok.
2 if it breaks the red C wave and A wave and start to go down then it will give a correction from here.
for short term traders its a good option.on buy side with minimal risk.
KSH International cmp 1072.30 Daily Chart since listedKSH International cmp 1072.30 Daily Chart since listed
Support Zone 930 to 1040 Price Band
- Resistance Zone 1080 to ATH 1198 Price Band
- Breakout from Resistance Trendline seems sustained
- Price traversing along the High High Higher Low channel
- Support Zone tested retested while facing Resistance rejection
- Volume in sync with avg traded qty indicating a balanced demand
- IF .... Price Breaks Out from Resistance Zone, expect a fresh uptrend
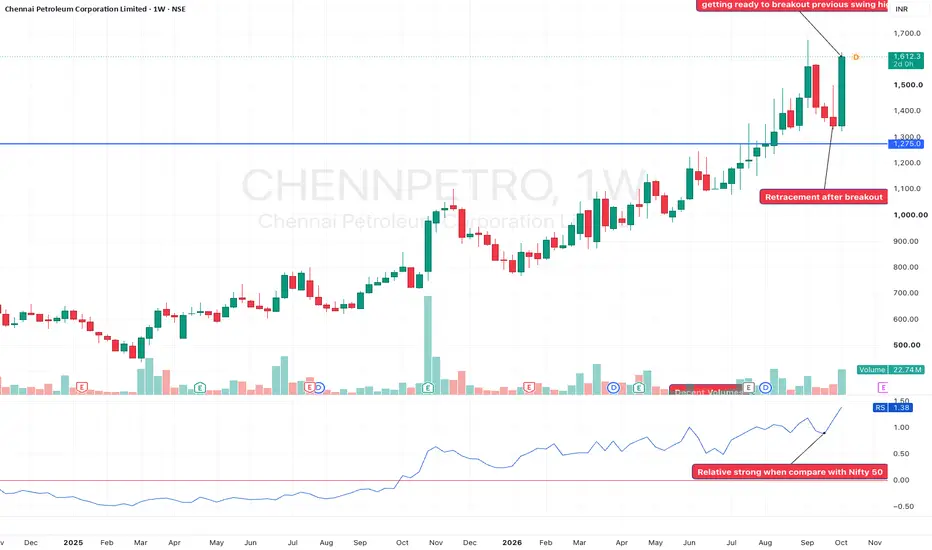
CHENNPETRO All time High BreakoutCHENNPETRO All-Time High Breakout
🔥 A clean example of a All-Time High Breakout → Momentum Continuation setup!
One of the patterns I like watching is how a stock behaves when it finally breaks a major historical resistance after spending a long time below it.
In CHENNPETRO, the structure was quite interesting:
📌 Step 1 – Major Resistance
The ₹1,275 zone acted as a major resistance level and marked the previous All-Time High on the chart.
After a strong recovery from the lower levels, price
Buy Today, Sell Tomorrow for 3-5% - Daily Breakout SetupCINELINE — BTST BREAKOUT SETUP
Entry, Stop Loss & Targets Are Clearly Defined — Helping You Plan Your Trade With Confidence.
📊 Stock Strength: 100/100
(Note: Higher score indicates stronger stock conditions, not guaranteed returns.)
A bullish breakout has appeared on the 1D timeframe with positive price action and strong volume expansion.
🔄 Trade Type: BTST
────────────────────
🎯 TRADE LEVELS
ENTRY: ₹93
🛑 STOP LOSS
ATR SL: ₹87
🎯 TARGETS
3-5%
────────────────────
📈 VOLUME
20D Volume:
ALOKIND — BTST & SWING BREAKOUT SETUPALOKIND — BTST & SWING BREAKOUT SETUP
Entry, Stop Loss & Targets Are Clearly Defined — Helping You Plan Your Trade With Confidence.
📊 Stock Strength: 94/100
(Note: Higher score indicates stronger stock conditions, not guaranteed returns.)
A bullish breakout has appeared on the 1D timeframe with positive price action and strong volume expansion.
🔄 Trade Type: BTST & Swing Trade
────────────────────
🎯 TRADE LEVELS
ENTRY: ₹8.29
🛑 STOP LOSS
ATR SL: ₹7.69
🎯 TARGETS
T1: ₹8.65
T2: ₹9.10
T3: ₹9
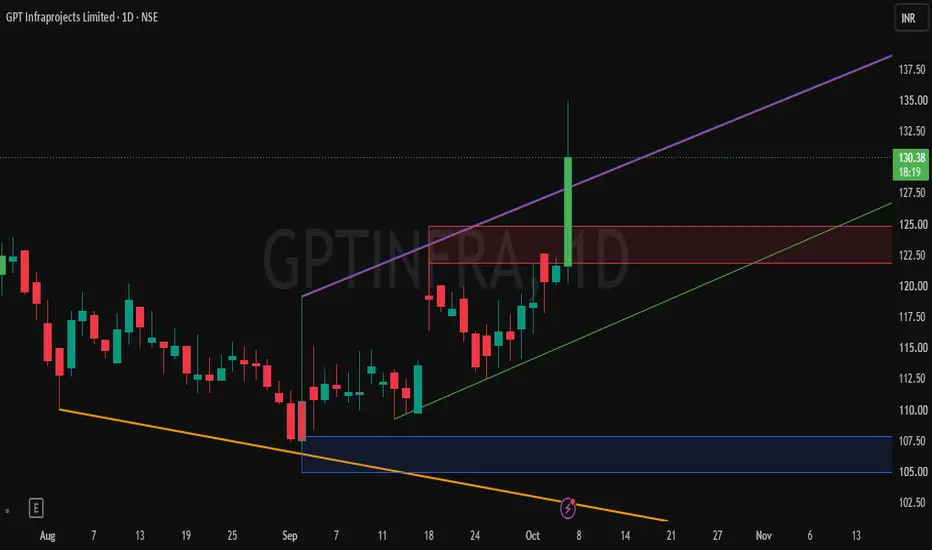
GPTINFRA — BTST & SWING BREAKOUT SETUPGPTINFRA — BTST & SWING BREAKOUT SETUP
Entry, Stop Loss & Targets Are Clearly Defined — Helping You Plan Your Trade With Confidence.
📊 Stock Strength: 75/100
(Note: Higher score indicates stronger stock conditions, not guaranteed returns.)
A bullish breakout has appeared on the 1D timeframe with positive price action and strong volume expansion.
🔄 Trade Type: BTST & SWING
────────────────────
🎯 TRADE LEVELS
ENTRY: ₹130
🛑 STOP LOSS
ATR SL: ₹123
🎯 TARGET
T1: ₹140
────────────────────
📈
Buy Today, Sell Tomorrow for 3-5% - Daily Breakout SetupPVRINOX — BTST BREAKOUT SETUP
Entry, Stop Loss & Targets Are Clearly Defined — Helping You Plan Your Trade With Confidence.
📊 Stock Strength: 75/100
(Note: Higher score indicates stronger stock conditions, not guaranteed returns.)
A bullish breakout setup has appeared on the 1D timeframe with positive price action and strong volume expansion.
🔄 Trade Type: BTST
────────────────────
🎯 TRADE LEVELS
ENTRY: ₹1325
🛑 STOP LOSS
ATR SL: ₹1252
🎯 TARGETS
T1: ₹1364 | 3%
T2: ₹1378 | 4%
T3: ₹1391
TFCILTD — BTST & SWING BREAKOUT SETUPTFCILTD — BTST & SWING BREAKOUT SETUP
Entry, Stop Loss & Targets Are Clearly Defined — Helping You Plan Your Trade With Confidence.
📊 Stock Strength: 90/100
(Note: Higher score indicates stronger stock conditions, not guaranteed returns.)
A bullish breakout has appeared on the 1D timeframe with positive price action and strong volume expansion.
🔄 Trade Type: BTST & Swing Trade
────────────────────
🎯 TRADE LEVELS
ENTRY: ₹152
🛑 STOP LOSS
ATR SL: ₹144
🎯 TARGETS
T1: ₹156
T2: ₹162
T3: ₹169
M&M Is Flashing a Warning: Is the Auto Party Finally Over?M&M is flashing a warning on the weekly chart. ⚠️
A potential Head & Shoulders pattern is taking shape, with price now approaching the rising neckline. After a powerful uptrend, the structure suggests that the character of the trend may be changing.
But here’s what makes this setup interesting:
The auto sector is not fundamentally weak yet.
SUV demand remains strong, EV adoption is accelerating, commercial vehicles are showing healthy growth, and festive demand remains supportive. At the same
ADVIT JEWELS LIMITED - WEEKLY ANALYSIS Fresh break out on weekly time frame. Large volumes appears in previous sessions which may lead further rally. Break out is being seen in almost all the jewelry segment due to festive and wedding season.
RLong
Tata Steel Holds Positive Structure Near Key ResistanceHighlights
Tata Steel is trading around the ₹185–₹187 zone, with the broader structure remaining constructive after recovering from its recent correction.
Immediate resistance is around ₹188–₹190. A sustained breakout above ₹190 could push the stock towards ₹195–₹200, with ₹205 becoming the next major hurdle.
On the downside, ₹181–₹183 is the immediate support zone, while ₹176–₹178 remains the stronger medium-term support. Holding above these levels would preserve the bullish structure.
M
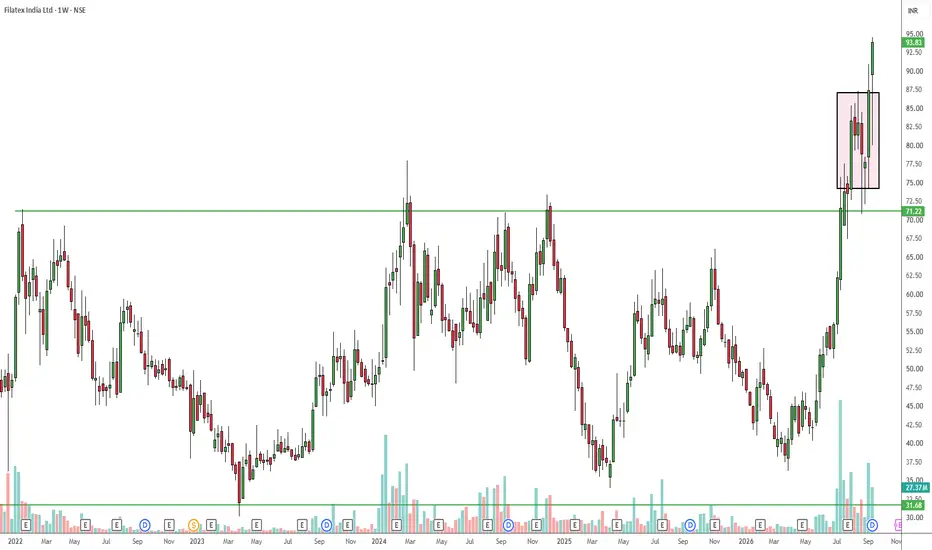
FILATEX : Multi-Year Breakout and Bullish Flag ContinuationBased on the weekly timeframe, Filatex India Ltd is demonstrating strong bullish momentum following a major structural breakout.
Technical Analysis:
The Breakout: The chart shows a decisive breakout above the long-term horizontal resistance line at 71.22, a level that previously capped upside movement.
The Consolidation: Following the initial surge past 71.22, the price entered a healthy period of consolidation, creating a bullish rectangular flag pattern (highlighted by the pink box).
Curren
PB Tech | RISKY CE TRADEPOLICY BAZAAR
1180 CE
Lot Size: 350
CMP: ₹13.25
Best Entry: Near ₹10 (Indicative)
Stop Loss: ₹7
🎯 Targets
T1: ₹21
T2: ₹28
T3: ₹31
⚠️ TSL MUST BE FOLLOWED STRICTLY
Risk Management : High-risk option trade. Trade only with an amount you can afford to lose. Do not average blindly.
Disclaimer : Options trading involves substantial risk of loss. Past performance is not indicative of future results.
SEBI Registered Research Analyst | Naresh G
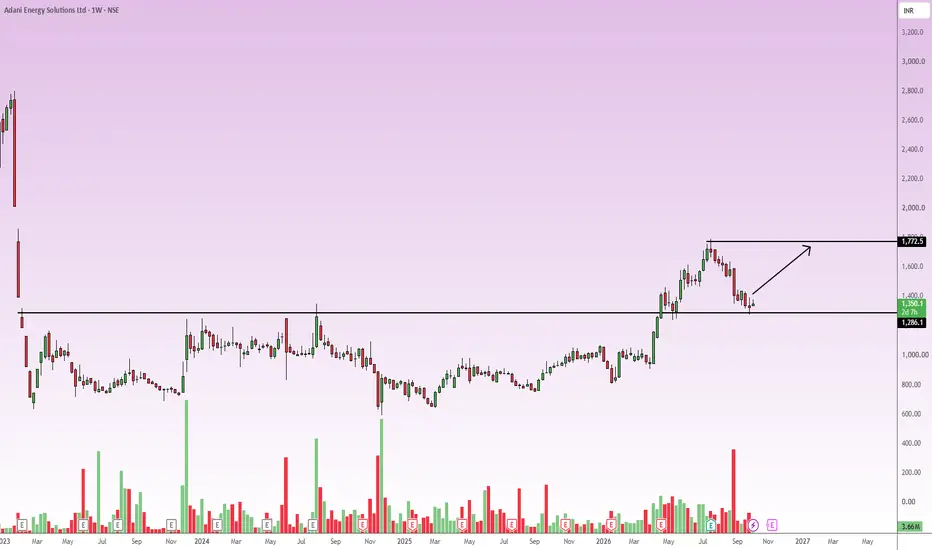
ADANIENSOL Bullish Breakout and Retest at Key SupportAdani Energy Solutions is showing a classic, high-probability bullish setup on the weekly timeframe.
After an extended period of consolidation, the price successfully broke out above the heavy resistance level at 1,286.
Currently, the stock has pulled back to retest this breakout level.
This is a textbook "resistance-turned-support" technical pattern.
The fact that this structure is forming on a weekly chart gives it significant weight.
The combination of the multi-month base breakout and the
NHPC High Risk:Reward Rebound from Major Horizontal SupportBased on the weekly timeframe NHPC is currently at a critical technical juncture, compressing within a large structure bounded by declining highs and a flat support base.
Chart Analysis:
Major Support: The stock has established a highly resilient horizontal support zone around the 71.50 - 72.00 level (marked by the black horizontal line at 71.58).
The price has tested this floor multiple times over the past several months, and we are currently seeing a fresh bounce forming a bullish weekly can