Long
Long
SUNTECK REALITY - gaining strength after trendline retestSUNTECK REALITY LIMITED is gaining strength on daily chart,
it is very easy to analyze a stock and check if the stock is gaining strength,
tip- in technical analysis swing low is considered to be a strong support, so it can be used as an SL.
1. Trendline Breakout & Retest (Bullish Reversal)
The dominant structural movement shows a long-term descending trendline capping the price action since early March. The stock completed a macro double-bottom/accumulation base around the ₹270 zone across April and June. In late June, the price broke cleanly above the descending trendline, pulled back to successfully retest it as support, and is now bouncing upward.
2. Horizontal Supply Zone Ahead
A clear, prominent horizontal supply/resistance band is visible in the upper half of the chart between ₹355 and ₹365.This overhead zone acted as strict resistance in late April and early May, serving as the logical magnet and target for the current bullish leg.
Executable Trading Idea
The chart highlights a classic long (buy) setup using a standard long-position tool following a trendline breakout and structural retest.
▲
│ ◀ (Green Profit Zone: ~9.47%)
│
────────────────── ──────────────────
│
▼ ◀ (Red Risk Zone: ~6.44%)
1. Plan the Entry Trigger: Enter long at the current market price level near ₹330.80 as the stock shows active buying interest off the retest area. Alternative: Accumulate additional shares on minor intraday dips toward the ₹325 – ₹327 level to optimize the risk-to-reward metrics.
2. Manage the Risk (Stop Loss)Place the stop loss safely below the recent swing-low pivot and the breakout confirmation zone. Level: ₹305.65 on a daily closing basis.3. Set the Target (Take Profit)First Target: ₹357.65, which targets the lower boundary of the major horizontal supply zone. Risk-to-Reward Ratio: Approximately 1:1.47, offering a structurally sound, highly favorable probability setup for swing trading.
Disclaimer- This for education and learning purpose only, please do your own due diligence before investing, this is not a buy / sell recommendation, please take advise from your investment advisor. CENTURYPLY is gaining strength on daily chartCENTURYPLY is gaining strength on daily chart,
it is very easy to analyze a stock and check if the stock is gaining strength,
tip- in technical analysis swing low is considered to be a strong support, so it can be used as an SL.
1. Symmetrical Triangle/Pennant Structure (Volatility Compression)
The dominant structural movement across the chart shows a distinct macro-symmetrical triangle formation building out over several months. The upper resistance line connects lower strategic peaks from February and May, while the rising support line connects higher pivot lows from April and June. The price action is currently tightening inside the apex of this triangle, signaling that a major volatility breakout is imminent.
2. Local Trendline Bounce & Consolidation
The stock recently tested and successfully held the lower ascending support line of the triangle structure around ₹735.00.The final daily candle is a green bullish continuation bar trading at ₹765.00, bouncing cleanly off this structural floor and heading toward the mid-range.
Executable Trading Idea
The chart highlights a short-term range play inside the triangle compression before the true macro breakout occurs.
▲
│ ◀ (Green Profit Zone: ~3.91%)
│
────────────────── ──────────────────
│
▼ ◀ (Red Risk Zone: ~3.92%)
1. Plan the Entry Trigger: Enter long at the current price level near ₹765.00 to catch the momentum pushing away from the lower channel support. Alternative: Accumulate on minor intraday dips closer to ₹750.00 to improve your average entry price and minimize capital risk.
2. Manage the Risk (Stop Loss)Place the stop loss strictly below the rising structural support line and the recent localized swing low. Level: ₹735.00 on a daily closing basis.3. Set the Target (Take Profit)First Target: ₹795.00, which aligns with the upper descending trendline resistance zone capping the current triangle structure. Risk-to-Reward Ratio: Exactly 1:1, offering a balanced short-term tactical swing. A macro target near ₹830.00 opens up if the upper triangle boundary is broken on high volume.
Disclaimer- This for education and learning purpose only, please do your own due diligence before investing, this is not a buy / sell recommendation, please take advise from your investment advisor. Fresh breakout on DLFDLF is gaining strength on daily chart,
it is very easy to analyze a stock and check if the stock is gaining strength,
tip- in technical analysis swing low is considered to be a strong support, so it can be used as an SL.
1. Decentering Trendline Breakout (Bullish Continuation)The dominant structural movement across the chart shows a long-term descending trendline capping the price since early January.The stock established lower structural peaks over several months, compressing sellers into a tight range.The final green daily candle shows a clean breakout above this descending line on strong, accelerating bullish momentum.2. Clear Horizontal Resistance FlippedA strong, definitive horizontal resistance zone exists at ₹644.45.This level served as a critical rejection point during previous recovery attempts in May and June.The price has cleared this barrier convincingly, transforming a long-standing ceiling into a fresh floor of support.Executable Trading IdeaThe chart highlights a classic long (buy) setup using a standard long-position tool.text
▲
│ ◀ (Green Profit Zone)
│
────────────────── ──────────────────
│
▼ ◀ (Red Risk Zone)
Use code with caution.1. Plan the EntryTrigger: Enter long around the current breakout market price near ₹667.05.Alternative: Accumulate additional shares on a minor intraday retest of the broken horizontal level near ₹650 – ₹655 to optimize your average entry price.2. Manage the Risk (Stop Loss)Place the stop loss strictly below the broken horizontal structural level and the base of the breakout candle.Level: ₹635.00 on a daily closing basis.3. Set the Target (Take Profit)First Target: ₹704.55, which aligns perfectly with the prominent local swing-high peak visible on the far left side of the chart.Risk-to-Reward Ratio: Approximately 1:1.17 from current price, improving significantly toward 1:2 if entries are secured closer to the ₹655 dip.
Disclaimer- This for education and learning purpose only, please do your own due diligence before investing, this is not a buy / sell recommendation, please take advise from your investment advisor.  Long
Long
Fresh breakout on HDFC AMCHDFC AMC is gaining strength on daily chart,
it is very easy to analyze a stock and check if the stock is gaining strength,
1. Inverted Head and Shoulders (Bullish Reversal)
• The large structural movement across the chart mimics an Inverted Head and Shoulders pattern.
• The Left Shoulder bottoms out near ₹2,350.
• The Head forms a deep capitulation low near the ₹2,225 area.
• The Right Shoulder forms a higher low near ₹2,600, showing that buyers are stepping in earlier than before.
2. Clear Horizontal Neckline Breakout
• A strong, definitive horizontal resistance zone exists around ₹2,740.
• The final green daily candle shows a clean breakout above this ₹2,740 neckline on notable bullish momentum.
________________________________________
Executable Trading Idea
The chart highlights a classic long (buy) setup using a standard long-position tool.
▲
│ ◀ (Green Profit Zone)
│
────────────────── ──────────────────
│
▼ ◀ (Red Risk Zone)
1. Plan the Entry
• Trigger: Enter long at the current breakout level near ₹2,745 - ₹2,750.
• Alternative: Wait for a minor intraday retest of the broken horizontal level at ₹2,740 to secure a safer entry point.
2. Manage the Risk (Stop Loss)
• Place the stop loss right below the recent consolidation base and structural breakout candle.
• Level: ₹2,670 on a daily closing basis.
3. Set the Target (Take Profit)
• First Target: ₹2,875, which aligns with the local swing-high resistance visible on the left side of the chart.
• Risk-to-Reward Ratio: Approximately 1:1.7, offering a structurally sound risk profile for swing trading.
________________________________________
Critical Risk Factors to Watch
• False Breakout Trap: If the price closes back below ₹2,720, the breakout fails. This means it could trap buyers in a "fakeout".
• Volume Confirmation: Watch for sustained, above-average daily volume to ensure institutions are backing this upward push.
Disclaimer- This for education and learning purpose only, please do your own due diligence before investing, this is not a buy / sell recommendation, please take advise from your investment advisor. Cords Cable Industries LtdA small cap company with decent fundamentals & valuations
Date 03.07.2026
Cords Cabel
Timeframe : Weekly Chart
Cmp 208
Technical breakout buy 213+
It is engaged in manufacturing Power Cables (upto 3.3 kV), Control Cables, and Instrumentation Cables.
Clients:
(1) Domestic:
BHEL, Larsen & Toubro, Cairn, Delhi Metro, ONGC, Indian Oil, Siemens, Honeywell, Asian Paints, Sun Pharma
(2) International:
ADNOC, Magadi Soda, Saudi Electricity Company, L & T Oman, Excel Technical & Industrial Supplies, QSTec, ITC
Geographical Revenue Split
(1) Export Sales ~3%,
(2) Domestic Sales~97%
Revenue Split by Product
(1) Power Cables: 46%
(2) Instrumentation Cables: 33%
(3) Control Cables: 21%
Product Profile & Application
(1) Thermocouple Cables
(2) Control & Electrical Wiring Cables
(3) Instrumentation, Signal and Data Cables
(4) Power Cables
Note* The core of the order book is driven heavily by the solar and renewable energy sectors, alongside long-term institutional requirements from hydrocarbons (refineries), metro rail networks, and public power distribution utilities
Valuations
(1) Stock Pe 13.5
(2) Roce 18%
(3) Roe 11%
(4) Book Value 1.38X
(5) Sales Growth (ttm) 20%
(6) Profit Growth (ttm) 41%
(7) Cfo/Op 83%
(8) Opm 6.11%
(9) Peg 0.32
(10) Ev/Ebita 5.5
Regards,
Ankur Singh  Long
Long
Long 
Long 
 Long
Long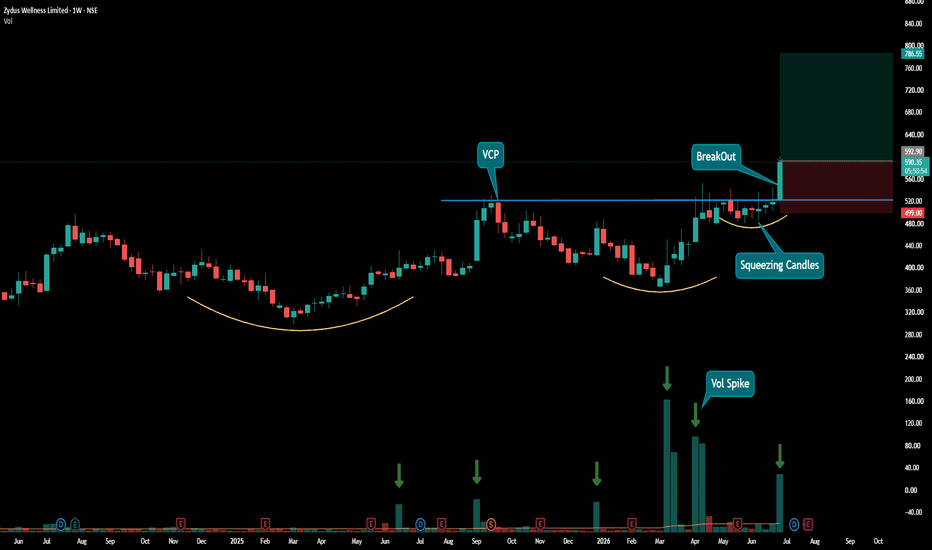
 Long
Long
 Long
Long
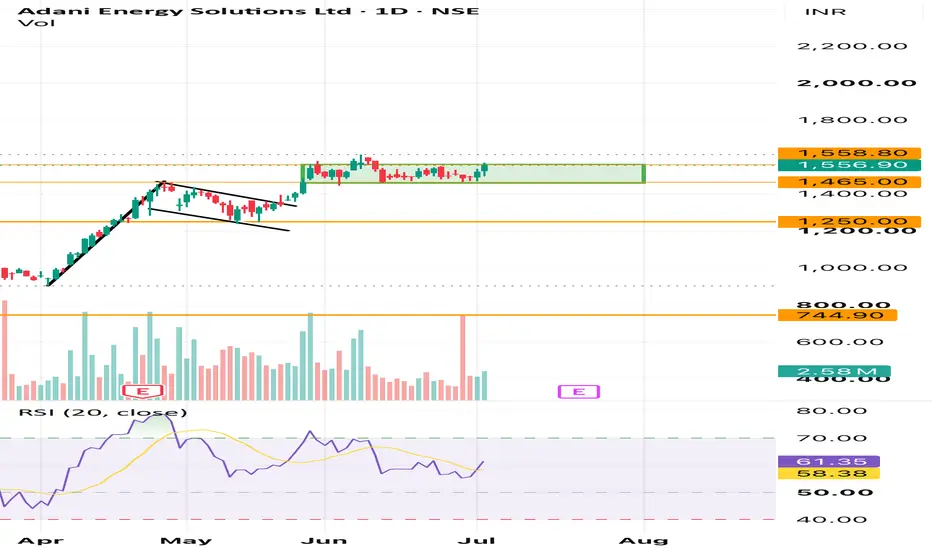
Adani Energy Solutions Ltd. – Daily Chart ReviewAdani Energy Solutions Ltd. – Daily Chart Review
Adani Energy Solutions continues to trade in a strong primary uptrend, but the price has spent the last several weeks consolidating in a narrow range between ₹1,465 and ₹1,560. This appears to be a healthy pause after a sharp impulsive rally rather than a sign of trend reversal.
Technical Observations
* Rectangle Consolidation: Price is respecting a well-defined sideways range. Such consolidations often act as continuation patterns when they occur after a strong rally.
* Trend Structure: Higher highs and higher lows remain intact on the daily timeframe, indicating bulls are still in control.
* Volume: Volume has moderated during consolidation, which is constructive. A breakout accompanied by above-average volume would significantly improve the probability of trend continuation.
* RSI: RSI is around 61 and has turned upward after cooling off from earlier highs. This suggests bullish momentum is rebuilding. No major bearish divergence is visible at the moment.
Key Levels
* Immediate Resistance: ₹1,560–1,565
* Major Support: ₹1,465
* Positional Support: ₹1,250
Trading Plan
Bullish Scenario
* A decisive daily close above ₹1,560–1,565 with strong volume can trigger the next leg of the uptrend.
* Possible upside targets:
* ₹1,650
* ₹1,730
* ₹1,820 (if momentum remains strong)
Bearish Scenario
* Failure to hold ₹1,465 may result in profit booking towards ₹1,380–1,350 initially.
* The broader trend remains bullish unless the stock starts closing below ₹1,250.
Conclusion
The stock is showing characteristics of a bullish continuation setup. Consolidation after a sharp advance generally strengthens the trend by allowing momentum indicators to cool off. Traders should watch for a high-volume breakout above the range rather than anticipating it prematurely. Until the range is resolved, expect choppy price action.
Disclaimer: This analysis is for educational purposes only and reflects my personal interpretation of the chart. Please conduct your own research and manage risk appropriately before making any investment decisions.  Long
Long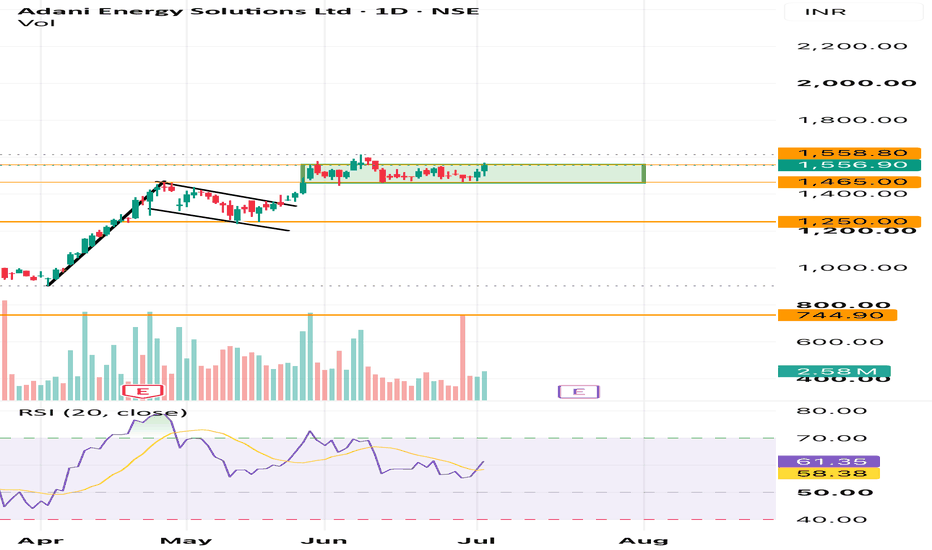
 Short
Short