NVDA
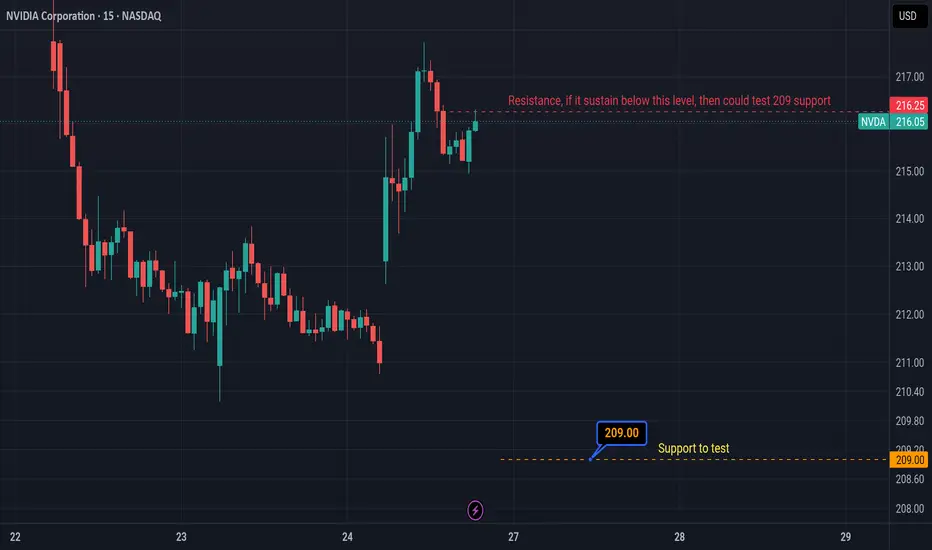
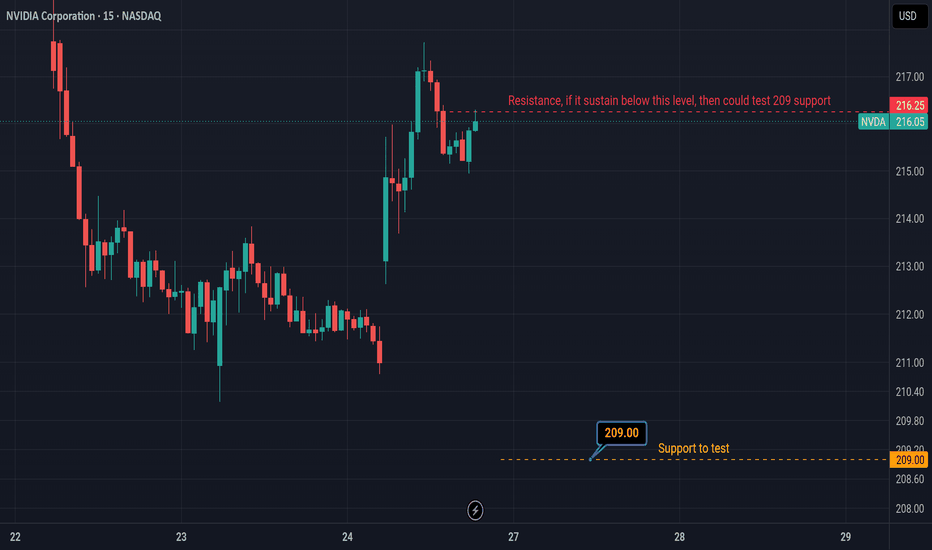
NVDA 15m: Intraday Distribution and Rotation to Support Plan
• Ticker: NVDA (NVIDIA Corporation) via NASDAQ
• Timeframe: 15-Minute (15m)
• Current Price: 215.91 USD (+0.05 / +0.02%)
Key Technical Levels
• Overhead Resistance Target: 216.25 USD (Major structural ceiling labeled on the chart as: "Resistance, if it sustain below this level, then could test 209 support").
• Defined Support Base: 209.00 USD (The major horizontal target floor marked by the label: "209.00 Support to test").
Mar
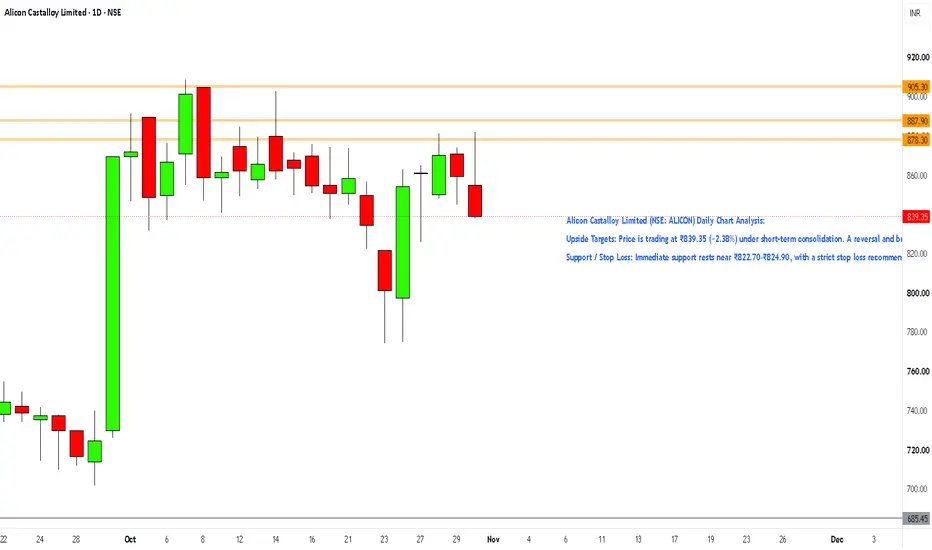
#ALICONAlicon Castalloy Limited (NSE: ALICON) Daily Chart Analysis:
Upside Targets: Price is trading at ₹839.35 (−2.38%) under short-term consolidation. A reversal and breakout above immediate resistance opens the path toward mapped targets at ₹865.10 (T1), ₹876.50 (T2), and ₹889.35 (T3).
Support / Stop Loss: Immediate support rests near ₹822.70–₹824.90, with a strict stop loss recommended below the major swing low / support level at ₹807.00 to manage downside risk.
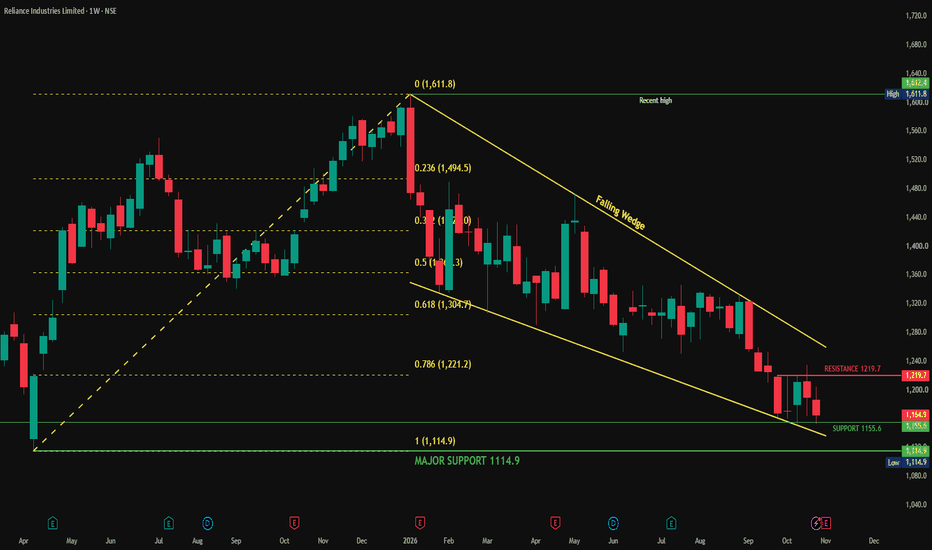
Reliance: 4 Weeks Defending 1,155, Wedge Breakout Next?Overview
Reliance closed the week at 1,164.9, down 25.1 points or 2.11%. It has given back about 90% of its rally from the 2025 low (1,114.9) to the January high (1,611.8), and is trading below the 0.786 Fib level (1,221.2). The more interesting part is where it has stopped. Price is sitting on the 1,155.6 support, inside a falling wedge that has been forming since January, and buyers have defended that zone for four weeks in a row.
Follow-up on Our Earlier Reliance Ideas
In our September ide
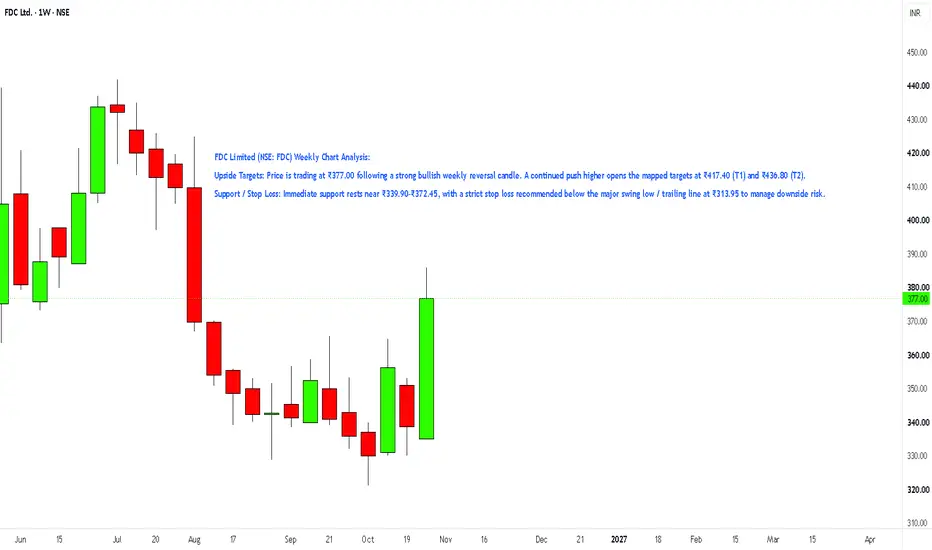
#FDCFDC Limited (NSE: FDC) Weekly Chart Analysis:
Upside Targets: Price is trading at ₹377.00 following a strong bullish weekly reversal candle. A continued push higher opens the mapped targets at ₹417.40 (T1) and ₹436.80 (T2).
Support / Stop Loss: Immediate support rests near ₹339.90–₹372.45, with a strict stop loss recommended below the major swing low / trailing line at ₹313.95 to manage downside risk.
RELIANCE INDUSTRIES Q2 FY27 ANALYSIS# 🚀 RELIANCE INDUSTRIES Q2 FY27: RECORD REVENUE, STRONG PROFIT GROWTH & O2C BOOM!
Reliance Industries Ltd. (NSE: RELIANCE) | Q2 FY27 Results
Reliance Industries delivered a strong performance in Q2 FY27, supported by exceptional Oil-to-Chemicals (O2C) earnings and continued growth in digital services. However, retail profitability and higher operating costs remain areas to monitor.
📊 KEY FINANCIAL HIGHLIGHTS
Gross Revenue: ₹3,62,268 crore, up **27.8% YoY** and approximately 6.5% QoQ.
EB
#FLUOROCHEMGujarat Fluorochemicals Limited (FLUOROCHEM) Weekly Chart Analysis:
Upside Targets: Price is consolidating near ₹4,248.20 (+0.29%). A confirmed breakout opens the path toward mapped targets at ₹4,650.30 (T1), ₹4,750.60 (T2), and ₹4,912.90 (T3).
Support / Stop Loss: Immediate support sits near the ₹4,129.05–₹3,983.80 zone, with a strict stop loss recommended below the major swing low / support level at ₹3,749.70 to manage downside risk.
#BLUESTARCOBlue Star Limited (NSE: BLUESTARCO) Weekly Chart Analysis:
Upside Targets: Price is trading strong at ₹1,627.90 (+8.60%). A sustained continuation opens the path toward mapped targets at ₹1,663.30 (T1), ₹1,667.70 (T2), and ₹1,723.40 (T3).
Support / Stop Loss: Immediate support sits near the ₹1,553.50–₹1,514.70 zone, with a stop loss recommended below the major swing low / buy pivot around ₹1,453.60 to manage downside risk.
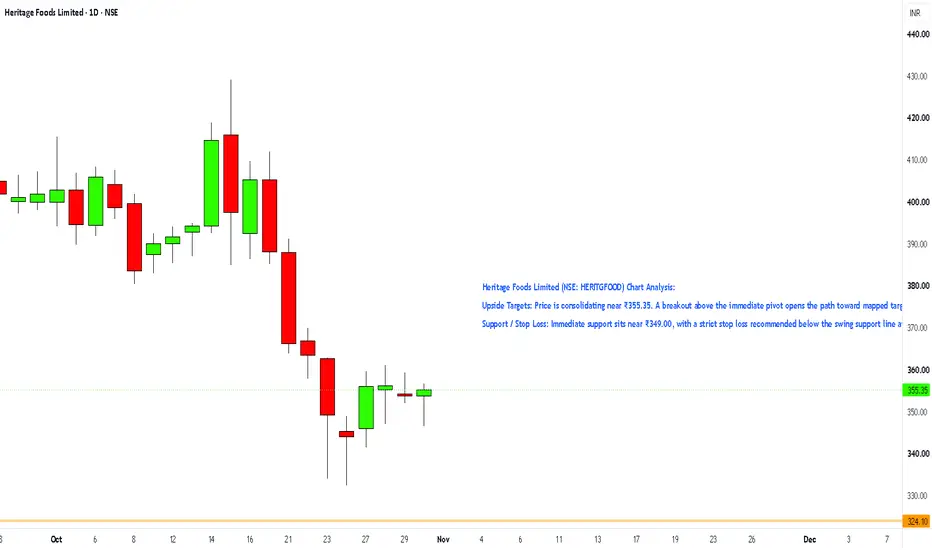
#HERITGFOODHeritage Foods Limited (NSE: HERITGFOOD) Chart Analysis:
Upside Targets: Price is consolidating near ₹355.35. A breakout above the immediate pivot opens the path toward mapped targets at ₹359.15 (T1), ₹365.45 (T2), and ₹375.60 (T3).
Support / Stop Loss: Immediate support sits near ₹349.00, with a strict stop loss recommended below the swing support line at ₹331.30 (or ₹324.10 for a wider buffer) to invalidate downside risk.
#INFYUpside Targets: Price is testing resistance at ₹1,185. A sustained breakout above ₹1,185 targets the next major resistance levels at ₹1,215 and ₹1,240.
Support / Stop Loss: Immediate support sits at the breakout pivot around ₹1,149, with a strict stop loss recommended below the recent swing low near ₹1,126 to limit downside risk.
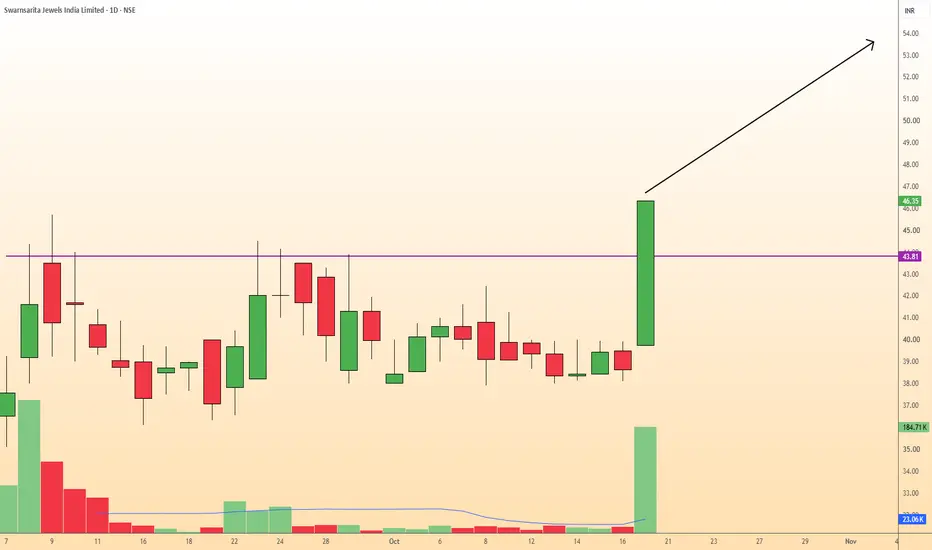
SWARNSAR Strong Resistance Breakout with Massive VolumeThe daily chart of Swarnsarita Jewels India Limited indicates a decisive bullish breakout above a major resistance zone.
For several weeks, the price consolidated and faced consistent rejection near the 43.80 - 44.00 mark, which is marked by the purple horizontal line.
In the most recent session, the stock shattered this resistance with a massive, full-bodied bullish candle, closing at 46.35 (+19.98%).
The most compelling aspect of this setup is the volume confirmation. The breakout occurred
BANKINDIA Consolidation BreakdownOn the daily timeframe, Bank of India has been trading within a prolonged consolidation box, roughly bounded between the 136 support and 152 resistance zones, since March.
Within the latter half of this zone, a descending trendline indicates lower highs, reflecting building selling pressure before the drop.
The recent price action demonstrates a decisive breakdown below the lower support boundary.
This breakdown candle closed strongly near 129.99 and was accompanied by a noticeable spike in v
UJJIVANSFB Multi-Year Breakout and Retest OpportunityLooking at the montHLY chart for Ujjivan Small Finance Bank, we can observe a classic and powerful multi-year market structure.
The horizontal black line at 61.90 has acted as a critical level of historical resistance, dating back to the major market drop in early 2020.
After years of accumulation and a steady uptrend since 2022, the price successfully broke out above this 61.90 macro-resistance in early 2026 with strong bullish momentum, establishing a new swing high.
Currently, the stock is
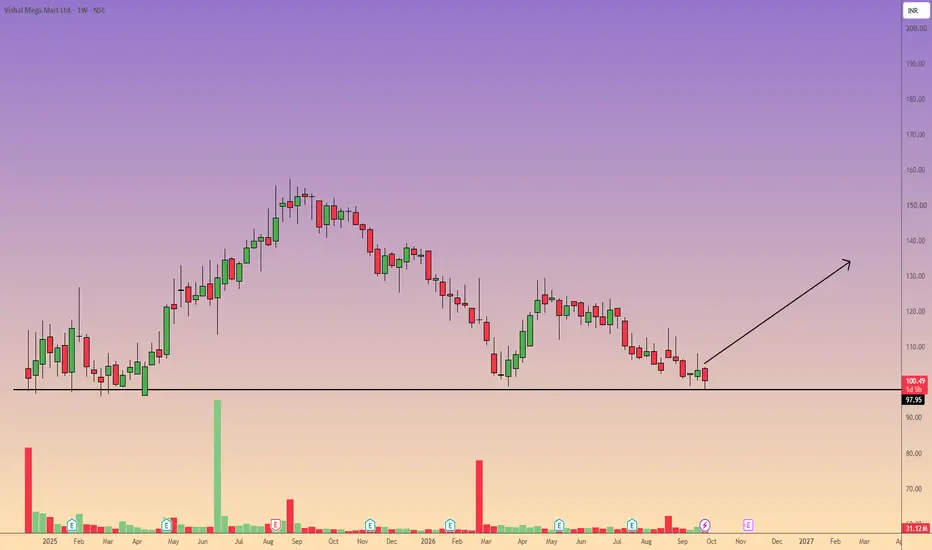
VMM Testing Critical Weekly SupportHello traders,
Looking at the weekly chart for Vishal Mega Mart Ltd. (NSE), we can observe a prolonged corrective phase after the stock peaked near the ₹150–155 range late last year.
The price has been printing lower highs and lower lows for several months, reflecting strong bearish momentum.
However, the stock is currently hovering at ₹100.60 and is testing a major historical support level at ₹97.95 (indicated by the solid black horizontal line).
This is a critical "make-or-break" zone. Histo
QPOWER Ascending Triangle Breakout & Successful Retest on DailyOverview & Technical Logic
Analyzing the daily chart for Quality Power Electrical Equipments Ltd., we can observe a classic bullish continuation setup.
Over the past few months, the stock has been respecting an ascending trendline, steadily forming higher lows since May.
This accumulation phase culminated in a strong breakout above the major horizontal resistance level at 1,409.8.
Following the breakout, the price action demonstrated a textbook retest.
The previous resistance at 1,409.8 acte
DYNAMATECH Strong Ascending Triangle Breakout with VolumeDynamatic Technologies Limited is showing a textbook ascending triangle breakout on the daily timeframe.
Over the past several months, the price has been respecting a rising trendline, making consistently higher lows.
This price action indicates strong accumulation and sustained buying pressure at lower levels.
Simultaneously, the price faced a stiff horizontal resistance zone around the 12,608 level.
In the most recent trading sessions, the stock has decisively broken out above this key res
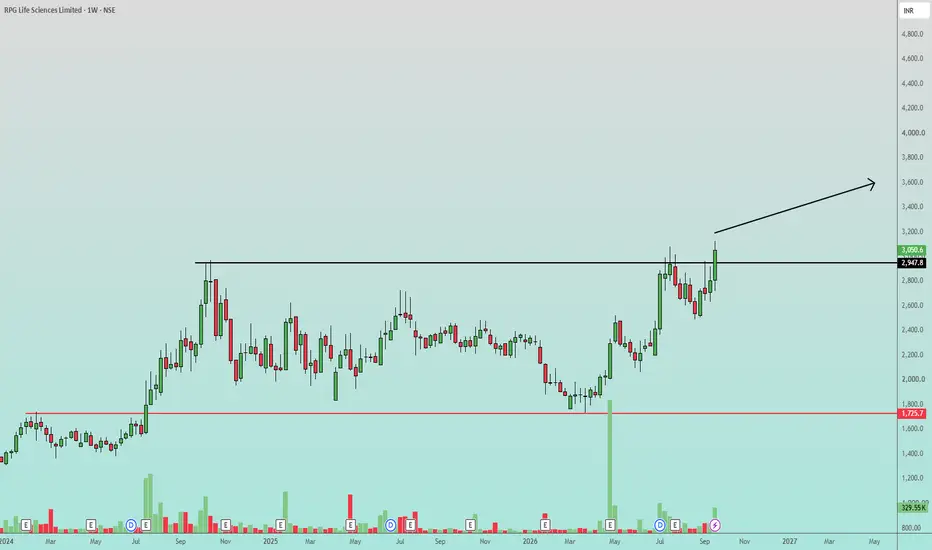
RPGLIFE Strong Weekly Breakout Above Multi-Month ResistanceTechnical Analysis & Context:
RPG Life Sciences Limited is demonstrating strong bullish momentum on the weekly timeframe. After an extended period of consolidation, the stock has successfully broken out above a critical, multi-month resistance zone near the 2947.8 level.
Looking at the broader structure, the stock built a massive base with historical support holding firm around the 1725.7 mark (indicated by the red line).
Following this accumulation phase, it tested the ~2950 resistance multip
SOUTHBANK Strong Breakout from Consolidation Accompanied by VolBased on the technical structure in South Indian Bank is exhibiting a classic bullish continuation setup on the weekly timeframe.
Chart Analysis: The stock has been trading within a well-defined rectangular consolidation box (roughly between the 43.50 support and 49.00 resistance levels) since early June.
The most recent weekly candle shows a decisive breakout above the upper boundary of this range, closing strongly at 49.95.
Notably, this breakout is validated by a significant surge in buyin
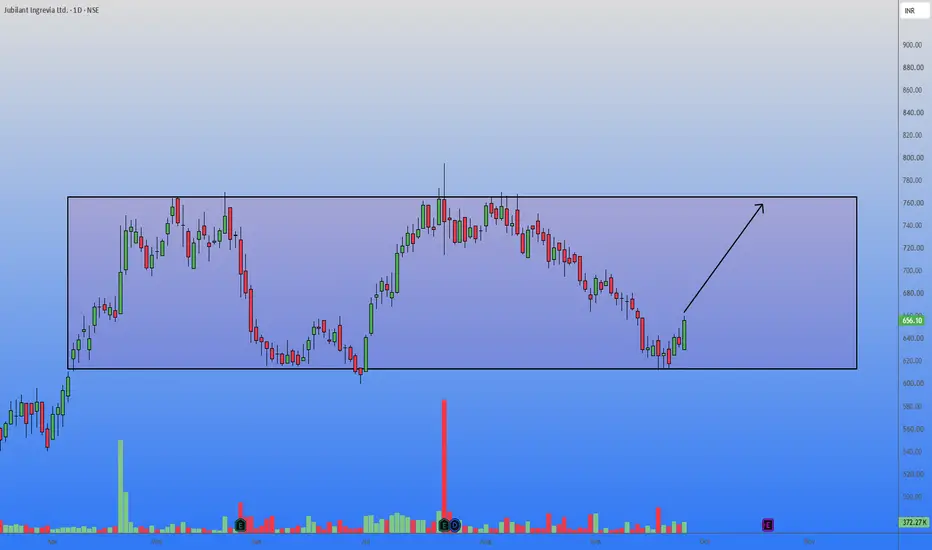
JUBLINGREA Bullish Bounce from Daily Consolidation SupportLooking at the daily chart for Jubilant Ingrevia Ltd., the stock has been trading within a well-defined rectangular consolidation phase for several months.
Price action is cleanly oscillating between a strong support floor and a key resistance ceiling, presenting a classic range-bound technical setup.
Technical Observation:
The stock recently retested the lower boundary of this consolidation box (major support) and has shown a strong bullish bounce from these levels.
The recent daily candle a
TIMEX : High-Volume Breakout Above Key Resistance.As shown in the daily chart referenced Timex Group India Limited has staged a powerful bullish breakout.
The asset surged past its immediate upper resistance zone, marked by the red horizontal line at 684.80, closing the session significantly higher at 714.20 (+16.87%).
This upward expansion was preceded by a period of consolidation where the price established a firm structural support base near the black horizontal line at 588.60.
The breakout is validated by a massive volume spike of 6.65
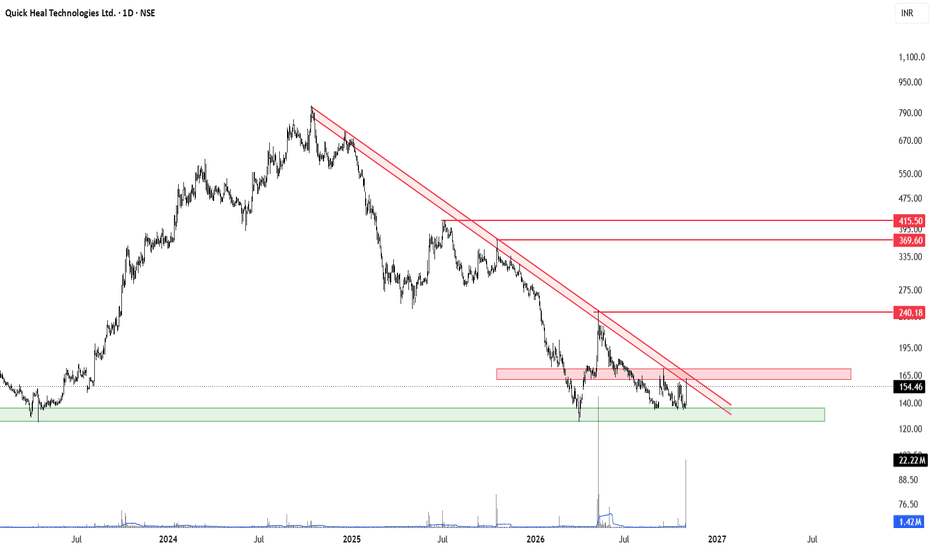
QUICK HEAL – Strong Buying Emerges at Multi-Year Support! 📈 QUICK HEAL – Strong Buying Emerges at Multi-Year Support! Is a Trend Reversal Underway?
Quick Heal has delivered a strong bullish candle, gaining +12.92% to close at ₹154.46, accompanied by a significant volume spike of 22.22M shares.
After an extended decline within a multi-month descending channel, the stock has shown a strong recovery from its demand zone around ₹125–135.
The latest candle has pushed above the descending trendline, suggesting a potential change in the short-term trend. H