Long
Long
 Long
Long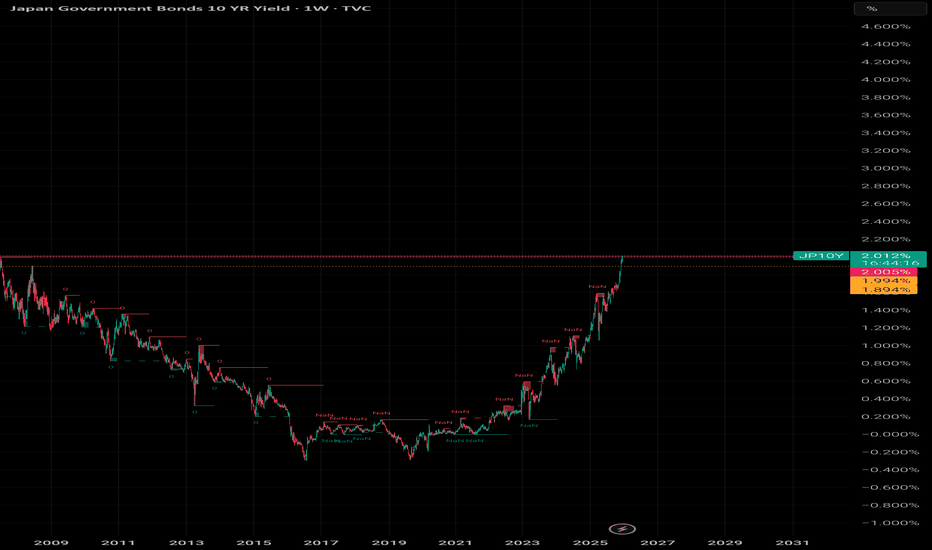
Long 
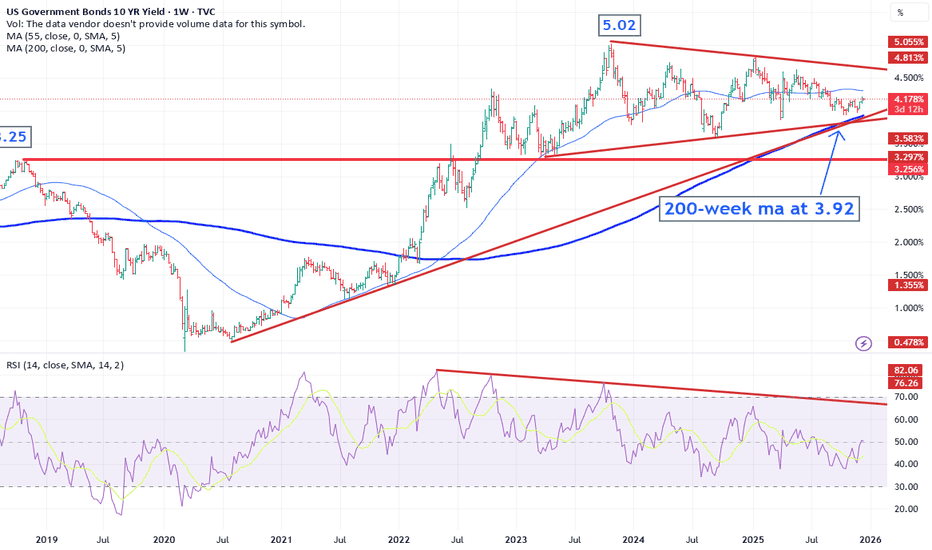
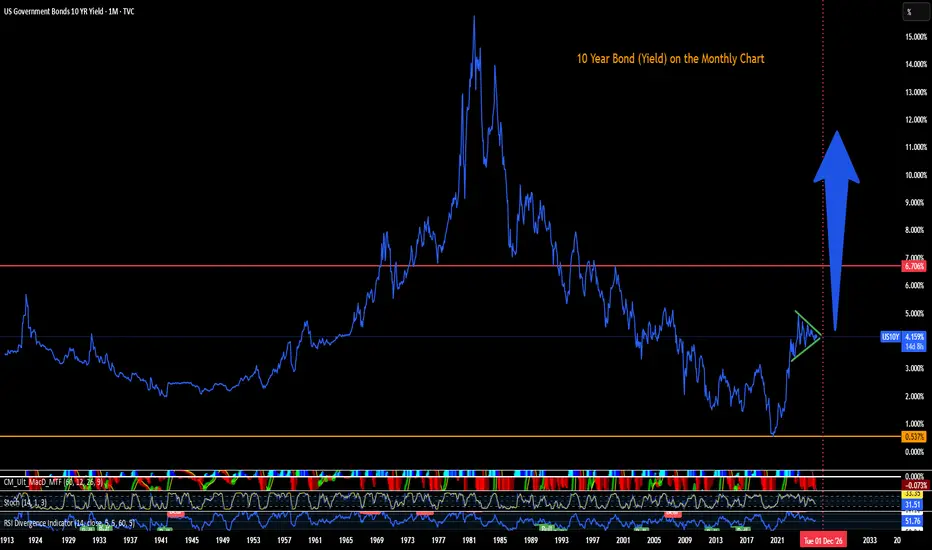
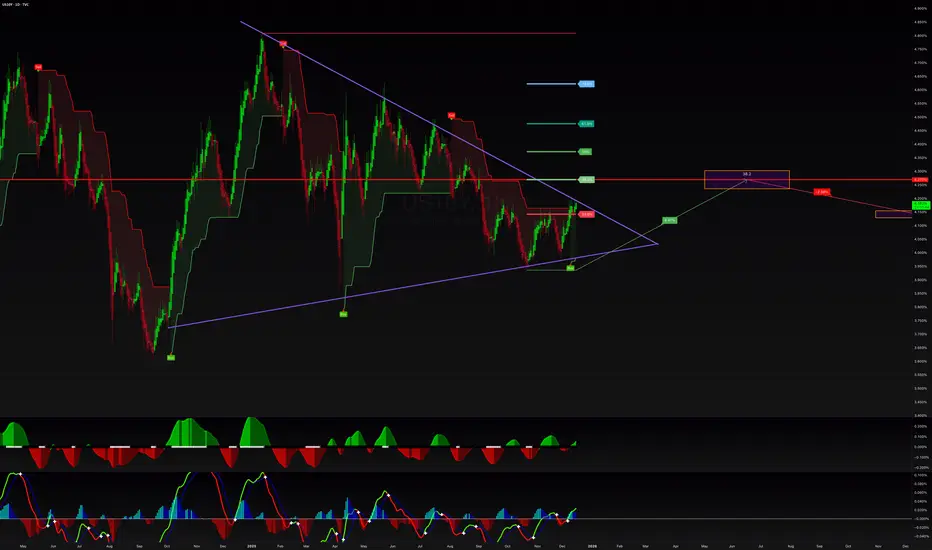
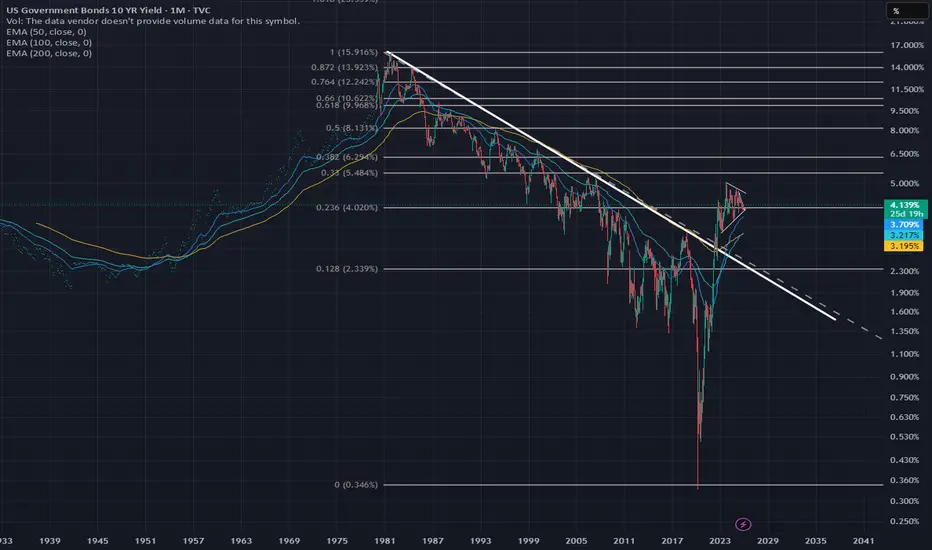
US 10Y TREASURY: Testing 4,2%The Fed decreased interest rates by 25 basis points as it was expected. The economic outlook remains modestly positive, with risks on both inflation and jobs. The Fed does not perceive that the inflation would return to targeted 2% during next year. That could be a short summary of the latest FOMC meeting, held last week. The 10Y Treasury benchmark yield traded higher, despite a short drop toward the 4,1%. Friday brought another shift back to 4,19%, after Chicago Federal reserve President Austan Goolsbee noted that the Fed should not lower interest rates further, after three cuts since September. This was not in alliance with market expectations, as investors are pricing at least two rate cuts during 2026.
The market is currently testing the 4,2% 10Y yields. It could be expected that this trend will continue also during the week ahead. On the other hand some modest relaxation in yields is also probable, but only till the level of 4,15%. At this moment, investors are trying to assess the course of monetary actions during next year, in which sense, some volatility might prevail.
Long 
Swap Trading Secrets1. What Is a Swap?
A swap is a contract between two parties to exchange cash flows or financial obligations for a specified period. These exchanges typically involve interest rates, currencies, commodities, or credit risks.
Think of a swap like this:
You have one type of cash flow.
I have another.
We exchange them because each of us prefers the other’s structure.
This exchange helps both parties balance risk, stabilize cash flows, or lock in profits.
Swaps are custom-designed, traded over the counter (OTC), and not listed on exchanges.
2. Major Types of Swaps
To understand swap trading secrets, you first need to know the main types used globally:
1. Interest Rate Swaps (IRS)
Most common type.
Party A pays a fixed rate.
Party B pays a floating rate.
Useful for:
Hedging interest costs.
Managing debt efficiently.
2. Currency Swaps
Exchange principal + interest in different currencies.
Useful for:
Reducing currency risk.
Accessing foreign loans at cheaper rates.
3. Commodity Swaps
Fixed vs floating commodity prices.
Useful for:
Hedging input costs (oil, metals, agri).
Locking profit margins.
4. Credit Default Swaps (CDS)
Insurance against bond default.
Useful for:
Hedging credit risk.
Speculating on company survival.
5. Equity Swaps
Exchange equity returns for interest or another equity index.
Useful for:
Gaining exposure without owning the asset directly.
3. Why Swaps Are Considered a “Secret Weapon”
Swaps provide powerful advantages that many traders do not see:
A. Hidden Leverage
Institutions gain exposure to markets:
WITHOUT owning assets,
WITHOUT large upfront capital.
This makes swaps an efficient way to amplify returns.
B. Off-Balance-Sheet Benefits
Swaps can shift risks without moving assets on books, making financial statements look cleaner.
C. Customization
Unlike futures, swaps are tailor-made:
Amount
Duration
Payment structure
Asset type
Currency
This gives institutions almost unlimited flexibility.
D. Access to Better Pricing
Banks and hedge funds use swaps to:
Access lower foreign interest rates
Reduce borrowing costs
Hedge exposures cheaply
This pricing advantage is one of the biggest swap trading secrets.
E. Tax Optimization
Some institutions use swaps to:
Receive returns without triggering capital gains
Change income types for tax benefits
4. How Institutions Actually Use Swap Trading
Now let’s explore the real-world secrets of how swaps are used.
Secret 1: Hedging Interest Rate Risk Like a Pro
When interest rates rise or fall, companies with loans face huge cost changes.
So they use Interest Rate Swaps:
If expecting rates to rise → pay fixed, receive floating.
If expecting rates to fall → receive fixed, pay floating.
This stabilizes their cash flows.
Example:
A company with a floating-rate loan fears rising rates.
They enter a swap to pay 5% fixed and receive floating.
If floating rates shoot to 8%, the swap saves them millions.
Secret 2: Currency Swaps for Cheaper Global Loans
Corporations often borrow in foreign currencies.
But banks offer different interest rates in different countries.
So companies use currency swaps to borrow where rates are cheaper, then swap back to their local currency.
Example:
An Indian company might borrow yen at 1% instead of rupees at 7%, then swap obligations with a Japanese firm.
This cuts financing cost dramatically.
Secret 3: Equity Exposure Without Buying Shares
Hedge funds love equity swaps because they:
Get full market returns
Avoid ownership reporting
Avoid voting rights
Avoid taxes on buying/selling stocks
Can build secret positions
This is how some funds take huge equity bets without showing them publicly.
Secret 4: Commodity Swaps to Lock Prices Years Ahead
Airlines, manufacturers, and refiners use commodity swaps to stabilize costs.
Example:
An airline may fix jet fuel prices for three years through swaps, eliminating volatility.
This ensures consistent profit margins regardless of market swings.
Secret 5: Credit Default Swaps for Hidden Speculation
CDS contracts let traders “bet” on whether a company will default.
Professionals use CDS to:
Hedge corporate bond exposure
Take leveraged positions on credit quality
Profit from market panic or recovery
Some hedge funds made billions during the 2008 crisis via CDS trades.
5. Secret Trading Strategies Using Swaps
Let’s break down advanced strategies used in swap trading.
A. Swap Spread Trading
Traders exploit differences between:
Swap rates
Government bond yields
If swap spreads widen or narrow unexpectedly, traders enter opposite positions to profit from mean reversion.
B. Curve Steepening / Flattening Strategies
Traders use interest rate swaps to bet on the shape of the yield curve.
Steepener: receive fixed (long end), pay fixed (short end)
Flattener: opposite
These are used when expecting macroeconomic shifts.
C. Currency Basis Arbitrage
Banks exploit differences between:
Currency forward rates
Interest rate differentials
Swap rates
This arbitrage generates low-risk profits.
D. Synthetic Asset Exposure
Traders use swaps to create:
Synthetic bonds
Synthetic equity positions
Synthetic commodities
This avoids capital requirements and tax implications.
E. Hedged Carry Trades
Funds borrow in low-rate currencies and swap into higher-rate currencies while hedging currency risk.
This generates predictable “carry” income.
6. Key Risks in Swap Trading
Swaps are powerful, but they carry risks:
1. Counterparty Risk
If your swap partner defaults, you lose.
(This is what happened with Lehman Brothers.)
2. Liquidity Risk
Swaps cannot be easily sold like stocks.
3. Interest Rate / Market Risk
If the market moves against your swap position, you face large losses.
4. Valuation Complexity
Swaps require mark-to-market calculations.
5. Legal & Operational Risk
Documentation errors can cause disputes.
7. Why Retail Traders Rarely Use Swaps
Swaps require:
Large contracts
Institutional relationships
Legal agreements
Creditworthiness
Sophisticated pricing models
However, retail traders indirectly benefit through:
Mutual funds
ETFs
Banks
Derivative products
These institutions use swaps behind the scenes to improve performance.
Conclusion
Swap trading is one of the financial world’s most powerful, secretive, and flexible tools. Institutions use swaps to hedge risk, create leverage, optimize taxes, reduce financing costs, and structure sophisticated trading strategies across interest rates, currencies, commodities, and credit.
Even though retail traders rarely trade swaps directly, understanding them gives you insights into how the world’s largest financial players operate. If you understand swap dynamics, you gain a deeper understanding of global money flows, risk management, and institutional market behavior. Education 
 Long
Long
How US03M Are Front‑Running the Next Fed Cut The link between bonds and rates
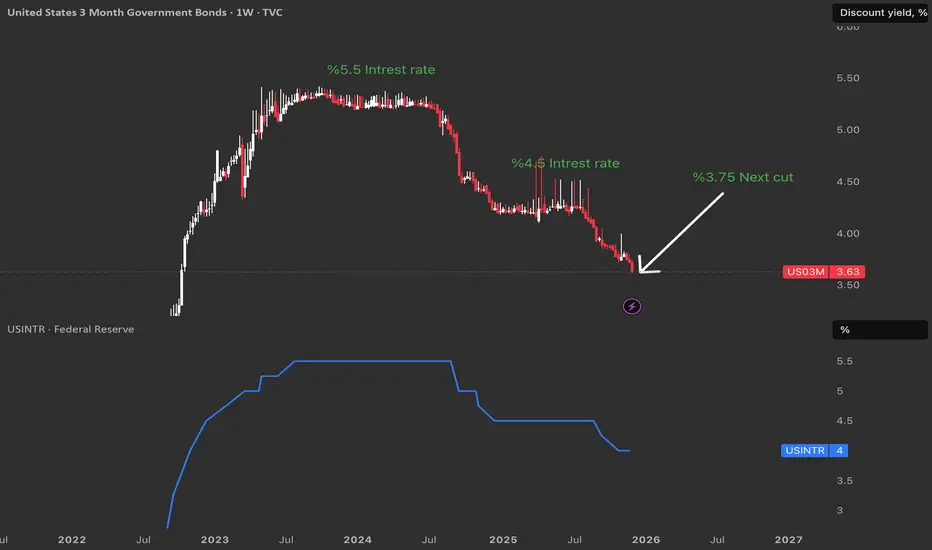
The US03M tracks the yield investors demand to lend to the U.S. government for three months, and this yield moves closely with the Federal Funds Rate set by the Fed.
When the Fed hikes, short‑term Treasury yields usually rise toward the new policy rate, and when markets expect cuts, these same yields start dropping before the official decision.
Why US03M front‑runs the Fed 🕒
US03M is a pure play on near‑term monetary policy, so traders price in where they think the Fed Funds Rate will be over the next quarter, not where it is today.
As a result, sharp declines in US03M while the official Fed rate is still flat often signal that fixed‑income markets are betting on upcoming rate cuts.
Why a 25 bps cut is likely 🎯
With US03M hovering roughly a quarter of a percent under the current effective policy rate area shown on the chart, the bond market is effectively voting for at least a 25 bps reduction at the next meaningful decision.
If the Fed cuts by 25 bps, US03M is already priced for that move, so the bigger reaction will come only if the Fed surprises with either a larger cut or no cut at all, giving traders a clear benchmark for risk positioning. Short 
Digital Dominates the Market & Old Methods Fall Behind1. Digital Transformation: Speed, Scalability, and Efficiency
Digital systems offer lightning-fast operations that traditional methods cannot match.
Where old systems depend on manual processes, paperwork, or physical presence, digital models operate instantly across the globe.
Speed
Transactions take seconds, from online banking to e-commerce checkout.
Supply chain decisions update in real time through sensors and AI dashboards.
Digital communication—emails, messaging, cloud collaboration—moves faster than traditional mail, memos, or in-person coordination.
Old methods, built on slower bureaucratic workflows, lose relevance when consumers and businesses expect instant outcomes.
Scalability
Digital platforms scale globally with minimal marginal cost.
A software company can serve millions without building new factories, whereas traditional businesses must invest heavily in infrastructure to grow.
This is why:
Digital streaming beats physical CDs and DVDs.
Online education reaches millions vs. classroom limits.
E-commerce expands without opening new stores.
Traditional models built around physical capacity struggle to expand at the same pace.
2. Data: The New Competitive Advantage
In the digital marketplace, data is the new oil—but more importantly, it becomes actionable instantly through analytics and AI.
How Digital Uses Data
Customer behavior tracking enhances precision marketing.
AI models predict demand, optimize pricing, and improve logistics.
Businesses personalize product recommendations—a feature impossible with old marketing tools.
Traditional methods like:
manual customer surveys,
limited market studies,
guess-based advertising,
cannot provide the accuracy or real-time insights needed for modern competition.
Because digital systems learn and adapt continuously, they grow more efficient over time, while old methods remain static.
3. Digital Consumer Behavior: Convenience Wins
Digital dominates markets because consumers have shifted online. Convenience is king.
What consumers now prefer:
Online shopping with home delivery
Digital payments over cash
OTT streaming over cable TV
Mobile banking over in-branch visits
Ride-hailing apps over traditional taxis
Food delivery apps over calling restaurants
Old methods fail because they require more effort, more time, and often more cost.
The demand for personalization
Algorithms tailor:
ads,
shopping experiences,
search results,
content recommendations.
Traditional one-size-fits-all approaches—newspapers, radio, physical catalogs—cannot match personalized digital experiences.
4. Automation and AI: Replacing Manual Workflows
Automation is a central reason digital dominates.
AI, machine learning, and robotic process automation reduce errors and costs while increasing throughput.
Digital automation examples:
Chatbots replacing customer service centers
AI underwriting replacing manual loan officers
Algorithmic trading outperforming human traders in speed
Robotic assembly lines increasing manufacturing efficiency
Smart warehouses with automated inventory systems
Old methods relying on manual labor or human-only operations lag because they are costly, slow, and prone to inconsistency.
5. Platform Economies Beat Traditional Business Models
Digital platforms like Amazon, Uber, Airbnb, and Google transformed markets by connecting millions of users through online ecosystems.
Advantages of digital platforms:
Zero inventory models (e.g., Uber owns no cars)
Low cost per additional user
Global user networks
Winner-take-all dynamics powered by data
Traditional industries with fixed assets, limited reach, and physical infrastructure cannot compete with the platform model’s efficiency.
6. Marketing: Digital Ads Crush Traditional Advertising
Advertising is one area where the shift is most obvious.
Digital marketing benefits:
performance tracking,
precise targeting,
retargeting,
demographic insights,
cost efficiency.
Platforms like Google Ads, Facebook Ads, and Instagram Reels allow businesses to reach exact audiences.
By contrast:
print ads,
billboards,
radio,
TV commercials
provide no precise data on who viewed or acted on the message.
Thus, traditional marketing budgets shrink every year as businesses migrate to digital channels.
7. Digital Finance & Payments Overtake Cash-Based Systems
FinTech has become one of the biggest disruptors.
Digital finance innovations such as:
UPI
e-wallets
algorithmic credit scoring
digital lending
automated KYC
blockchain transactions
are outcompeting traditional banking models.
Old cash-heavy methods or manual paperwork-based banking slow down transactions, increase risk, and limit accessibility.
Digital finance, being efficient, borderless, and transparent, dominates modern monetary flows.
8. E-Commerce and the Fall of Traditional Retail
E-commerce has redefined how people shop.
Digital advantages:
24/7 availability
more product variety
faster price comparison
personalized recommendations
doorstep delivery
easy returns and refunds
Traditional retail, despite offering physical experience, struggles with:
limited store hours,
higher operational costs,
smaller inventory,
regional restrictions.
Digital-first retailers with online-only models take the lead.
9. Remote Work & Cloud Systems Replace Traditional Office Models
The digital workplace has become dominant.
Digital tools:
Zoom, Google Meet
Slack, Teams
Cloud storage
Virtual project management tools
enable businesses to collaborate without needing physical offices.
Old workplaces requiring physical presence are falling behind due to:
higher real estate costs,
long commutes,
reduced flexibility.
Digital work increases productivity and widens talent pools globally.
10. Innovation Cycles: Digital Evolves Faster
Digital technology evolves at breakneck speed.
Every year brings:
faster processors,
smarter algorithms,
new apps,
improved networks,
enhanced automation.
Traditional industries, requiring physical upgrades, machinery, or labor restructuring, cannot update at the same pace.
Thus, over time, digital companies innovate exponentially while old industries evolve linearly—creating an ever-widening gap.
Conclusion: The Digital Wins Because It Is Faster, Smarter, Cheaper, Global
Digital methods dominate because they:
scale rapidly,
rely on data,
adapt through AI,
offer personalization,
reduce cost,
improve convenience,
operate globally with minimal friction.
Old methods fall behind because they:
depend on slower manual workflows,
require physical presence,
lack real-time data,
cannot personalize experiences,
involve higher costs and limited reach.
In today’s hyperconnected world, digital is not just an alternative—it is the primary driver of global markets. Old methods still exist, often for tradition or regulatory reasons, but their influence continues to shrink. The future belongs to systems that can evolve quickly, use data intelligently, and meet consumers’ expectations for instant, frictionless service. Digital does all this—and more—ensuring it remains the dominant force shaping the global economy. Education 
US 10Y TREASURY a 25bps cut – decision weekSeptember's PCE data came just a bit lower than anticipated. The data showed inflation at 2,8%, while the market was expecting a figure of 2,9%. Easing inflation heated market expectations that the Fed will cut interest rates by 25 basis points at their meeting on Wednesday, December 10th. Odds for a rate cut currently stand at 87%. The 10Y Treasury yields turned to the upside during the previous week, after testing support at 4,0%. The highest weekly level of 4,14% was reached at Friday's trading session.
The week ahead is the FOMC week. Fed Chair Powell is expected to address the public after the FOMC meeting. Markets will be able to hear the latest update on the state of the US economy, as perceived by Fed members. Thai is the time when market volatility significantly increases, as well as volatility in US Treasury yields. In this sense, the level of 4,16% might easily be the next target for 10Y yields. Also, some relaxation toward the 4,06% might also be possible.
Short-Term Rates, DXY, and Long-Term Rates, Weekly Macro Clarity1️⃣ Short-Term Rates (02Y)
“Short-term yields show mild upward pressure today, though momentum remains neutral overall with a flat 20 EMA.”
2️⃣ DXY
“The dollar eased, pulling back from recent highs. Momentum is cooling but still structurally intact.”
3️⃣ Long-Term Rates (10Y)
“Long-term yields show a clearer rebound, with stronger upward candles and improving structure.”
4️⃣ Macro Alignment
“Overall alignment remains mixed: slight upward movement in short-term rates, a decline in the dollar, and a more defined rise in long-term yields.”
5️⃣ What to Monitor
“Heading into the week, I’m watching whether short-term yields remain stable or begin trending, as this often influences broader risk appetite.” Short 
Long 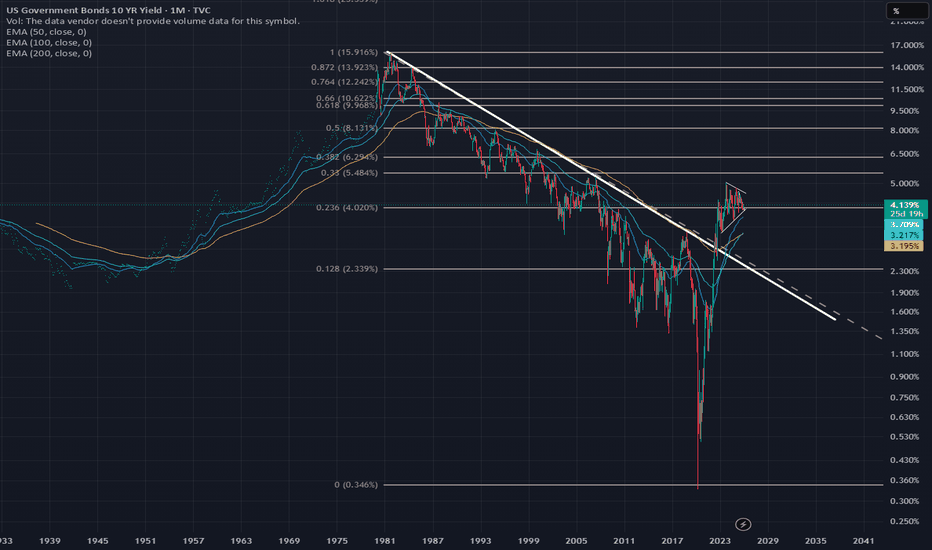
End of the Yen Carry Trade: What Risk for the Stock Market?For more than two decades, the “yen carry trade” has been a discreet yet powerful pillar of global finance. This mechanism relies on borrowing at low cost in yen—thanks to the ultra-low rates set by the Bank of Japan (BoJ)—and investing those funds in higher-yielding foreign assets (equities, bonds, emerging markets, etc.). The logic was appealing: low financing costs + high returns = profit.
But estimating the size of this phenomenon is challenging. The transactions span loans, bonds, derivatives, and diverse institutions, and the data is fragmented. Depending on the source, the active global carry trade could represent a few hundred billion dollars (200–300 billion in a conservative estimate), while broader calculations including debt, funding structures, and derivative exposures point to volumes reaching 500–800 billion dollars, or even more in some assessments.
What makes it worrying is that this cheap-liquidity flow has functioned as a global engine for risk-asset investment, supporting equity markets, debt markets, and emerging economies that depended on capital “imported” through the yen.
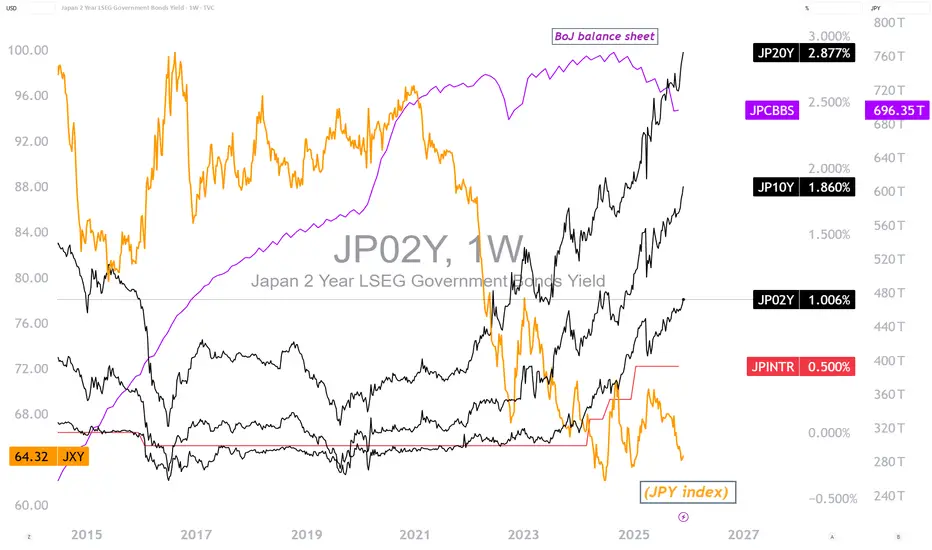
But this engine is fading. The BoJ has begun raising rates, and the yen has strengthened, increasing the cost of yen borrowing and reducing carry-trade margins. In this environment, many investors have already started unwinding their positions, as Japan’s bond yields have been rising sharply since 2024, as shown in the chart below.
A halt or significant slowdown of the carry trade can have several consequences: reduced flows toward risk assets, forced selling, volatility, tightening global liquidity, and higher financing costs for regions or actors dependent on foreign capital. If 300 to 500 billion dollars were to exit, it would represent a substantial withdrawal relative to typical investment flows, potentially triggering notable corrections in risk assets.
However, this scenario does not necessarily imply a “crash.” It is more of a global adjustment: normalization of funding conditions, redefinition of valuations, and possible market stabilization after the purge of the most fragile positions. Moreover, even though Japanese interest rates are rising, they remain significantly lower than U.S. or European rates.
In short: the yen carry trade has acted as a buffer—and even a stimulant—for global markets. Its unwinding signals a transition. It is a structural shift, not a systemic risk, because the amounts remain relatively contained. In any case, the future monetary policy of the Bank of Japan, especially the policy decision expected on Friday, December 19, will influence stock-market risk assets.
DISCLAIMER:
This content is intended for individuals who are familiar with financial markets and instruments and is for information purposes only. The presented idea (including market commentary, market data and observations) is not a work product of any research department of Swissquote or its affiliates. This material is intended to highlight market action and does not constitute investment, legal or tax advice. If you are a retail investor or lack experience in trading complex financial products, it is advisable to seek professional advice from licensed advisor before making any financial decisions.
This content is not intended to manipulate the market or encourage any specific financial behavior.
Swissquote makes no representation or warranty as to the quality, completeness, accuracy, comprehensiveness or non-infringement of such content. The views expressed are those of the consultant and are provided for educational purposes only. Any information provided relating to a product or market should not be construed as recommending an investment strategy or transaction. Past performance is not a guarantee of future results.
Swissquote and its employees and representatives shall in no event be held liable for any damages or losses arising directly or indirectly from decisions made on the basis of this content.
The use of any third-party brands or trademarks is for information only and does not imply endorsement by Swissquote, or that the trademark owner has authorised Swissquote to promote its products or services.
Swissquote is the marketing brand for the activities of Swissquote Bank Ltd (Switzerland) regulated by FINMA, Swissquote Capital Markets Limited regulated by CySEC (Cyprus), Swissquote Bank Europe SA (Luxembourg) regulated by the CSSF, Swissquote Ltd (UK) regulated by the FCA, Swissquote Financial Services (Malta) Ltd regulated by the Malta Financial Services Authority, Swissquote MEA Ltd. (UAE) regulated by the Dubai Financial Services Authority, Swissquote Pte Ltd (Singapore) regulated by the Monetary Authority of Singapore, Swissquote Asia Limited (Hong Kong) licensed by the Hong Kong Securities and Futures Commission (SFC) and Swissquote South Africa (Pty) Ltd supervised by the FSCA.
Products and services of Swissquote are only intended for those permitted to receive them under local law.
All investments carry a degree of risk. The risk of loss in trading or holding financial instruments can be substantial. The value of financial instruments, including but not limited to stocks, bonds, cryptocurrencies, and other assets, can fluctuate both upwards and downwards. There is a significant risk of financial loss when buying, selling, holding, staking, or investing in these instruments. SQBE makes no recommendations regarding any specific investment, transaction, or the use of any particular investment strategy.
CFDs are complex instruments and come with a high risk of losing money rapidly due to leverage. The vast majority of retail client accounts suffer capital losses when trading in CFDs. You should consider whether you understand how CFDs work and whether you can afford to take the high risk of losing your money.
Digital Assets are unregulated in most countries and consumer protection rules may not apply. As highly volatile speculative investments, Digital Assets are not suitable for investors without a high-risk tolerance. Make sure you understand each Digital Asset before you trade.
Cryptocurrencies are not considered legal tender in some jurisdictions and are subject to regulatory uncertainties.
The use of Internet-based systems can involve high risks, including, but not limited to, fraud, cyber-attacks, network and communication failures, as well as identity theft and phishing attacks related to crypto-assets.
Education 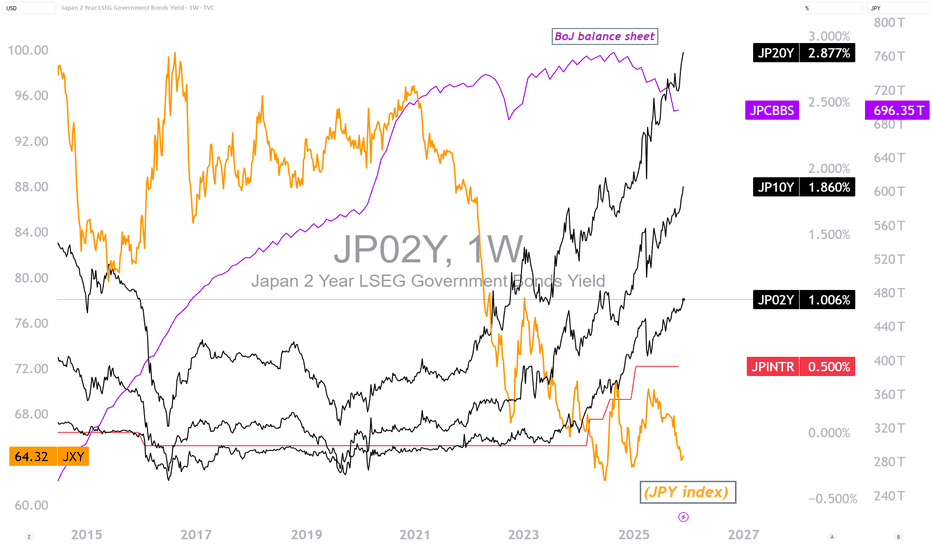
US 10Y TREASURY: aligning to a Feds cutWeaker inflation and economic output data increased investors sentiment of a potential Fed rate cut at December's FOMC meeting. The 10Y US Treasury benchmark yields reacted to these expectations, pushing yields further to the lower side. The 10Y yields started the week around 4,04%, but reached the lowest weekly level at Friday's trading session, at 3,96%. Still, they closed the week at 4,01%.
Although yields are holding around the 4%, still next Friday might bring some higher volatility, as September PCE data are set for a release. This indicator represents Fed's favourite inflation gauge, in which sense, the market might increase its nervousness, in case that posted figures are not in favour of Fed's 25 basis point cut. On the other hand, yields might continue to be in a “silent” mode, around 4%, prior to the FOMC meeting, scheduled in two weeks from now.