 Short
Short
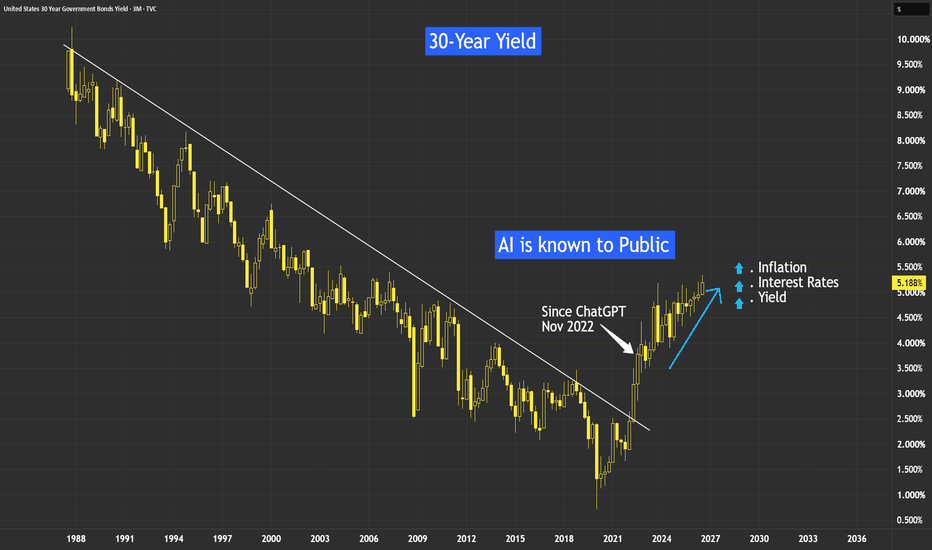
Is AI Making Inflation Better or Worse?AI was first made known to me with the launch of ChatGPT in November 2022. Here, we can see that yields, inflation, and interest rates also started to pick up during the same year.
We often hear that AI will improve productivity, reduce costs, and ultimately help bring inflation down.
But what if, before AI makes things cheaper, it actually makes inflation worse? And how we can manage into this scenario?
10-Year Yield Futures
Ticker: 10Y
Minimum fluctuation:
0.001 Index points (1/10th basis point per annum) = $1.00
Disclaimer:
• What presented here is not a recommendation, please consult your licensed broker.
• Our mission is to create lateral thinking skills for every investor and trader, knowing when to take a calculated risk with market uncertainty and a bolder risk when opportunity arises.
CME Real-time Market Data help identify trading set-ups in real-time and express my market views. If you have futures in your trading portfolio, you can check out on CME Group data plans available that suit your trading needs www.tradingview.com
Long
Yield Ceiling and the Rates Trap: Will Stocks Truly Benefit?Instead of big institutions and foreign holders dumping their long term Treasury bonds onto the open market and spiking yields through the roof, they can now use collateral loan programs.
By borrowing cash against their bonds instead of selling them, the market avoids forced fire sales. That removes the massive supply shock and helps explain why the 10 Year yield is hitting a brick wall.
We called earlier that the Fed would not be raising rates, and the market structure is validating that more every day.
Here is what the charts are telling us on rates.
US 10 Year
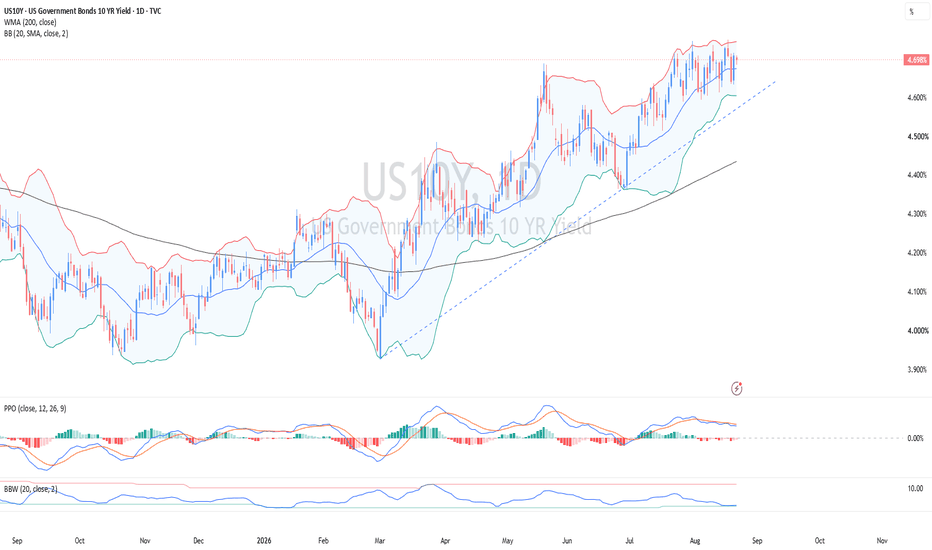
That 4.75 percent level is acting as a concrete ceiling. The daily RSI shows clear momentum exhaustion making lower highs while yields pushed sideways to slightly up. On top of that, the momentum squeeze bars have completely flattened to baseline dots. The push higher ran out of gas. TVC:TNX
US 2 Year
The 2 Year broke its major downtrend from late 2023. However, it has formed a clean lower high recently. Front end yields are rolling into a steady downtrend, OPINION, as rate cut expectations solidify. A drop down to test the 4.06 percent zone looks like the next logical move.
The Big Question: Will stocks rise on falling yields?
Not automatically.
There are two kinds of yield drops. If yields drop because inflation is beaten and the financial system is calm, stocks celebrate. But if yields roll over because economic growth is cooling off rapidly, lower yields will not save stock earnings multiples right away.
Cyclical businesses notice slowdowns first. If yields fall while the economy cools and the Dollar Index catches a short squeeze bounce off its lows, stock dips will struggle to find aggressive buyers immediately. Yield relief is coming, but the economic backdrop will dictate whether it is a launchpad or a trap for equities.
TGtg! Why the Treasury's Bond Buyback Failed to Calm Bond MarketsOn August 19, 2026, the US Treasury made a surprising announcement: it would more than double its bond-buying operations to between 2 and 4 billion dollars each, with a focus on long-dated debt. Interest rates fell sharply in response to the news, with the 10-year Treasury down over 5 basis points and the 30-year down 9 basis points, while stock futures jumped.
However, by the next day, most of the gains had been erased, with the 30-year yield climbing back towards its 19-year peak. This article will discuss what happened, why the market reacted so positively to the news at first, and what this episode says about the effectiveness of government interventions in a market as large and complicated as that of the bonds.
What the Treasury actually did
The US government routinely issues new debt to finance its operations, but it also conducts occasional buybacks of its own bonds, which are designed to provide liquidity to the bond market and allow the Treasury to intervene in specific points of the yield curve.
The Treasury announced on August 19 that it would be increasing the scale of its buybacks for bonds between 10-20 and 20-30 years, starting on September 9 and ending on November 4. This announcement came at a time when the national debt of the US was approaching 40 trillion dollars for the first time, and the 30-year yield was at 5.323%, its highest level since 2007.
Why the market reacted positively to the news
The market’s positive reaction to the news was entirely rational, as the intervention the Treasury was planning to make was undeniably helpful. An increase in demand for bonds, even if it is not directly stated as such, will always have a positive effect on their prices and hence lower their yields, at least in the short term. This is precisely what happened on Wednesday, when both the 10- and 30-year yields fell by several basis points within hours of the announcement.
Why the market erased most of the gains
However, by Thursday, most of these gains had been erased, with the 30-year yield climbing back to near its 19-year peak. By Friday, the yield on the 10-year Treasury was nearly back to where it was before the announcement was made, having regained more than 5 basis points. Analysts have several reasons for believing that the positive reaction to the news was not justified.
First of all, they pointed out that the changes announced by the Treasury were not large enough to have a significant impact on the bond market. An increase in the scale of buybacks from 2 billion to 4 billion dollars, while significant, was not nearly as large as the 32 trillion dollars in bonds issued by the Treasury. According to one analyst from Jefferies, the intervention was too small to have a meaningful impact on the supply-demand dynamics of the bonds.
Furthermore, analysts pointed out that the buybacks essentially only address the symptoms of the yield increase, not the causes. Several strategists mentioned that the rising yields were the result of concerns about the size of the deficit and hence should have been addressed directly. Another analyst from JPMorgan noted that the market’s reaction to the news might have been counterproductive in the long run.
He stated that the market’s positive reaction to the news might have undermined the credibility of the Treasury’s commitment to a “steady and consistent” approach to managing the debt, as an unpredictable intervention of this sort creates a “higher risk premium” for bonds, which defeats the original purpose.
Another analyst noted that the buybacks can be seen as an informal attempt to intervene in the yield curve and limit its growth, which means that their effects should be interpreted with this in mind. The market takes such signals from the government seriously, and hence the yields did not fail to react to the news, despite the initial drop on Wednesday.
What lies ahead for bond yields
The increase in bond yields that started back in June was caused by several different factors, most of which are still present and contribute to the rise in yields. These include the concerns about the size of the deficit, the increase in the term premium, the shift in the composition of buyers of the bonds, and the increased issuance of corporate bonds backed by AI infrastructure.
Higher yields for longer-dated bonds are also felt outside the government debt, as the 30-year mortgage rates climbed to 6.75% around this time, which is a direct result of the same forces pushing the Treasury yields higher.
What to watch for
The most important development to watch for in the near future is the comments made by the Fed’s chairman, Kevin Warsh, at the Jackson Hole Economic Symposium, as the market is waiting for any signals about the intentions of the central bank to intervene. Several analysts believe that the recent jump in yields has essentially been a test of the resolve of the Fed, and hence its reaction will shape the future movements of the yields.
It will also be important to watch for any changes the Treasury makes to its bond-buying operations, as such a significant reaction to a relatively small intervention suggests that the government is concerned about the size of the yield increases. If the Treasury continues to make similar announcements in the future, it will show that the interventions announced so far were not nearly enough to stabilize the market.
The level of the 30-year yield relative to its 19-year peak is also a helpful indicator to watch, as the market’s attempts to push the yields higher suggest that the forces driving them upwards are still present.
My final thoughts
For one day, it seemed as if the concerns about rising yields had been calmed and the market had reacted positively to the news. However, by the end of the week, the market made it clear that, for the time being, the long-term yields were on a path towards higher levels.
While the announcement made by the Treasury was helpful, it failed to address the larger concerns about the size of the deficit and the risks posed by the growing national debt. The market made it clear that an increase in the scale of buybacks from 2 billion to 4 billion dollars was not enough to stabilize the bond market and hence stop the rise in yields.
Thank You
@VertexQore Education 
Education
The U.S. Treasury Has Stepped In!🇺🇸 Treasury Buybacks: Why Is the U.S. Treasury Intervening in the Long End of the Yield Curve?
The U.S. Treasury has just announced a significant expansion of its buyback operations in the long end of the Treasury curve.
Starting September 9, 2026, the maximum size of certain buyback operations covering:
10–20Y
and
20–30Y
Treasuries will increase from:
$2B → at least $4B per operation
The expanded program will run through November 4, when the next Quarterly Refunding announcement is scheduled. Treasury has indicated that additional details on the future size and structure of buybacks will be provided at that meeting.
At first glance, this may look like a technical adjustment to Treasury debt management.
It isn't.
The real question is:
Why is the Treasury increasing its support for the long end of the curve now — and what does that mean for bonds, yields, the dollar, gold, equities and crypto?
Let's break down the mechanics.
━━━━━━━━━━━━━━━━━━
1️⃣ First: What Exactly Is a Treasury Buyback?
To understand this move, we need to understand what Treasury buybacks actually do.
The U.S. Treasury has more than $30 trillion of outstanding Treasury securities issued across different maturities and issuance dates.
Not all of these securities have the same level of liquidity.
Newer benchmark securities — known as on-the-run Treasuries — tend to have deeper liquidity.
Older securities, or off-the-run Treasuries, can trade with wider bid/ask spreads and lower market depth, particularly during periods of market stress.
Treasury buybacks allow the government to purchase some of these outstanding securities back from investors.
The objective is primarily:
Debt Management + Market Liquidity
The intention is to:
improve market liquidity
support trading conditions
reduce fragmentation across outstanding issues
improve the functioning of the Treasury market
provide another tool for managing the existing debt stock
And this distinction is critical:
Treasury buybacks are NOT the same thing as Federal Reserve QE.
QE is a monetary-policy tool conducted by the central bank.
Treasury buybacks are primarily a debt-management and market-functioning tool.
Calling this “QE” would therefore be a major oversimplification.
━━━━━━━━━━━━━━━━━━
2️⃣ So Why Does This Matter Now?
Because the timing matters.
The announcement comes after a sharp increase in long-term Treasury yields.
On August 18, the U.S. 30-year Treasury yield reached roughly:
5.34%
— its highest level since 2007.
The 10-year yield was also trading at elevated levels.
Following the buyback announcement, the long end of the curve rallied sharply:
Bond Prices ↑
Yields ↓
The 30-year yield fell by roughly 10 basis points at one point, while the 10-year yield also moved lower.
That reaction tells us something important.
The market did not treat the announcement as merely an administrative change.
It interpreted it as a:
Liquidity-support signal.
━━━━━━━━━━━━━━━━━━
3️⃣ But What Is the Real Problem in the Treasury Market?
This is where we need to move beyond the headline.
Long-term Treasury yields are not determined solely by expectations for the Federal Reserve's policy rate.
A simplified framework is:
Long-Term Yield ≈
Expected Future Short-Term Rates
Inflation Expectations
Term Premium
plus other factors such as:
Fiscal Risk
Treasury Supply
Demand for Duration
Global Capital Flows
Liquidity Conditions
This means something extremely important:
The Fed can cut short-term rates while the 30-year yield continues to rise.
Why?
Because investors may demand a higher return for holding 20- or 30-year U.S. government debt.
That additional compensation is closely related to the concept of:
Term Premium
And this is one of the key variables behind the current story.
━━━━━━━━━━━━━━━━━━
4️⃣ Why Is the Long End So Important?
The short end of the curve is heavily influenced by expectations for Fed policy.
For example:
2Y Yield
is highly sensitive to expectations for the future path of the Fed Funds Rate.
But as we move further out:
10Y → 20Y → 30Y
other forces become increasingly important.
Investors start asking:
How much U.S. debt will need to be absorbed by the market over the coming years?
How much inflation risk should be priced into a 20- or 30-year security?
How much compensation should investors demand for holding long-duration U.S. debt?
This is where:
Fiscal Deficits
Debt Supply
Inflation Risk
Term Premium
and
Investor Demand
become increasingly important.
━━━━━━━━━━━━━━━━━━
5️⃣ Why Is Treasury Targeting the 10–20Y and 20–30Y Segments?
This is not random.
Treasury had already increased the frequency of buyback operations in these maturity buckets.
Previously, the Treasury had increased operations in these sectors from two to four operations per quarter, while the maximum size remained $2 billion per operation.
The latest move effectively increases the size of those operations as well.
So the Treasury is increasing:
Frequency + Capacity
in the long end.
From a market-structure perspective, that matters.
It means Treasury is willing to absorb more securities from the long end when market participants offer them.
━━━━━━━━━━━━━━━━━━
6️⃣ Does This Mean Treasury Wants to Push Yields Lower?
Not officially.
And this distinction matters.
Treasury's stated objective is:
Supporting Liquidity and Market Functioning
—not targeting a specific yield level.
Treasury is not saying:
“We want the 30Y yield at 5%.”
Instead, it is saying:
“We want the Treasury market to function efficiently and remain liquid.”
However, there is an obvious mechanical channel.
If a large buyer enters the market:
Demand for Bonds ↑
↓
Bond Prices ↑
↓
Yields ↓
So buybacks can temporarily reduce pressure on yields.
But that does not mean Treasury is explicitly targeting the yield curve.
━━━━━━━━━━━━━━━━━━
7️⃣ The Critical Point: $4B Is Small Relative to the Treasury Market
The U.S. Treasury market is roughly $32 trillion in size.
Against that market, a $4 billion operation is tiny.
Therefore, it would be a mistake to argue:
“Treasury is buying $4 billion, so the debt problem is solved.”
Obviously not.
The direct balance-sheet impact is limited.
But the flow and signaling effects can be much more important than the absolute size.
The market is not only reacting to:
“How much is Treasury buying?”
It is reacting to:
“What does Treasury's willingness to increase buybacks tell us about market conditions?”
That distinction is crucial.
━━━━━━━━━━━━━━━━━━
8️⃣ What Is Treasury Actually Signaling?
Treasury has emphasized that it continues to receive substantial amounts of high-quality offers in its long-end buyback operations.
That suggests there is significant investor/dealer willingness to sell certain long-duration securities back to Treasury.
Treasury is now increasing its capacity to absorb that supply.
From a market-structure perspective, the message is:
“We want the long end to remain liquid and orderly.”
This does not necessarily mean there is a crisis.
But it does indicate that Treasury considers liquidity conditions in the long end important enough to justify a larger intervention.
━━━━━━━━━━━━━━━━━━
9️⃣ Is This Bullish or Bearish?
The answer depends entirely on:
WHY yields are moving.
This is perhaps the most important lesson from the entire event.
Suppose:
30Y Yield ↓
Is that automatically bullish for Nasdaq, Gold and Bitcoin?
No.
We need to know why yields are falling.
There are at least three major scenarios.
━━━━━━━━━━━━━━━━━━
🔵 Scenario 1: Liquidity Relief
In the first scenario:
Treasury Buybacks ↑
↓
Bond Demand ↑
↓
Bond Prices ↑
↓
30Y Yield ↓
↓
Financial Conditions Ease
If, at the same time:
Real Yields ↓
and
DXY ↓
then the environment can become more supportive for:
🟡 Gold
📈 Nasdaq
📈 S&P 500
₿ Bitcoin
This is the classic liquidity-relief scenario.
But there is one major condition:
The decline in yields must not be driven by recession fears.
━━━━━━━━━━━━━━━━━━
🟡 Scenario 2: Yields Fall Because Growth Expectations Collapse
This is completely different.
Imagine:
Growth Expectations ↓
↓
Recession Risk ↑
↓
Treasury Demand ↑
↓
Yields ↓
In that environment, we could see:
Yields ↓
while:
Equities ↓
at the same time.
Therefore:
Falling Treasury yields are NOT automatically bullish for risk assets.
We need to distinguish between:
“Yields falling because liquidity is improving”
and
“Yields falling because investors are seeking safety.”
Those are completely different macro regimes.
━━━━━━━━━━━━━━━━━━
🔴 Scenario 3: Buybacks Increase — But 30Y Yield Rises Again
This is perhaps the most interesting scenario for a macro trader.
Imagine:
Treasury Buyback Capacity ↑
but:
30Y Yield ↑
again.
That would tell us something extremely important:
The problem is probably larger than liquidity.
If Treasury increases its buying capacity and the long end still sells off, the market may be demanding higher compensation because of:
Fiscal Risk
Inflation Expectations
Term Premium
Treasury Supply
or
Insufficient Demand for Duration
In that case, the buyback program may provide temporary relief, but it would not solve the underlying problem.
━━━━━━━━━━━━━━━━━━
1️⃣0️⃣ This Is Where Term Premium Becomes Critical
One of the most important concepts to monitor is:
Term Premium
In simple terms, term premium is the additional compensation investors demand for holding longer-duration bonds instead of rolling shorter-term securities.
If:
Term Premium ↑
then long-term yields can rise even if expectations for Fed policy do not change dramatically.
This creates an important distinction.
A rise in the 30Y yield can come from:
Higher expected policy rates
or:
Higher term premium
or:
Higher inflation expectations
or some combination of all three.
The implications for other asset classes are very different.
━━━━━━━━━━━━━━━━━━
1️⃣1️⃣ This Is Why the Yield Curve Matters More Than a Single Yield
Don't just watch the 10Y.
Watch:
2Y
5Y
10Y
30Y
and especially:
2s10s
10s30s
For example:
If:
2Y ≈ unchanged
while:
30Y ↓↓↓
then a large portion of the move is coming from the long end.
But if:
2Y ↓
10Y ↓
30Y ↓
together, the market may be repricing the entire expected path of monetary policy.
Therefore:
The absolute level of yield matters. The shape of the curve tells you why it matters.
━━━━━━━━━━━━━━━━━━
1️⃣2️⃣ What Does This Mean for the Dollar?
The dollar also weakened following the announcement, at one point reaching a three-month low against the euro.
But again, we should avoid a simplistic equation:
Yield ↓ → Dollar ↓
That relationship is not always stable.
If yields fall because:
Fed Expectations Become More Dovish
the dollar can weaken.
But if yields fall because:
Recession Risk Rises
the dollar can behave very differently because safe-haven demand may increase.
Therefore, the correct framework is:
Yield + Growth Expectations + DXY
—not Yield alone.
━━━━━━━━━━━━━━━━━━
1️⃣3️⃣ Why Does This Matter for Gold?
Gold has no coupon.
Therefore, one of the most important opportunity costs for holding gold is:
Real Yield
When:
Real Yield ↓
the opportunity cost of holding non-yielding gold falls.
If at the same time:
DXY ↓
the environment becomes even more supportive for gold.
This is why gold reacted positively following the Treasury announcement.
But again:
We do not trade Gold because Treasury announced a buyback.
We trade the transmission mechanism:
Treasury
↓
Nominal Yield
↓
Real Yield
↓
DXY
↓
Gold
━━━━━━━━━━━━━━━━━━
1️⃣4️⃣ Why Does Nasdaq Care?
Nasdaq is highly sensitive to changes in discount rates because many growth companies derive a large portion of their valuation from cash flows expected far into the future.
Simplified:
Yield ↑
↓
Discount Rate ↑
↓
Present Value of Future Cash Flows ↓
↓
Pressure on Long-Duration Equity Valuations
And the reverse is also true.
Therefore, a sustained decline in long-term yields can be supportive for growth stocks.
But again:
Only if the decline in yields reflects easier financial conditions rather than deteriorating growth expectations.
━━━━━━━━━━━━━━━━━━
1️⃣5️⃣ Where Does Bitcoin Fit Into This?
Bitcoin does not have a direct mechanical relationship with Treasury buybacks.
Its sensitivity comes primarily through:
Real Rates
Dollar Liquidity
Financial Conditions
and
Risk Appetite
Therefore, if the buyback contributes to:
Real Yield ↓
DXY ↓
Financial Conditions Easing
the macro environment can become more supportive for Bitcoin.
But if yields are falling because markets are pricing a sharp economic slowdown, the result can be completely different.
━━━━━━━━━━━━━━━━━━
1️⃣6️⃣ Treasury Is Not Replacing the Fed
Another common mistake is to describe this as:
“Treasury is doing the Fed's job.”
That is too simplistic.
The:
Federal Reserve
controls monetary policy.
The:
U.S. Treasury
manages government debt issuance and market functioning.
Their actions can interact and influence financial conditions, but they are not the same policy tool.
This distinction becomes especially important because larger Treasury buybacks could potentially complicate the Fed's interpretation of financial conditions.
But again:
Treasury Buyback ≠ QE.
━━━━━━━━━━━━━━━━━━
1️⃣7️⃣ Why November 4 Matters
September 9 is when the larger operations begin.
But:
November 4
may be even more important.
That is when Treasury is scheduled to provide additional information at the next Quarterly Refunding.
The market will want to know:
Is $4B merely a temporary increase?
or:
Is Treasury establishing a permanently larger buyback capacity for the long end?
If the latter happens, the market could interpret it as a more structural change in Treasury's approach to debt-market liquidity management.
━━━━━━━━━━━━━━━━━━
1️⃣8️⃣ But the Fundamental Problem Is Still There
Even if the buybacks work perfectly, they cannot eliminate:
the fiscal deficit
the outstanding debt burden
Treasury issuance needs
inflation risk
term premium
the need for continuous market absorption of U.S. government debt
In other words:
Buybacks can improve market functioning.
They cannot solve the underlying fiscal arithmetic.
That is why I would view the program primarily as:
Liquidity Management
rather than:
A Structural Solution to the Treasury Market's Long-Term Problems
━━━━━━━━━━━━━━━━━━
1️⃣9️⃣ The Macro Trader's Decision Tree
This is how I would monitor the story from September onward.
STEP 1 — Watch US30Y
Does the 30Y yield actually establish a sustained decline?
↓
STEP 2 — Watch US10Y / US30Y
Does the long end outperform the rest of the curve?
↓
STEP 3 — Watch Real Yields
Is the decline in nominal yields confirmed by real yields?
↓
STEP 4 — Watch DXY
Is the dollar weakening at the same time?
↓
STEP 5 — Watch Credit
Are credit spreads confirming easier financial conditions?
↓
STEP 6 — Watch Risk Assets
Then evaluate:
Gold
Nasdaq
S&P 500
Bitcoin
This sequence is much more useful than simply trading the headline.
━━━━━━━━━━━━━━━━━━
2️⃣0️⃣ The Most Important Setup
Personally, I would not make the Treasury announcement itself the trade.
I would watch the market's response to the intervention.
Treasury has effectively increased the size of its potential demand.
Now the market has to answer:
Can that additional demand actually change the price of long-duration Treasury debt?
If:
Buyback Capacity ↑
and
30Y Yield ↓
persistently,
the market is accepting the liquidity support.
But if:
Buyback Capacity ↑
and
30Y Yield ↑
again,
then the market is telling us:
Fundamental pressure is stronger than the liquidity intervention.
That signal could be far more important than the initial buyback announcement itself.
━━━━━━━━━━━━━━━━━━
2️⃣1️⃣ What Actually Happened on August 19–20?
The initial market sequence was roughly:
30Y Yield → ~5.34%
↓
Treasury announces larger long-end buybacks
↓
Bond Demand ↑
↓
30Y Yield ↓
↓
10Y Yield ↓
↓
USD ↓
↓
Gold ↑
↓
Risk Assets ↑
The initial reaction was clear.
But the crucial question is whether this becomes:
a short-term relief rally
or:
a structural repricing of the long end.
Those are two completely different things.
A one-day move is not a regime change.
━━━━━━━━━━━━━━━━━━
🎯 Final Takeaway
The wrong way to interpret this story is:
Treasury buys bonds → yields fall → gold and Bitcoin rise.
The professional framework is:
Treasury Buyback
↓
Liquidity / Market Function
↓
10Y & 30Y
↓
Yield Curve
↓
Term Premium / Real Yield
↓
DXY
↓
Financial Conditions
↓
Cross-Asset Repricing
And that leaves us with the most important question:
Has Treasury simply removed some short-term pressure from the long end — or can it actually change the market's willingness to hold long-duration U.S. debt at lower yields?
We won't get the answer from the $4B headline.
We will get it from:
US30Y
US10Y
10s30s
Real Yields
and
DXY
If the long end remains structurally supported, real yields fall and the dollar weakens, the implications can extend well beyond Treasuries into:
Gold → Equities → Crypto
But if 30Y yields reclaim their highs despite larger buybacks, the market may be telling us something much more important:
Liquidity is not the core problem.
And that would put the focus straight back on:
Fiscal Supply + Term Premium + Inflation Risk + Demand for Duration.
📌 Key Dates
August 19–20, 2026
Treasury announces larger long-end buybacks and markets react.
September 9, 2026
New buyback size becomes effective.
November 4, 2026
Next Quarterly Refunding — potentially important for the future path of Treasury buybacks.
⚠️ Final Note
This is not a buy/sell recommendation.
For a macro trader, the announcement itself is only the catalyst.
The actual signal comes from:
Price Action + Yield Curve + Real Rates + Cross-Asset Confirmation.
So from September 9 onward, don't just ask:
“How much is Treasury buying?”
Ask the more important question:
“After Treasury steps in, what yield is the market still demanding to own long-duration U.S. debt?”
That answer may tell us much more about the next major move across global markets. Education 
Yields rebound - bad news for gold?Long-dated Treasury yields are moving higher again, potentially bad news for the likes of gold and Bitcoin, the major beneficiaries of yesterday's Treasury Department’s decision to significantly increase its purchases of longer-dated government debt.
Looking at the chart, it looks like a classic case of resistance turning into support with the highs of October 2023 (5.178%) and that of May 2026 (5.200%) holding as support.
Treasury yields have risen sharply since June, reaching levels not seen since before the global financial crisis. The latest move comes as total US government debt has surpassed $40tn, more than double its level a decade ago.
The unscheduled announcement yesterday was a clear indication of the Treasury’s discomfort with the recent sell-off at the long end of the market.
Ultimately, a more structural solution — particularly fiscal consolidation — would be needed to deliver a sustainable improvement in the bond market. But the message that the Treasury is prepared to be more active in managing conditions at the long end has nevertheless been welcomed by investors.
Yesterday saw risk assets rally sharply, as lower yields improved the appeal of higher-risk assets such as Bitcoin, while also supporting non-yielding assets such as gold. Equities benefited midlly too, helping to keep the AI trade alive for a little longer and providing some support to US indices.
The key risk, however, remains oil, with prices surging higher again today, putting everything at risk of giving back their gains.
Hotel California Treasury TrapFrancis Hunt has used the "Hotel California" analogy ("you can check out anytime you like, but you can never leave") to illustrate how major holders of debt are effectively trapped and blocked from outright selling when they need liquidity. Love it!
Three examples:
Japan (Current Example)
Situation: Japan sought to liquidate roughly $58B to defend the plunging yen.
Trap: Selling caused 10yr and 30yr yields to spike, triggering panic. The U.S. intervened with currency operations and facilities, effectively saying "don't sell that, borrow against it". Essentially converting a massive creditor into a dependent borrower via a "soft lockout."
California Teachers' Retirement System
Situation: Approved an emergency policy permitting the fund to borrow over $30B in debt and leverage for cash flow and liquidity management.
Trap: Why borrow when you hold hundreds of billions in assets? Because in a fragile bond market, liquidating large blocks of fixed income to meet cash obligations risks triggering major capital losses and cratering secondary market bids.
Gulf States
Situation: Facing sudden revenue drops (bombed oil infrastructure, halt in desert tourism), Gulf nations wanted to liquidate U.S. Treasuries for cash.
Trap: The Federal Reserve stepped in with dollar swap lines to give them liquidity rather than allowing them to dump Treasuries into the secondary market.
DANGER:
Cayman Islands: Ghost Bid Propping Up Treasuries
Before looking at the liquidity traps, look at what is actually holding up the building.
The Cayman Islands has a nominal GDP of roughly $7B, yet it holds over $450B in official U.S. Treasuries, with total hedge fund Treasury exposure domiciled there exceeding $1.8T!
This is not organic sovereign demand; it is the Treasury cash futures basis trade:
Mechanism: Multi strategy hedge funds use offshore entities to borrow cheap short term cash (via repo markets and zero rate Yen carry trades).
The Trade: They buy cash Treasuries and short Treasury futures, leveraging tiny yield spreads up to 20x to 50x to juice returns.
Vulnerability: When repo rates spike or carry trades unwind, the trade implodes into forced selling, exposing that the marginal buyer of U.S. debt is not foreign governments, but opaque, levered offshore balance sheets. us10y elliott wave theory analysisthe us10y wave count :
from march 2020 through october 2023, the us10y came up in what looks like a pretty picture perfect 5 wave move. since that peak, it hasn't been able to make a new high and has instead spent the last few years putting in a series of lower highs.
---
paired with the wyckoff distribution theory from my last post(attached at the bottom of this post), i'm assuming the us10y has already found its major peak and has been distributing since late 2023, basically getting ready for a much larger markdown.
---
if my wave count is correct, the move down should unfold in 3 waves. the first decline from the 2023 high would be wave a, this rally back toward the highs would be wave b, and once wave b is finished, we should eventually begin the larger wave c lower.
---
i think that decline could stretch into the early 2030s. my more conservative target is around 2.5% , but i wouldn't rule out something closer to 1% if wave c really extends.
---
the interesting part is that this entire decline would still be corrective by design. so even if yields come down massively from here, the larger trend would still suggest that the us10y eventually goes much higher again afterward.
we'll touch on that part at a later date.
🌙
Short 
us10y drops down to 1%
the TVC:US10Y distribution is getting interesting
the us10y has basically spent the last few years building out what looks like a pretty massive wyckoff distribution. to me, it looks closest to distribution schematic #2 , just with a slight modification in phase b. after the buying climax around 5%, yields got smacked down into the automatic reaction, bounced around the range for awhile, then tried to push back toward the highs. but it never actually got there. instead of giving us a clean upthrust above the bc, the phase b rally failed underneath it. and that's important. the market couldn't even sweep the previous high before rolling back over. that's weakness.
---
since then, the structure has continued to make sense. we got the phase b sow, then this long grind back toward the upper part of the range, with lower highs forming along the way. now we're sitting near what could potentially become the lpsy, last point of supply . if that's what this is, then we're probably getting pretty close to the end of the distribution. the big area i'm watching is around 3.78% to 3.60% . if yields eventually break through that support and can't reclaim it, that's where this starts looking less like a range and more like the beginning of an actual markdown, phase d into phase e.
---
the macro side of this is where things get really interesting, because this isn't your normal slowdown setup. the economy isn't falling apart. if anything, it's doing the opposite. the labor market remains incredibly strong, pmi has started picking back up, and we're entering a completely new productivity environment with ai increasingly being put into the hands of the people running the largest companies in the world. businesses are becoming more efficient, productivity has the potential to explode, and economic activity can continue accelerating. yet, at the same time, inflation has been cooling from its extremes. that's a pretty unique combination. the economy can rip while inflation cools.
---
if that continues, the fed could find itself in a situation where it no longer needs extremely restrictive monetary conditions, not because something broke, but because inflation is coming under control without requiring the economy to be crushed. that's the part i find fascinating. we could potentially get meaningful monetary easing alongside an economy that's actually accelerating, and the bond market might already be sniffing that out. the 10 year is constantly trying to price what comes next, not just what's happening today. so if this distribution really is completing, we could be looking at the beginning of a much larger move lower in long term yields without needing some massive recession or economic collapse to get us there.
---
quick glossary for anyone looking at the chart:
psy, preliminary supply is the first area where bigger sellers start showing up after a strong move higher. basically, the first hint that the trend might be getting tired.
bc, buying climax is the point where buying gets extreme. everyone wants in, demand is huge, and larger players finally have enough liquidity to unload into it. this usually helps establish the top of the range.
ar, automatic reaction happens once that huge wave of buying dries up and price drops hard. this helps establish the bottom of the range.
st, secondary test is when price comes back toward the highs to see if demand is still there. if the market is actually distributing, those pushes usually start looking weaker over time.
sow, sign of weakness is a move back toward the bottom of the range that shows supply is starting to take control. basically, the character of the market starts changing.
failed ut attempt is the slight modification i'm referring to in this structure. normally, distribution #2 can produce an upthrust above resistance, but ours never even made it above the buying climax. it failed underneath it, which to me is a pretty meaningful sign of weakness.
lpsy, last point of supply is one of the final rallies before markdown. price tries to push higher again, but demand just isn't strong enough anymore.
---
nothing is confirmed yet. phase d and phase e are still projections. but if this current rally really is the lpsy, and the us10y eventually loses that lower support zone, this could turn into one hell of a move. and the really interesting part is that we may not need an economic disaster to make it happen. this time around, we could see yields collapse while the economy continues to accelerate. a very different kind of cycle.
---
ps. i will share my wave count on the us10y in my next post.
Short 
 Short
Short
 Short
Short
 Short
Short


