Technical Analysis: If Charts Could Predict the Future. We’d AllTechnical Analysis Predicts the Past. And It Does It Brilliantly.
Some people visit a fortune teller to discover their future. Others open a chart, draw three lines, and wait for the RSI to arrange a meeting with financial freedom.
The difference? On a chart, you get to choose the colour of your predictions.
Welcome to the wonderful world where a red candle becomes a message, two wicks become a battle, and three peaks become a reason to stare nervously at your portfolio.
The Market Didn’t Ge
Government bonds
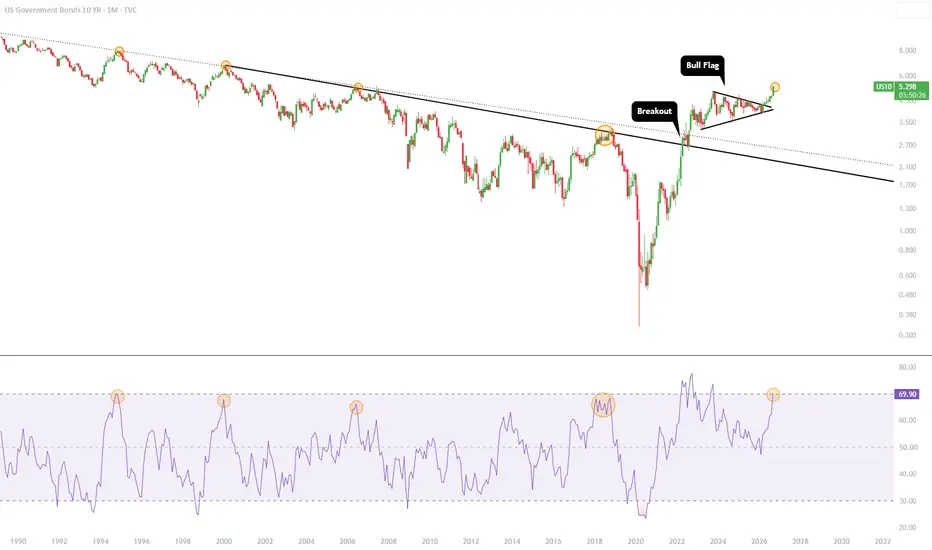
US BOND YIELDS NEARING 24 YRS PRICE (2002)Bond prices and yields move in opposite directions. Rising yields mean bond prices are falling.
Fed Policy: Expectation of higher interest rates ("higher for longer").
Inflation: High inflation erodes fixed coupon payments, driving yield demands up.
Government Debt: Massive issuance of U.S. Treasuries increases supply, forcing bond prices down.
Economic Growth: Strong GDP and labor data reduce rate-cut expectations.
Tokenization and US Treasuries. Forecast 2027–2035Hello, gentlemen ⚫️ | comrades 🔴 | colleagues 🔵
After a prolonged silence and at the end of the year, I return, as usual, to dissect the markets and publish new ideas on my favorite platform, TradingView. Before you is an updated forecast for long-term US bonds targeting the pivotal year 2027 and a strategic horizon stretching up to 2030–2035.
To keep your brain from boiling over, the material is structurally divided into three logical blocks:
1️⃣ Infographics
2️⃣ Breakdown of the US10Y chart
US 30-Year Yield: Triangle Breakout Targets 6.46%US yields have had a big week, especially the 30-year and the 10-year. The 30-year has gone from around 5.20% to just above 5.70% in a few days. So how much further can it run?
Overbought? Yes. Over? Not necessarily.
The RSI is stretched, and anyone calling this overbought has a point. But the RSI has been at these levels before, and the trend is clearly higher. A correction is possible, but an overbought reading doesn't mean the move is finished.
The bigger picture: a 3-year triangle on the
yields on FR10YrPretty simple chart to my eyes.
Fib 1.618 Extension for a standard Wave 3 will see the Yield on the French 10Yr back into that big gap waiting to be filled.
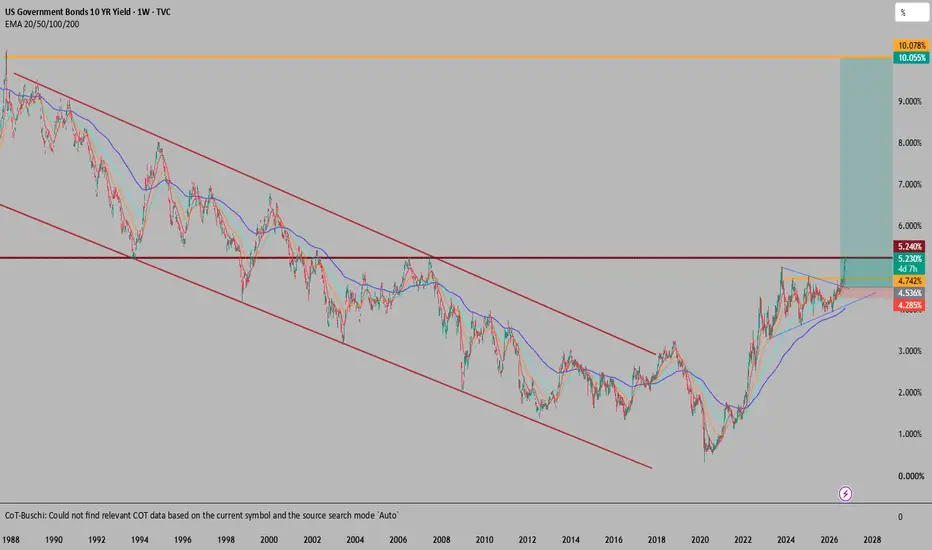
I'd expect Yields on the French 10 Year to peak just under 10% ... that'll make the French elections interesting against this backdrop!
US10 - Red October? The 10 year Treasury yield is back trading at levels last seen right before the Great Financial Crisis, and that alone is enough to make people pay attention. Back then, a sustained move higher in yields was one of the signals flashing before everything unraveled in 2008. Since expectations are now weighing toward the Fed holding rates higher for longer, how yields move from this point forward will continue to ripple through the entire economy. Let's take a look at what the chart is saying.
Th
The Interest Rates That Matter to High FinanceUS market bond yields have recently reached new highs amid uncertainty surrounding inflation prospects, geopolitics, monetary policy, and public debt.
However, it is important to keep in mind that market bond yields have different roles and meanings depending on their maturity, i.e. their time horizon.
Three US interest rates play a dominant role:
· The US 2-year Treasury yield
· The US 10-year Treasury yield
· The US 30-year Treasury yield
To summarize, remember that:
· The 2-year Treasu
2Y Yield: Daily Velocity vs Multi Year MomentumDaily Chart: Velocity vs Structural Pullback
Persistent shallow corrections:
In strong trend regimes, textbook bearish RSI divergences routinely fail to generate meaningful reversals. Instead of a price collapse, the indicator burns off overbought readings through sideways consolidation or shallow 10 to 20 bps pullbacks before the next leg up.
The parabolic push:
The final ascent into the 4.9% to 5.0% zone has the steepest trendline. The TTM histogram shows expanding momentum bars, confirming
Nightmare Signal: Yields Outperforming EnergyLook back at March and notice that yields were pushing higher because of higher oil prices (higher inflation expectations).
Trump, Bessent, and others successfully talked down energy prices, but still yields continued to make higher highs, indicating this was not over in the slightest.
Now as time has gone on, yields go up with oil, but not down as much or at all when oil has a down day. Additionally, longer-term oil futures are pricing in these high prices at least until the end of the year
Yields Squeezing, Dollar Running, and What It Means for GoldIf you look at the charts right now, a major technical and macroeconomic setup is unfolding across Treasury Yields, the US Dollar Index TVC:DXY , and Gold.
1. Weekly Squeeze on 10 Year Yields
The weekly chart for TVC:TNX shows price action is coiling tightly into the apex of a multi year pennant pattern. The moving averages (red and green lines) are stacked underneath price, curling upward, and providing dynamic support. At the same time, weekly momentum indicators like the TTM Squeeze are t
10-year US Treasury yield :5,8%-6,3 %
10-year US Treasury yield:
- The upward trend on the weekly chart persists, as the tightening policy remains in effect.
- Wave patterns suggest the yield could rise to the 5,8%–6,3% range.
- The market is currently pricing in a roughly 66.4% probability of a 25-basis-point rate hike by the Fed at the October 27–28, 2026 FOMC meeting.
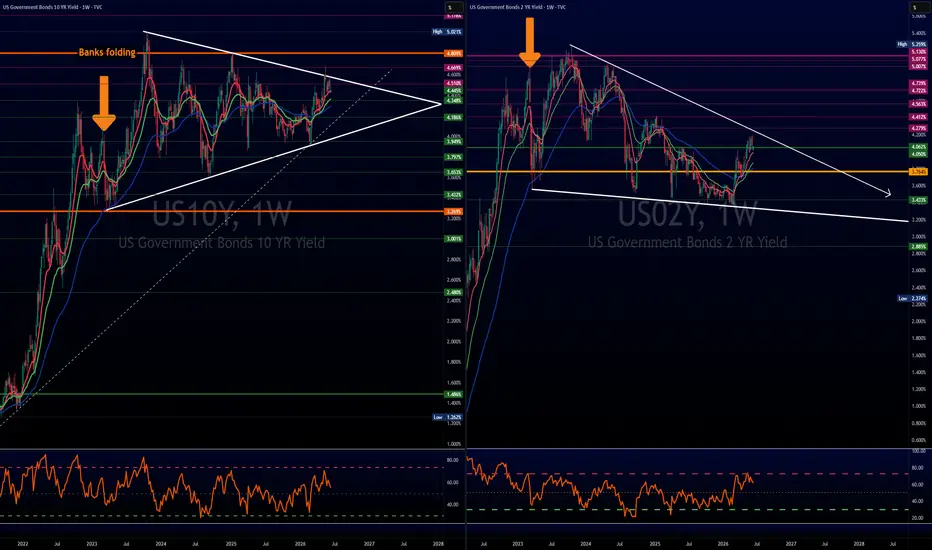
Bond Yields TalkingThe macro yield landscape is undergoing a massive regime transition
We are moving from the vertical momentum of 2022 to 2023 into an ultra compressed, multi year consolidation phase
Both the TVC:US02Y & TVC:US10Y are choking at critical structural boundaries
Let’s dive in👇
The Short End:
The 2Yr Yield ( TVC:US02Y ) is printing a textbook macro pennant/descending wedge following its massive flagpole run
Price is highly compressed between two converging trendlines, currently testing t
Gold Sell-Off Explained: When Real Yields Overpower Safe-Haven Gold is falling even as geopolitical risk remains elevated - a useful reminder that gold does not trade on fear alone.
In this Errante Analysis & Education session, Ali Mortazavi, our head of education, examines why the current decline is being driven primarily by rising real yields, a stronger U.S. dollar and tighter Fed expectations, while long-term ETF and central-bank demand remains supportive.
The key lesson is that the marginal buyer or seller determines today’s price. Strategic holders
Will the bond sell-off finally come to an end?This is one of the major questions occupying the minds of institutional and retail investors: will the downward trend in bond prices finally come to an end this year?
Indeed, the bond market has been in a downward trend since its all-time high in 2020. Some people refer to it as a bond market crash, but there is no need to exaggerate either: the decline has been taking place in a controlled and gradual manner.
A good equity portfolio is a diversified portfolio, but it is true that bond perform
Update on one of the first post I posted in the channel This is just an Update video on one of the first posts I have made in the channel and were going over what I got right and what I got wrong. The prediction we made months ago was right that we got to 5% but where we were wrong was we didn't have a market correction or not just yet at least for the mean time.
Tunnel vision on the US 10Y, your looking the wrong way!The talk of the town Is the TVC:US10Y and CFI:WTI
I believe people are having tunnel vision and missing very important clues that can guide us and help us decode what's going on in the US 10y and the US markets. Today were taking a look at the Japanese markets today as that market is in a extreme case of what's happening here and could give us insights as to what could happen here in our markets in the USA!
10-Year Nears a Historic Point on the Chart5.25%
That was the high yield in 2006 and 2007, and that's ultimately where yields topped before they began to tumble. The Financial Collapse drove capital flows into the safe harbors of bonds and, at that point, investors were happy to get a secure 5%, then 4.5%, then 4% and ultimately even 3%.
As bond prices rose and yields tanked, there was more incentive for investors, both retail and institutional, to try to lock in higher rates before prices rose further. This, ultimately, helped to dri
US10Y Enters a Major PRZ: Is a Treasury Yield Correction Next?The U.S. 10-Year Treasury Yield ( TVC:US10Y ) is one of the most important benchmarks for global interest rates and financial conditions.
When US10Y rises sharply, it can tighten financial conditions and pressure stocks, gold, Bitcoin, and other risk assets. A decline in yields can have the opposite effect and support these markets.
US10Y has now entered an important technical area. Can the bullish trend continue, or is a correction about to begin?
Technical Analysis
US10Y has developed a s
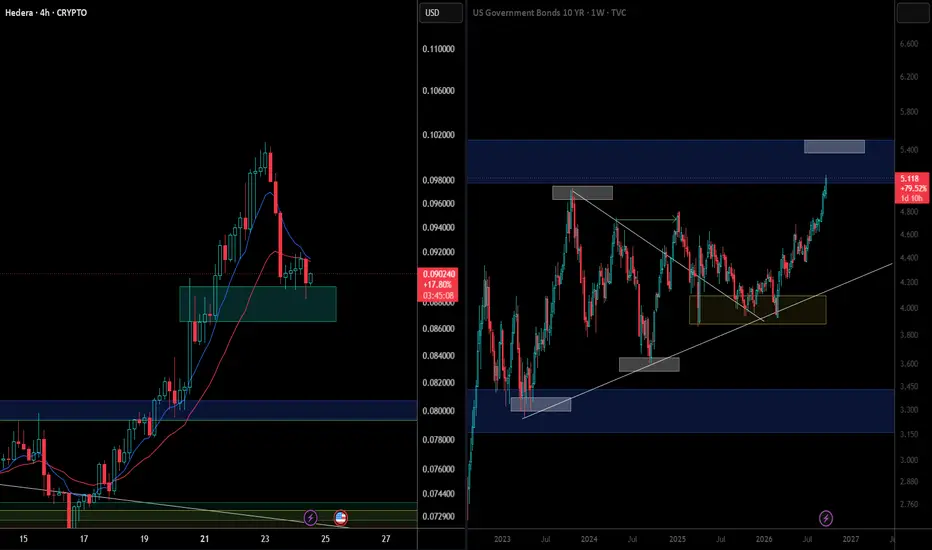
US10Y Is Rising Again: Could 5.1% Trigger Pressure Across GlobalThe U.S. 10-Year Treasury Yield ( TVC:US10Y ) is one of the most important benchmarks for global interest rates and financial conditions.
A strong rise in US10Y can affect U.S. stocks, Gold, Silver, Bitcoin, and the broader crypto market.
Could US10Y continue rising toward 5.1% and create another wave of pressure across financial markets?
Macro Outlook
US10Y represents the yield investors receive from holding a 10-year U.S. Treasury bond and is widely used as a benchmark for long-term inter
10 year US Notes Broke Lower, Keeps Dollar StrongUS yields are pushing higher again as strong US data keeps expectations for more Fed tightening alive, supporting the dollar and weighing on stocks. The US-China meeting is in focus today, with trade, tariffs, rare earths and technology likely key topics. Oil is seeing some rebound after the recent sharp pullback, but there is no major new escalation in the Middle East so far. For now, higher yields and a stronger dollar remain the main drivers across markets.
Looking at the US 10-year Treasury
You need to follow the US Mortgage Rate. Here’s why.The US Federal Reserve therefore unveiled its new monetary policy outlook last week. A Fed led by Kevin Warsh that will remain very largely “data dependent”, given the still-high level of geopolitical uncertainty.
We often refer to US government bond market interest rates to properly measure the rise in borrowing costs for the government and businesses.
But how can we properly assess the impact this may have on mortgage credit for US households?
Here is my answer: you need to follow a very spe