Long
Long
 Short
Short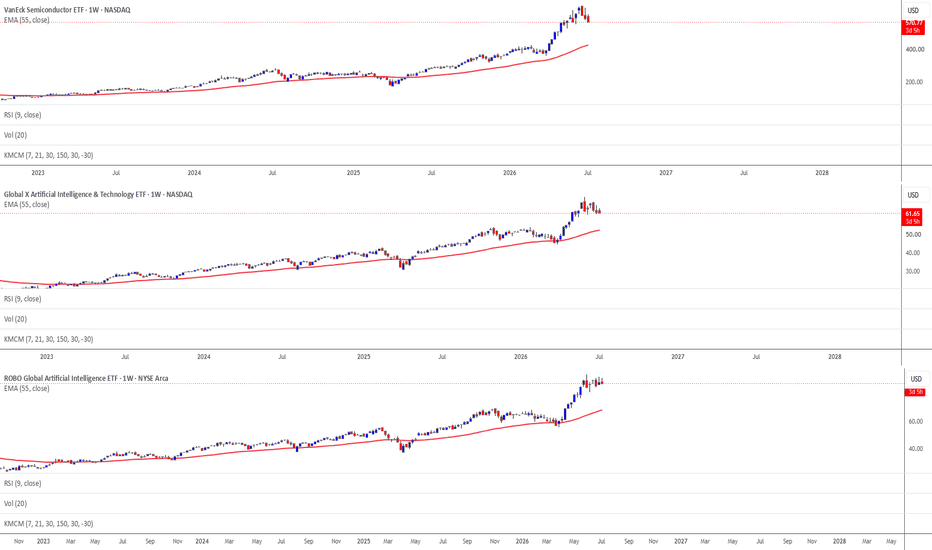
Do Not Lose your SOXX! Pt2Back on June 23, we sounded the alarm on chips. That warning is now playing out in real time. Let us look at what the charts are telling us today without making it too complicated.
The Daily Chart Is Getting Ugly
The short term picture shows that sellers are firmly in control right now.
Price is currently trading below all of its key short term moving averages.
We are right on the verge of a bearish crossover, which CAN mean more downside pressure is coming.
The daily TTM momentum indicator is about to turn red, showing that the buying power has completely dried up for now. (NOT SHOWN)
Where is the Floor?
We are currently sitting right around a minor support area near 540. If this area holds, the bulls might get a bounce.
But if 540 breaks, the floor is a long way down:
There is no real support under us until we hit 465, which is a level the market zoomed past and barely traded at earlier this year.
If we look at the big picture weekly chart, the ultimate major support level sits all the way down around 360.
The Big Picture
History shows us that the long term trend for semiconductors is incredibly strong. Even when momentum slows down, it can eventually find its footing and march higher. However, the short term daily trend is broken. Buying the dip right this second is a high risk move until the charts show us that the selling is done.
Do you think 540 holds through the week, or are we visiting 465 sooner rather than later?
NASDAQ:SMH NASDAQ:SOXX NASDAQ:SOX  Long
Long
 Long
Long
 Short
Short
SPY Finally Broke 751. Now It's Testing Whether It Holds.SPY Finally Broke 751. Now It's Testing Whether It Holds.
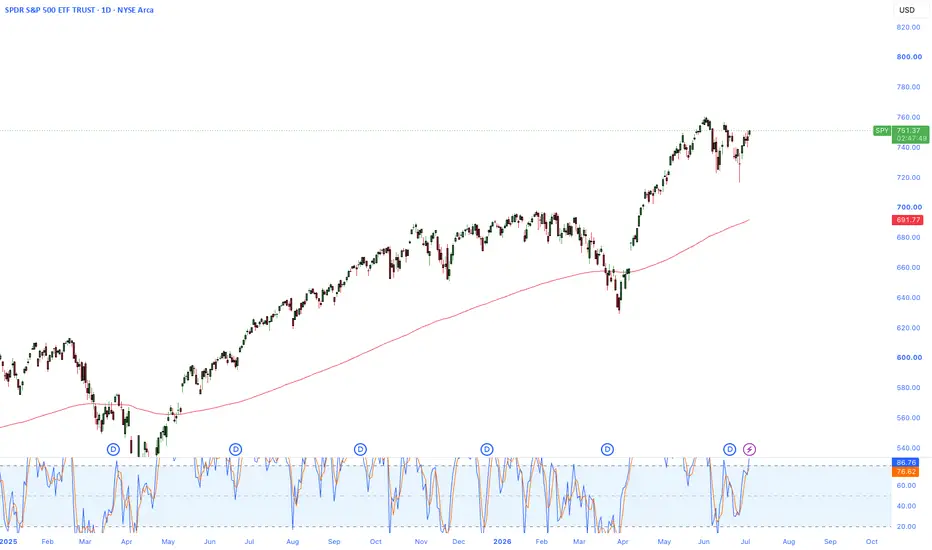
SPY broke through the 751 band that had rejected it for a week, tagging 752.40 and closing at the highs, then pulled back to 749.67. The bullish anchor that had been flagging itself for three straight sessions healed instead of breaking - it dropped its warning and price broke up, not down. That is the opposite of how the week looked like it would resolve. But the near-term read has already flipped short on the pullback, and the daily still is not fully convinced of the move, so the breakout is not clean yet.
Resistance: 752.40 - yesterday's high
Key resistance: 754.31-756.92 - the cluster above
Current price: 749.67
Support: 745.90-744.28 - the old band top, now support to hold
Key support: 740.44 - the shelf below
Structural floor: 716.50 - the operative low this cycle
Two paths from here:
The breakout confirms. The 224-bar bull print healed its anti-signal and price cleared 751 on the close, so a hold above the old 746-751 band turns it into support and opens the 754-756 cluster, then the cycle high. The anchor that would not break for a week just proved itself, and a successful retest of the breakout level would seal it.
The breakout fails back into the range. Price is already back under 751 and the near-term read flipped short, so a loss of 745.90 drops it back into the range it just escaped and turns the breakout into a trap. The daily still is not confirming - a break above resistance that the conviction engine will not validate is the kind that gets sold.
For a week the question was whether the cracked bull anchor would finally give. It did the opposite - healed and broke out. Now the test is whether the breakout holds a retest or fails back into the range, and the near-term read flipping short on the first pullback is the early warning that it might not be clean.
Built with SYNTHESIS v3.3 | SOM / ACE / IMP / SYNTHESIS
Study, not financial advice. Long 
SPY in July Despite what others will tell you no one “knows” what the market will do. We need to look at all the possibilities so we understand how to trade when the market plays out similar to one of these scenarios
1. Green Path: Bullish July (Breakout & Continuation Higher)
• Key Confirmation to Watch: Sustained break and close above the blue descending resistance trendline (currently around 750-760 zone) with strong volume and bullish candles. Look for reclaim of recent highs and acceleration above the yellow horizontal (~751-755 area).
• What to Expect: Strong upward momentum with the green zigzag line targeting 770-780+ initially, then pushing toward 800-830 if buyers dominate. Higher highs and higher lows on daily/weekly charts.
• Bullish Catalysts/Invalidation: Rising volume profile support, positive option signals (HD signals turning bullish), and macro tailwinds (e.g., Fed easing hints, strong earnings). Invalidate if price rejects the trendline and falls back below ~740-745 with conviction.
2. Yellow Path: Neutral July (Sideways Consolidation)
• Key Confirmation to Watch: Price oscillates around the yellow horizontal line (~751) and between the blue descending and red ascending trendlines without decisive breaks. Choppy candles, contracting ranges, and low volume typical of range-bound action.
• What to Expect: Sideways grind between roughly 730-760, with repeated tests of the dotted horizontal support/resistance. The yellow path shows zigzagging within this band, reflecting indecision ahead of major events (earnings, Fed).
• Neutral Catalysts/Invalidation: Balanced order flow, option signals staying mixed, and no strong directional bias in volume. Invalidate on a clear breakout above the blue line (bullish) or breakdown below the red support (bearish).
3. Red Path: Bearish July (Breakdown & Decline)
• Key Confirmation to Watch: Failure at the blue descending trendline or yellow horizontal, followed by a decisive close below the red ascending support trendline (currently in the 730-740 area). Acceleration on increasing red volume/candles.
• What to Expect: Sharp downside move as shown in the red arrow, targeting 710-720 initially and potentially lower (680-700 zone) if selling intensifies. Lower highs and lower lows confirming bearish structure.
• Bearish Catalysts/Invalidation: Weak option signals, negative volume profile shifts, or macro shocks (e.g., poor data, geopolitical risks). Invalidate on a strong rebound above the blue trendline with bullish reversal candles.
Overall Chart Context: SPY is at a pivotal junction near 751 with conflicting trendlines (blue resistance vs. red support). The paths illustrate the three likely July outcomes based on how price interacts with these levels. Monitor volume, HD Option Signals, and VRVP for early clues. Risk management: Define entries/exits at the key trendline breaks. Relative Strength Stocks I'm Watching Right NowThese are the strongest names on my radar right now:
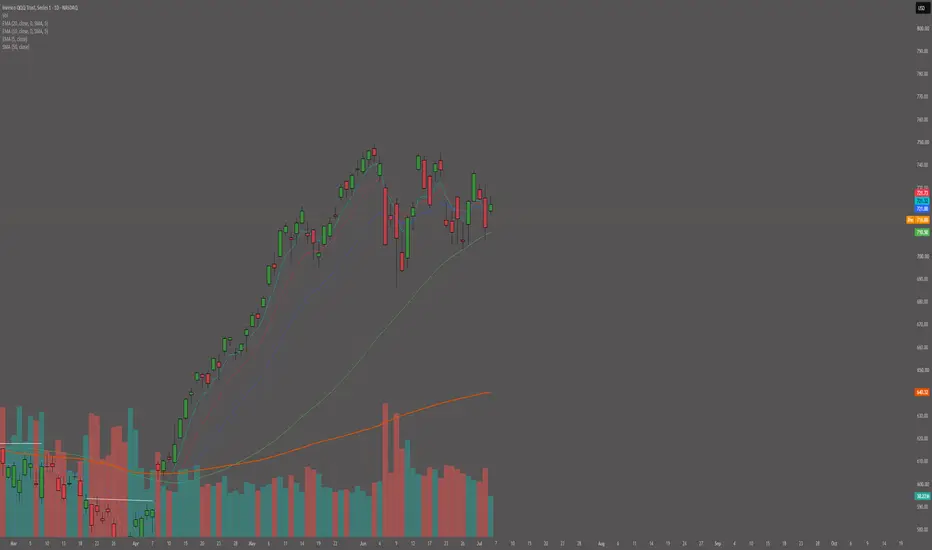
NYSE:RBRK , NASDAQ:CRWD , NASDAQ:DDOG , NYSE:SNOW , NASDAQ:OKTA , NASDAQ:PANW
Around June 26th, I entered several new positions, while already holding my existing RBRK trade. The new additions were CRWD and DDOG.
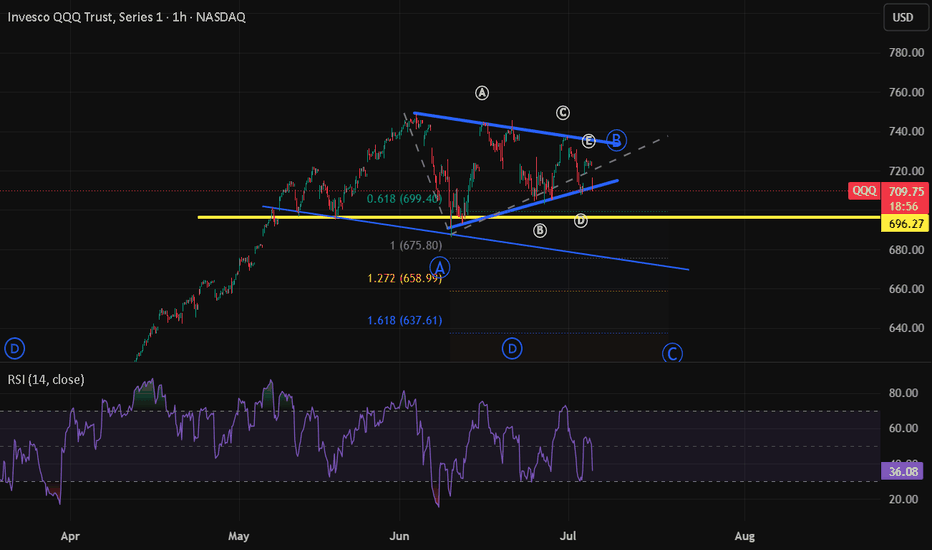
I ended up closing all of these positions on July 2nd when the Nasdaq ( NASDAQ:QQQ ) broke down below its 10/20 EMA. Looking back, I shouldn't have sold everything—only a partial piece. This is a clear room for improvement for me, as these stocks actually kept pushing higher afterward.
For now, QQQ is looking quite volatile, so we will see how it plays out. However, I am definitely focusing on watching the strongest stocks that show relative strength.
Not financial advice.
 Long
Long
I Tracked 1,262 Trades. Five Losses Proved Nothing.“The strategy stopped working.”
That was the conclusion I reached after five losses.
I had spent years moving between Harmonics, price action and Wyckoff. Every time the losses arrived, I started looking for another answer.
Then I recorded 1,262 trades.
My win rate was 21%. My average winner was 3.93R.
That sample finally showed me what five trades actually told me.
Almost nothing.
Five Trades Feel Like Proof
Here is how a losing run feels from inside the account.
Loss one. Fine.
Loss two. Annoying.
Loss three. You check the entry rules again.
Loss four. You start wondering whether the market has changed.
Loss five. You open YouTube.
I know that cycle because I lived it.
I would find another strategy, test it for a while and feel confident again. Then the first ugly run arrived and I repeated the process.
The losses were real. My conclusion was the problem.
Five trades were far too little information to judge the system.
Losses Come in Clusters
Flip a fair coin enough times and you will see ugly streaks.
Several heads or tails can appear in a row without changing the odds of the coin.
A trading system behaves the same way. Wins and losses do not arrive in a neat pattern.
With a 21% win rate, losses are more common than wins. That does not automatically make the system unprofitable. Across my 1,262 recorded trades, the average winner was large enough to offset a mostly losing column.
But you cannot see that relationship across five trades.
You need enough trades for the average winner, average loser, win rate and losing runs to become visible.
Without that sample, every loss feels like a new problem.
One week, you blame the entry.
The next week, you change the exit.
Then you add another indicator.
You are not improving the system. You are preventing it from producing enough clean data to evaluate.
A Short Sample Can Mislead You Both Ways
A small sample does not only make good systems look bad.
It can also make bad systems look good.
You can take five random trades and win four. That does not prove you have an edge.
You can follow a tested system for five trades and lose all five. That does not prove the edge disappeared.
The same problem sits underneath both conclusions. You are asking a small sample to answer a question it cannot answer yet.
This is why I stopped measuring my trading in individual outcomes.
The useful questions are simpler:
• Did the trade match the tested setup?
• Was the risk correct?
• Did I follow the exit rule?
• Am I still collecting the same type of trade?
If the execution changed, investigate the execution.
If the rules stayed consistent, one losing run is not enough reason to rebuild the system.
Your Journal Holds the Answer
You cannot judge a sample that only exists in screenshots and memory.
Memory keeps the painful losses and exciting winners. It forgets the boring trades between them.
A journal forces you to see the full sequence.
Open your last 20 trades from one setup. Keep them in the order they happened.
Write down:
• Win, loss or breakeven
• Result in R
• Whether the setup followed your rules
• Whether the execution followed your rules
Twenty trades still cannot prove that a system works. That is not the purpose of this exercise.
The purpose is to show you how little one bad week can prove.
You may find that the strategy was never tested properly.
You may find that the rules changed between trades.
Or you may find a normal losing run inside a system you abandoned too early.
All three findings are more useful than “the market changed”.
If your trades are scattered across screenshots, get a trading journal.
Record the next 20 trades from one setup in order. You will have something stronger than confidence when the next losing run arrives.
You will have data. Bearish case for XLCGood morning traders,
The bearish thesis for XLC is not that digital advertising or communication services are disappearing. Instead, it argues that the market may be underestimating several medium-term risks:
Valuations remain demanding for the largest holdings.
Earnings expectations may be too optimistic.
AI monetization could take longer than expected.
Capital may rotate toward sectors with better earnings momentum.
The ETF is highly concentrated in a handful of mega-cap stocks.
The downside case is therefore driven more by multiple compression than by a collapse in revenues.
1. Extreme concentration risk
One of XLC's biggest weaknesses is its concentration.
The ETF is dominated by companies such as:
Meta Platforms
Alphabet
Netflix
Meta and Alphabet together account for a very large share of the portfolio.
This creates two problems:
company-specific risks become sector risks;
disappointing earnings from only one or two companies can materially impact ETF performance.
2. AI expectations may be ahead of reality
Markets increasingly assume that AI will generate:
higher advertising revenue;
lower operating costs;
new software products;
productivity gains.
However, there are risks:
AI infrastructure spending is extremely high.
Monetization remains uncertain in some areas.
Returns on capital may take years to materialize.
If investors become less confident about AI payback periods, valuation multiples could contract.
3. Advertising is cyclical
Although digital advertising has structural growth, it remains economically sensitive.
During an economic slowdown:
marketing budgets are reduced;
advertisers delay campaigns;
small businesses spend less.
Companies with large advertising exposure could therefore face earnings pressure.
4. Regulatory pressure
Large communication platforms continue to face regulatory scrutiny.
Potential risks include:
antitrust actions;
digital advertising regulation;
privacy restrictions;
AI regulation;
content moderation requirements.
Higher compliance costs could weigh on margins.
5. Limited multiple expansion
Following several years of strong performance, many of XLC's largest holdings already trade at premium valuations.
Even if earnings continue growing, future returns may depend more on earnings growth than on valuation expansion.
6. Rotation toward other sectors
One of the biggest risks is capital rotation.
If investors begin favoring sectors such as:
software,
industrial automation,
utilities,
financials,
XLC could underperform despite posting positive earnings growth.
This type of relative underperformance is common in late-cycle sector rotations.
7. High capital expenditures
Meta and Alphabet are investing heavily in:
AI data centers;
GPUs;
networking;
cloud infrastructure.
If these investments continue growing faster than revenue, free cash flow margins could come under pressure.
8. Slower user growth
Many communication platforms have reached very high market penetration.
Future growth increasingly depends on:
monetization;
pricing;
engagement.
This is generally harder than simply adding new users.
What would invalidate the bearish thesis?
If price returns above 200 MA
This short position is part of a diversified portfolio, you can follow my track record at signature links
Regards  Short
Short
 Long
Long
 Long
Long
3 Chart Habits That Separate Consistent Traders from Lucky OnesWe built Colony Trading around a simple belief: trading performance is a skill, and skill shows up in habits, not hot streaks. Here are three charting habits that consistently separate disciplined traders from lucky ones — in any market, real or simulated.
1. Mark your levels before the session, not during it. Disciplined traders draw their support and resistance zones before making a single trade. When price reaches a level, the decision was already made — they're executing a plan, not reacting to a candle.
2. Use fewer indicators, more deliberately. Strong traders typically run 1–3 indicators they deeply understand (usually volume plus one momentum tool), not ten overlapping ones. An indicator you can't explain is noise with extra steps.
3. Size positions around invalidation, not conviction. The question isn't "how sure am I?" — it's "where am I wrong, and how much does it cost to find out?" Traders who define the exit before the entry survive the losing streaks that eliminate everyone else.
These are the habits we built our own skill-based simulated trading platform around — no real capital at risk while you build the discipline. Chart your levels, know your tools, define your risk.
— Logan Mullins, founder of Colony Trading  Education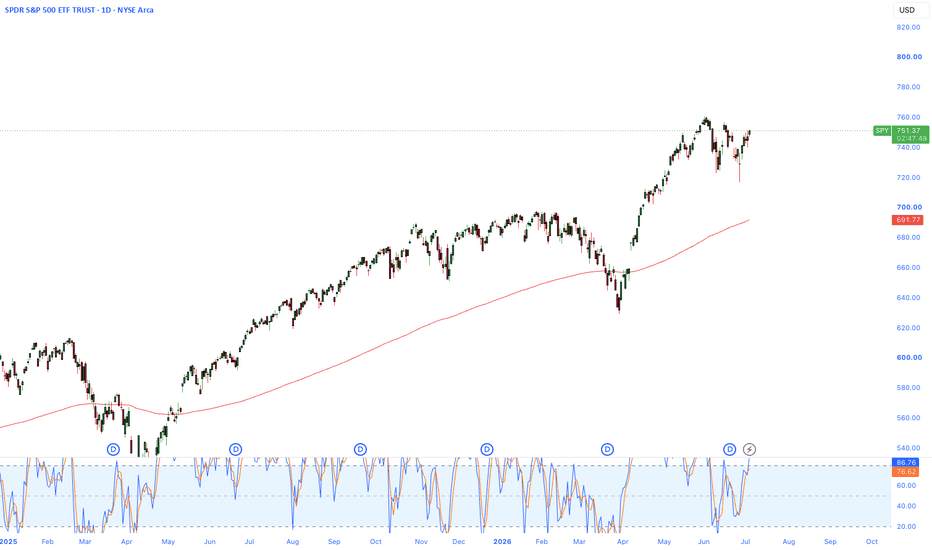
SPY tags the expected move high, then stalls —750.98 is the lineComing out of the long weekend, options had priced a wide day — an expected move band of 738.58 – 750.98. The gap-up ran straight into the EM high, rejected, and price is now sitting just underneath it.
Below 750.98, the band edge is doing its job — that was the boundary of what the market paid for going into today, and the first tag drew sellers. A reclaim and hold above puts the tape in "moving more than priced" territory, with PDH 751.31 right overhead as the next test. Below, Thursday's close at 744.78 is the middle of the range, with the EM low at 738.58 as the far edge.
FOMC Wednesday 2:00 PM ET — expect positioning to tighten into it and a wider band that day.
The expected move is a probability range, not a wall — price closes beyond it about one day in three. Levels are context. Trade your own plan.
Plotted with my SPY/SPX Expected Move script.
-Janice  Long
Long
Long 
 Long
Long
SPY / SPX Weekly Outlook – Week 27 of 2026 (06-10 JUL)SPY / SPX WEEKLY MARKET OUTLOOK
Last Week's Recap
We only took one trade on SPY last week. It came on Tuesday after price successfully broke out of the Chop Zone we had identified in the Weekly Market Outlook.
1 trade. 1 win.
(For reference, I have included last week's outlook on the right.)
"UA CAPITAL EXECUTION/MANAGEMENT RECAP "
Week 26 of 2026 marked another green week for UA CAPITAL, extending our streak to 13 consecutive profitable weeks. We have now gone the entire year without a single red week.
Markets spent the first half of the week grinding slowly higher. In our published outlooks, we explained that we had no intention of trading inside the Chop Zone, which also aligned with a major Cluster Gamma Wall carrying extremely high total delta exposure. Our expectation was simple: price needed to leave this range before offering a high probability opportunity. Because of that, we stayed patient and did not take any trades on Monday.
Tuesday finally delivered the breakout we had been waiting for. The UA CAPITAL Trading Desk was immediately notified through our chat, and we entered intraday scalp positions across SPY, QQQ, and Nasdaq futures. We closed those positions later in the session with a solid profit ahead of Wednesday's employment data, choosing not to carry unnecessary event risk overnight.
The execution itself highlighted another advantage of our CC Model. Rather than trading each index independently, we first waited for confirmation on SPY before using the correlation between SPY and QQQ to execute both positions simultaneously. This confirmation based approach continues to filter out many false signals while significantly improving execution quality. It has become one of the core trading frameworks inside the UA CAPITAL Trading Desk because we focus on reacting to confirmed price action instead of predicting market direction.
Our SPY entry was executed around 743.5 and closed near 747.5, producing another clean intraday winner.
On Wednesday we remained completely inactive. Thursday's Non Farm Payroll report represented a major macro catalyst, and we believed it was better to wait until that uncertainty had passed before opening new index positions.
The only adjustment we made was hedging our existing swing and spot long positions by purchasing VIX call options together with the Trading Desk. When Thursday's employment report came in stronger than expected, markets avoided the sharp selloff we had hedged against. We closed the VIX positions for a small loss, which simply became the cost of insurance. From a money management perspective, it was exactly the type of disciplined hedge we aim to execute.
Thursday's stronger than expected data pushed markets modestly higher during premarket trading. Since none of our predefined SPY or QQQ scenarios were triggered, we once again avoided forcing trades. Instead, we shifted our focus toward individual equities.
Equities Play
Last week I mentioned that capital could begin rotating out of semiconductors and memory names into large cap technology. During the week, that rotation became increasingly visible.
In Thursday's premarket update, I told the Trading Desk that I intended to build long exposure in AAPL, MSFT, and GOOGL.
At the open we executed exactly as planned. AAPL and MSFT generated strong gains, while GOOGL was stopped out near breakeven.
AAPL advanced approximately $13, producing a gain of around 4.4%.
MSFT gained roughly $6, representing approximately a 1.6% move.
The profits generated from these large cap equity trades were highly satisfying.
Meanwhile, memory names such as MU declined sharply, exactly as anticipated. However, because most of the weakness occurred during premarket trading, they never offered attractive retest opportunities for short entries.
Overall, it was another successful week. Although the Risk Index had been expecting a healthy retracement, the stronger than expected NFP report prevented that correction from developing. Instead, we adapted quickly, focused on the strongest sectors, generated solid profits through our equity positions, and added another winning SPY trade to finish the week.
This Week's Scenarios / Prediction
Risk Index
This oscillator reads macro conditions and converts them into a technical risk framework. It was developed internally at UA CAPITAL and remains the primary indicator I use for both short term and long term positioning decisions.
The Risk Index algorithm is currently signaling a short term neutral to slightly bearish environment. That means additional downside remains possible over the near term. However, the longer term structure continues to remain firmly risk on, suggesting that quality demand zones should still produce attractive swing long opportunities.
Our approach this week remains straightforward. We will look for short opportunities from the primary swing resistance area while remaining prepared to buy confirmed reactions from our predefined demand zones. The longer term bias remains bullish.
Scenarios / Strategies
Short Scenario
Swing Area (754.5)
This area represents the primary Call Wall and our highest probability supply zone. If price retests this level and shows clear rejection, it can provide a quality short opportunity.
Trigger: Retest followed by a bearish one hour candle closing back below the level.
Targets: 751 → 747 → 743 → 740
Invalidation: Hourly close above 757.
Long Scenario 1
KEY Level 1 (747)
This is the first major demand zone. If price reaches this level and confirms support, call options can be used to establish long exposure.
Trigger: Price must reach the level and produce a bullish one hour candle close back above the zone.
Targets:750 → 754.5 → 757 → 760
Invalidation: Hourly close below 743.
Long Scenario 2
KEY Level 2 (735)
This is the second major demand zone. If price reaches this level and confirms support, call options can be used to establish long exposure.
Trigger: Price must reach the level and produce a bullish daily close back above the zone.
Targets: 740 → 743 → 747 → 750 → 754.5
Invalidation: Daily close below 730.
Position Management Rules
-Entry model: Aggressive: one hour candle close above or below the designated level.Conservative: daily candle close above or below the designated level.
-Take profits in stages because market reversals can happen quickly.
-After the first profit target is reached, move all remaining stop losses to breakeven and convert the position into a risk free trade.
-A reaction from the level must be be confirmed. We do not predict price. We react to price.
Daily candle close below the designated bounce zone equals stop loss.
Notice: Starting a fresh, high frequency track record for SPY, QQQ, and core equities on TradingView. Moving forward, all institutional research, weekly outlooks, and mid week updates will be tracked consistently right here.
This analysis is for educational purposes only and reflects my personal opinion. It is not financial advice.