Arista - Every GPU in the World Needs This Stock (ON SALE!!)ANET — 20% Correction, Unbroken Thesis | Breakout Retest at Key Confluence
NYSE:ANET has been trading in a well-defined long-term ascending channel, consistently respecting both boundaries. After testing channel support in April 2025 it launched a powerful bull run, peaking in October 2025. A multi-month consolidation followed before price broke out of the range. Classic pattern, it then retraced 20%+ to retest the breakout level.
That retest is happening right now at a triple confluence:
→ Horizontal support - former resistance turned support
→ Bollinger Band Basis - 20MA converging at exactly the same level
→ Ascending channel structure intact beneath
Support is holding. If it confirms we take a position.
Setup:
Entry $140-150 (confirmed rebound only) | Stop $125 (weekly close) | Target $260-290 (upper channel) | Next support if fails: $110-115
Probabilities:
🟢 Support holds → channel top — 60%
🟡 Consolidation at support — 20%
🔴 Breakdown → $110-115 — 20%
Why did it correct 20%?
Not fundamentals - sentiment and positioning.
The stock had already rallied 87% in a year and 34% in a single month. An impossibly high bar. Q1 2026 actually beat estimates, revenue $2.71B vs $2.62B expected, up 35% YoY, record operating cash flow of $1.69B. The CEO called it the best demand environment of her career. Yet the stock fell 14% on earnings day.
Why? Supply chain constraints on wafers, memory, and optical components are pressuring near-term margins. And guidance, while raised to $11.5B for the full year, fell short of the inflated expectations baked into the valuation. Classic sell the news after a parabolic run. The broader AI sentiment correction did the rest.
The business did not break. The multiple did.
Why could it rebound?
After the correction Arista trades at ~30x forward earnings, back to its historical average. The premium is gone. What remains is a company with $8.9B in contractual purchase commitments, AI networking revenue doubling to $3.5B in 2026, and $700B in hyperscaler AI capex flowing directly through its order book. Supply constraints are temporary. Demand is structural.
Google is reportedly becoming a significant new customer, which would reduce the Microsoft/Meta concentration risk that has been a persistent concern. The new XPO product delivers 8x bandwidth at 75% fewer racks, purpose-built for exactly the AI data centres being constructed right now.
53% of analysts rate it Strong Buy. Zero sells.
Confirmation signal: Weekly close above $155 on elevated volume.
Discipline over anticipation, we wait for confirmation before entering.
IBM (D) — the 25% crash lands on major supportNYSE:IBM
IBM comes into this session after one of the most violent sell-offs in its recent history, a drop of close to 25% that carries it from the 290 area to the current close at 217.07, all on volume that runs five times its daily average. That gap does not fall into thin air, it lands right on a structural support confluence, so this reads as a capitulation rather than a simple broken trend. On the daily timeframe price trades below the entire moving average stack, with the EMA 9 (275.44) and the EMA 20 (276.51) above the EMA 50 (268.04) and those over the EMA 100 (263.90) and the EMA 200 (262.64), a stack that has not reacted to the gap yet and stands as a distant ceiling. Momentum follows the fall. The MACD has turned to a bearish cross with its main line (2.12) below its signal (6.43) and a negative histogram, and the TRIX confirms the shift with its own downward cross. The fast stochastics have collapsed, with the 5 period at 12 and the 14 at 43, while the RSI 2 prints an extreme oversold reading (2.26) and the RSI 14 leans on the edge (30.35). The nuance comes from flow. The daily A/D still keeps its fast line (39.98) above the slow one (24.23) with a positive histogram, a sign that months of accumulated flow have not flipped in a single candle.
Monthly Analysis. On the larger timeframe the underlying structure is still constructive despite the damage. Price holds above the monthly EMA 50 (206.26), one of the references that defines the primary trend, and well above the EMA 100 (167.32) and the EMA 200 (130.96). The monthly candle is a huge range with a wide lower wick, reflecting that the drop found buyers near the lows. The monthly MACD keeps both lines positive even as the histogram begins to turn, and the monthly A/D remains at very high accumulation levels, with the fast line (81.69) just below the slow one (86.36), meaning an underlying flow that is only beginning to lose momentum. The monthly RSI 14 stays neutral (46.58). This is the frame that supports the idea that this is a severe correction inside a larger structure still alive.
Weekly Analysis. The intermediate timeframe is where the battle is fought. The sell-off pierced the weekly EMAs 9, 20, 50 and 100 in one move, clustered between 243 and 260, but price braked right on the weekly EMA 200 (209.29), the line that separates structural health from deep deterioration. The close at 217.07 leaves a narrow margin over that average, with the candle low (213.22) nearly touching it. The weekly MACD still keeps its histogram positive, a sign that the prior bullish impulse is not fully broken, and the weekly TRIX holds the fast line over the slow one. The warning comes from flow. The weekly A/D has already turned negative, with the fast line (-45.24) below the slow one (-19.52), which means the medium term has entered distribution. The picture is that of a critical support defended for now, but with the clock running.
4-Hour Analysis. The tactical timeframe reflects the short-term exhaustion. Every stochastic sits in oversold territory, with the 14 period and the 5 below 13, and the RSI 2 prints a near-absolute low (0.94) with the RSI 14 at 21.56. The 4-hour A/D already works in negative, consistent with the recent selling pressure, but the last candles show stabilization between 216 and 220 rather than direct continuation lower. That is the reading that suggests a first technical reaction may be close, as long as the 213 zone holds.
IBM is one of the most veteran technology infrastructure companies in the market, with a business that blends hybrid software, consulting and its historic systems franchise, and with enterprise artificial intelligence and the hybrid cloud as the axes of its growth narrative. A drop of this magnitude in a single session, paired with volume that runs five times the average, reflects an abrupt repricing of expectations by the market rather than a solvency problem. The move erases months of gains at once and sends the quote back to levels seen at the start of the year. For the technical thesis what matters is that this repricing has driven price precisely into the zone where the higher timeframe kept its supports, which turns the coming closes into the test of whether the market considers the punishment enough.
Key levels:
- Immediate resistance: 226-230 (breakaway gap and first target)
- Intermediate resistance: 242-243 (prior supply zone)
- Major resistance: 256-262 (long daily averages)
- Origin of the sell-off: 285-308 (supply of the breakdown)
- Immediate support: 215-217 (reference demand zones)
- Structural support: 209 (weekly EMA 200)
- Primary support: 206 (monthly EMA 50)
- Lower support: 185 (next protected structure)
Setup Rating — 3/5 ⭐⭐⭐⭒⭒ (Technical bounce with very clear structural support and extreme oversold, but with the short-term trend broken and medium-term flow turned to distribution)
✅ Positive factors:
- Major support confluence between 206 and 217, with the weekly EMA 200, the monthly EMA 50 and the demand zones coinciding
- RSI 2 at an extreme oversold reading on both the daily and the 4-hour
- Monthly A/D still in a high accumulation zone, with underlying flow intact
- Daily A/D with the fast line still above the slow one despite the fall
- Capitulation volume, typical of seller-exhaustion zones
- Primary monthly structure intact above the EMA 50
⚠️ Cautions:
- Simultaneous loss of the whole daily average stack in a single candle
- Weekly A/D already turned to distribution, with the fast line below the slow one
- Daily MACD and TRIX in a bearish cross, short-term momentum clearly negative
- Breakaway gaps often act as resistance on the first attempts
- Abrupt repricing of expectations that may need time to build a base before a reliable floor
👍 As long as the 213 to 206 zone holds on closes, the oversold extreme favours a technical reaction toward the 226 to 230 gap. Clearing that band would open the path to the 242 to 243 supply block, with the long daily averages between 256 and 262 as the larger target of a more ambitious recovery. The support from the monthly and daily A/D backs this scenario as long as price does not lose the structural support.
👎 A weekly close below 206 would break the support confluence and confirm the weekly A/D turn to distribution, leaving price without references down to the 185 zone and, lower still, toward the 167 of the monthly EMA 100. It would not be an invalidation of the business, but a deeper correction that would need time to build a base before any attempt at a floor. Above 206, every drop remains a test of support inside a larger structure still alive.
At which level would you consider a first entry, or would you rather wait for the support to confirm? 👇
Week 29 of 52 | LCID | One Rumor Nearly Erased the StockNASDAQ:LCID just gave investors one of the wildest sessions of the year.
The stock collapsed toward $2.37 after bankruptcy rumors spread across the market.
Then Lucid responded.
The company denied the report, called the rumors false and said it has enough liquidity to continue operating well into 2027.
The stock immediately recovered toward $4.60.
But here is the important part:
The bankruptcy rumor was denied.
The financial problems were not.
Lucid still has to deal with heavy cash burn, constant financing needs, dilution risk and a business that has not yet proven it can become profitable.
Technically, the long-term trend remains bearish.
The massive volume near $2.37 could represent capitulation, but one violent rebound is not enough to confirm a bottom.
Bullish scenario
If LCID holds above $4.00–$4.60, buyers could attempt a move toward:
$5.75
$7–$8
$10–$11
But even a move toward $10 would still be a recovery inside a much larger downtrend.
Bearish scenario
If LCID loses $4.00 again, the market could retest:
$3.25
$2.37
New lows if liquidity concerns return
My view:
LCID is now a high-risk speculation, not a quality investment.
The rumor may have been false, but the market’s reaction showed how little confidence investors currently have in the company.
This could produce a strong relief rally.
But until Lucid improves cash flow, production and profitability, every rally remains vulnerable.
Support: $4.00 – $3.25 – $2.37
Resistance: $5.75 – $7/$8 – $10/$11
⚠️ Educational purposes only. LCID remains highly speculative.
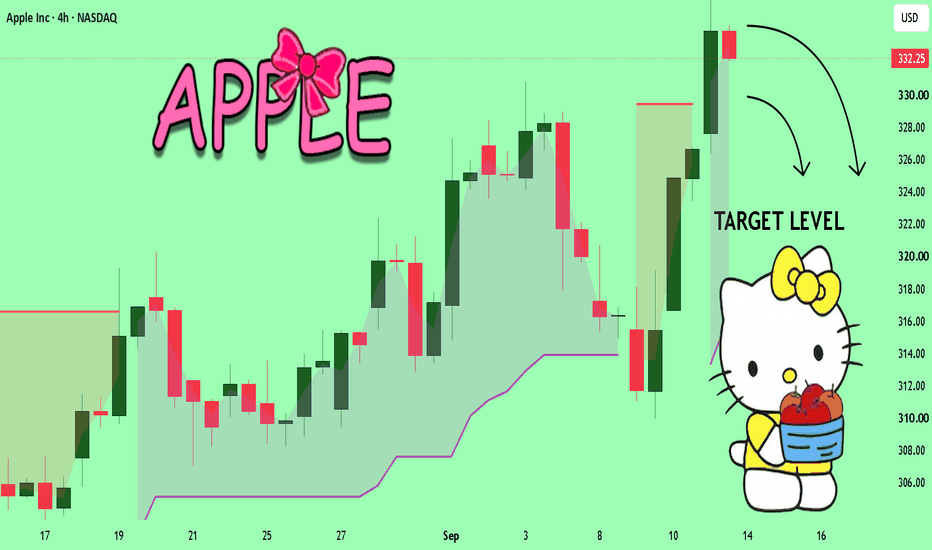
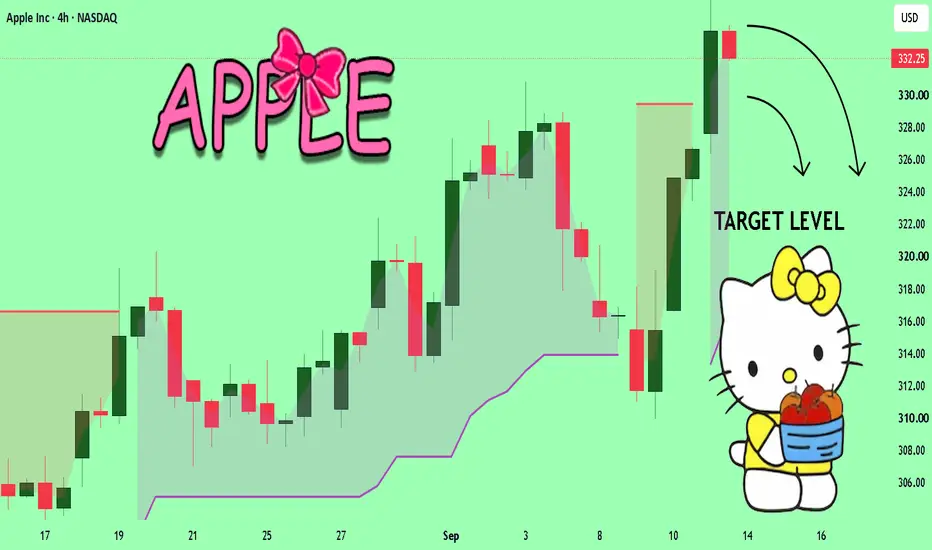
AAPL Is About to Pick a Side — Breakout or Trap?AAPL is sitting near a major decision zone, and today’s price action could create opportunity in either direction.
In this premarket breakdown, I’m walking through my complete AAPL trade plan using the PD-15 range, opening range breakout, retest confirmation, relative volume, and clearly defined profit targets.
The key levels I’m watching are:
PD-15 High: 315.72
PD-15 Low: 314.56
Call Targets:
TP1: 318.46
TP2: 319.76
Put Targets:
TP1: 311.96
TP2: 310.66
The plan is simple:
Above 315.72, buyers have an opportunity to maintain control.
Below 314.56, sellers may have room to push price lower.
Inside the PD-15 range, I’m staying patient and avoiding unnecessary chop.
I’m not entering simply because price touches a level. I’m waiting for the opening range to form, a confirmed breakout with displacement, a clean retest, confirmation, and supporting volume.
Opening Range. Displacement. Retest. Confirmation. Volume.
That is the process.
If this breakdown helped you prepare for the trading day, like the video, subscribe to the channel, and share it with another trader who needs a clear plan before the bell.
This is You Got Options.
Study the levels. Wait for agreement. Trade with discipline.
#AAPL #AppleStock #OptionsTrading #StockOptions #DayTrading #Premarket #TradingStrategy #PriceAction #OpeningRangeBreakout #YouGotOptions
DISCLAIMER: This content is for educational and informational purposes only and should not be considered financial, investment, or trading advice. I am not a licensed financial advisor. Trading stocks and options involves substantial risk and may not be suitable for every investor. Past performance does not guarantee future results. Always conduct your own research, manage your risk, and consult a qualified financial professional before making financial decisions.
AAPL TRADE IDEA JULY 15 BRADROC TRADING
AAPL finally got above 317 during pre-market and rallied all the way to 319.72. Since then, sellers have stepped in and started pushing price back down, so today's session should be interesting.
Call Idea
I'm looking for a close above 318 to confirm buyers are back in control. If buyers can keep the momentum going, I'm looking for a move back to 323, with a possible extension to 325.
Put Idea
Right now, it looks like sellers have a different plan. I wouldn't be surprised to see AAPL work its way back toward the 305 level before buyers make another serious attempt to take control. Look for a possible bounce around 312 before sellers step back in.
What I'm Watching at the Open
Let's see how the first 15-30 minutes play out before getting too aggressive. That opening range usually tells us who's in control for the morning.
If you're a scalper and you catch a strong volume move before the first 15-30 minutes are up—and it fits your trading plan—don't be afraid to take it. Just remember to manage your risk and take profits when the market gives them to you.
**My goal is to keep these trade ideas simple without all the complicated trading terminology that can overwhelm newer traders. This is not financial advice—it's simply how I see the market based on my own analysis. Always do your own research before entering any trade. Trading involves risk, so manage your risk and trade responsibly.
Microsoft Corporation (MSFT): Positioned to BenefitMicrosoft Corporation (MSFT): Positioned to Benefit From the Rotation Into Software
Industry: Software and IT Services
Ticker: #MSFT
Price at the time of analysis: $384.36
Target price: $430.00
Stop-loss: $355.00
The second half of 2026 began with a notable rotation within the technology sector. Investors have been taking profits in overextended semiconductor stocks and reallocating capital toward software stocks that have sold off sharply.
By early July, the performance gap between the Philadelphia Semiconductor Index (SOX) and the iShares Expanded Tech-Software Sector ETF (IGV) had widened to historically unusual levels. Investors are now increasingly rotating toward software companies whose shares trade at more attractive valuations.
Against this backdrop, Microsoft, whose shares have declined by more than 20% year to date, could become a major beneficiary of the rotation.
At the same time, the company’s fundamentals continue to improve. Growth across Microsoft’s core businesses is accelerating, while Azure and growing demand for AI infrastructure remain the primary drivers.
Microsoft’s quarterly earnings release on July 29 could provide an additional catalyst. Investors will focus primarily on Azure’s performance, capital spending, and management’s outlook for continued demand for AI infrastructure.
Company Overview
Microsoft (MSFT) is the world’s largest software company and one of the leading providers of cloud services.
The company’s core business drivers are Azure, Microsoft 365, and Windows, which support consistent revenue growth and strong margins.
Microsoft’s key competitive advantage is its position as a major beneficiary of AI adoption. Unlike semiconductor manufacturers, Microsoft directly monetizes growing AI demand through Azure and Copilot. This makes the company less dependent on the capital-spending cycles of hyperscalers.
Investment Thesis
The performance gap between the semiconductor and software sectors has reached a historical extreme, increasing the likelihood of a rotation into software stocks.
Over the past year, the Philadelphia Semiconductor Index (SOX) has gained approximately 130%, while the iShares Expanded Tech-Software Sector ETF (IGV) has declined by 16.7%. This represents one of the widest performance divergences on record.
The first signs of a rotation back into software emerged in early July. Investors have begun taking profits in semiconductor stocks and increasing their exposure to high-quality software companies.
We believe Microsoft, as the largest enterprise software company and a major beneficiary of artificial intelligence, could be one of the main beneficiaries of these inflows.
Historically Low Valuation and Upcoming Earnings
Microsoft’s historically low valuation and upcoming earnings report create an attractive entry point.
The stock trades at an NTM P/E of approximately 19.6x, its lowest multiple in a decade and broadly in line with its 2016 valuation.
Meanwhile, the consensus analyst price target stands at $557, implying upside potential of more than 45%.
Another important catalyst will be the company’s fiscal Q4 2026 earnings report, scheduled for July 29.
Consensus estimates call for:
• Revenue of $87.7 billion
• Earnings per share of $5.88
Management has guided to Azure growth of 39–40% in constant currency.
Azure growth has consistently exceeded market expectations in recent quarters. Another strong earnings report could therefore drive a rerating of the shares as investors continue rotating into software stocks.
Investors will also closely monitor Microsoft’s fiscal 2027 capital-spending outlook.
We believe a moderate increase in CapEx compared with fiscal 2026 would likely be received positively by investors. It would confirm continued strong demand for AI infrastructure without causing a material deterioration in profitability.
Bottom Line : We rate Microsoft Buy with a price target of $430.
We recommend setting a stop-loss order at $355.
NVDA Held The Reclaim, Coiling Under 212.55.NVDA Held The Reclaim, Coiling Under 212.55.
Nvidia held everything it took back yesterday. After running to 212.55 it is consolidating at 211.58, sitting on top of the reclaimed 207.59 with the high just overhead. The daily has flipped to a bullish thesis with strong top-quartile conviction, but two things keep this honest: the daily is reading DISBELIEF, meaning the move has run ahead of participation, and an old bear print is still standing on the daily, uncleared. Momentum reclaimed, belief not yet. Neutral.
Resistance: 212.55 - yesterday's high
Key resistance: 213.43 - the shelf above
Current price: 211.58
Support: 207.59 - reclaimed, the line to hold
Key support: 204.82 - interior support
Structural floor: 202.20 - the base, breakdown invalidation
Two paths from here:
The coil breaks up through 212.55. If NVDA holds 207.59 and pushes the high, the failed breakdown becomes a trend leg and 213.43-plus opens. Disbelief resolving into belief is the fuel for that move.
The disbelief wins and it slips back. An uncleared daily bear print plus disbelief at the highs is an overhang, not a green light. A loss of 207.59 puts 204.82 and the base back in view, and the day reads as a bounce that stalled.
NVDA took back the entire drop and is holding it. The tell now is whether belief catches up to price - through 212.55 says yes, back under 207.59 says not yet.
Built with SYNTHESIS v3.3 | SOM / ACE / IMP / SYNTHESIS
Study, not financial advice.
NAUFF - A Major Confluence Is Approaching!NAUFF remains within its broader bullish structure, with price continuing to trade above the rising green trendline acting as long-term non-horizontal support.
At the same time, the stock is currently moving through a corrective phase defined by the falling wedge pattern marked in red.📊
This correction is now bringing price closer to a particularly important technical area formed by the intersection of:
1️⃣ The rising green trendline
2️⃣ The lower boundary of the red falling wedge
3️⃣ The psychological $1 round number
4️⃣ The previous all-time high, which may now act as support
📌As NAUFF approaches this intersection , the area could become a significant decision zone for the stock’s next directional move.
An additional bullish signal is also developing on the MACD .
While price has continued forming lower lows within the correction, the MACD histogram has been forming higher lows, creating a potential bullish divergence. This suggests that bearish momentum may be weakening, although price confirmation is still required.⚡
As long as the broader support intersection continues to hold, the bullish structure remains intact and we will be watching for trend-following long setups.🐂
However , the correction has not yet been fully invalidated.
🎯For the bulls to regain stronger control and confirm the beginning of the next major impulsive movement, price would need to break and close above the upper boundary of the red falling wedge.
Such a breakout would confirm that buyers are overcoming the current corrective structure and would increase the probability of renewed bullish continuation.
📌 Gold has also been added to the chart for broader sector context.
NevGold is an exploration and development company with meaningful exposure to gold through projects such as Limousine Butte, Cedar Wash, and Nutmeg Mountain. For that reason, gold’s broader price structure can provide useful context when evaluating sentiment toward the company and the wider gold-exploration sector.⛏️
Gold is currently approaching an important support area of its own, which may provide a more constructive backdrop for gold-focused exploration companies if buyers begin defending that zone.
However , NAUFF should still be evaluated on its own technical structure, as the stock may not move in direct correlation with gold at all times.
In brief, NAUFF remains broadly bullish while trading above its rising trendline. The intersection near the $1 round number and previous all-time high could become an important support area, while a confirmed breakout above the falling wedge would provide stronger evidence that the next bullish impulse is beginning. 📈
⚠️ Disclaimer: This analysis is provided for informational and educational purposes only. It does not constitute financial advice or a recommendation to buy or sell any security. Technical conditions can change, and no outcome is guaranteed. Always conduct your own research and manage risk appropriately.
📚 Stick to your trading plan regarding entries, risk, and management.
Good luck!
All Strategies Are Good; If Managed Properly!
~Richard Nasr
BWA: Managing a Winner With a Structure-Based Trailing StopNYSE:BWA remains one of the open winners in the Sniper Alpha portfolio.
The position is still being held, not because we are predicting another major rally, but because the current structure has not yet invalidated the trend.
Our approach from here is straightforward:
Continue holding while price respects the trailing-stop structure
Watch the minor resistance area near $66
If price breaks above it and establishes a new higher low, the trailing stop can be raised again
Exit only when price confirms that the structure has weakened
The objective is not to sell at the exact top. It is to protect accumulated gains while still giving the trend enough room to continue.
A strong entry can create a winner, but disciplined trade management determines how much of that winner we keep.
Sniper Alpha Framework:
Follow the structure. Raise protection gradually. Let price decide when the trade is finished.
For educational and research purposes only. Not financial advice.
JPMorgan Just Proved Why It's Still the King of Wall StreetJPMorgan turned in another standout quarter, beating expectations across the board
Net revenue climbed 28% year over year to $57.3 billion, topping estimates by $6.7 billion
Noninterest income:$31.8 billion, up 47%, helped by a one time $4.6 billion gain from its Visa investment also Net interest income (NII) is $25.5 billion, up 10%
Net income reached $21.2 billion, up 41% from a year ago
Adjusted EPS came in at $6.14, beating estimates by $0.34
📈 Trading delivers a record quarter
JPMorgan's equity trading business had its best quarter ever, generating $6.0 billion in revenue, up 86% from last year and ahead of even the most optimistic analyst forecasts. Total trading revenue hit a record $12.1 billion, up 35%. Market volatility that followed the Iran conflict, along with sharp moves across global markets including South Korea, created ideal conditions for the bank's trading desks
💳 A major boost from Visa
A long held investment in Visa added $4.6 billion in gains, while other equity investments contributed another $1.0 billion. Reported EPS reached $7.70, although roughly $1.56 came from one time gains. Even without those gains, JPMorgan still produced an impressive 23% return on tangible equity, showing the core business remains exceptionally profitable
🚀 Investment banking regains momentum
Investment banking fees rose 30% to $3.3 billion, helped by the blockbuster SpaceX IPO, heavy index rebalancing activity, and strong demand for AI-related financing. M&A advisory revenue increased 20%, although that was slightly below analyst expectations of 27%. CFO Jeremy Barnum described the business environment as "dynamic and interesting" across multiple areas
🏦 Outlook improves
Management raised its full year net interest income forecast to approximately $105.5 billion, up from $103 billion, reflecting the benefit of higher interest rates lasting longer than previously expected.
Consumer credit also remained healthier than expected. The projected card net charge off rate improved to around 3.2%, down from 3.4%
💸 Higher spending comes with higher activity
JPMorgan increased its full year expense guidance to about $107.5 billion, compared with the previous $105 billion forecast. Management said the higher costs reflect increased business activity rather than operational issues, as stronger client demand required additional investment
💰 More cash for shareholders
The bank raised its quarterly dividend by 10% to $1.65 per share and approved a new $50 billion share repurchase program. Its CET1 capital ratio remained strong at 14.1%. With CEO Jamie Dimon previously estimating roughly $40 billion in excess capital, JPMorgan remains well positioned to continue rewarding shareholders while preparing for future Basel III capital requirements
CEO Jamie Dimon: "These results were the product of a particularly favorable environment with an elevated level of market activity, as well as rigorous execution, years of consistent investment, and thoughtful capital deployment"
This was another exceptional quarter for JPMorgan.. Every major business posted record results, and management's updated guidance suggests net interest income has shifted from being a headwind to becoming another source of growth. While the one time Visa gain boosted headline numbers, the underlying business also showed impressive strength, benefiting from active markets, improving investment banking conditions, and higher interest rates.
SpaceX: More Pain Ahead, or the Traditional IPO Trajectory?
SPCX is down 2.2% today to $136, sitting below its $150 IPO opening price and giving back the entire post-listing rally that took it to an all-time high of $225 just weeks ago. Price failed to reclaim the $160-180 midrange and has broken the stock's opening-low zone, with the next visible support levels sitting at $125 and then $100.
This isn't unusual for a mega-IPO , it's structural. Only around 5% of SpaceX's shares are currently floating. The rest unlock in stages: 20% after Q2 earnings (late July/August), 7% employee tranches every couple weeks through October, and a larger 28% release after Q3 earnings. Every one of those dates is a real supply event, and markets tend to price some of that pressure in before it even hits.
Palantir and Rocket Lab both ran the same script after their own debuts ; an early hype spike, a brutal multi-month drawdown as lockups and valuation reality collided, then a real base before any sustained move higher. The first chart rarely tells you where a stock actually settles.
Levels to watch: holding above $125 keeps this a normal post-IPO cooldown. A break below opens $100 as the next liquidity pool. Reclaiming $150+ would be the first real sign buyers are stepping back in.
Follow for updates , hope you liked today’s analysis
BULL | Continued stock growth- Timeframe: Weekly
- Trade type: Buy stop order
- Price: 7.53
- Take Profit: Open
- Stop Loss: 6.94 (-7.90 %)
Idea: Long on a breakout above last week's high - bullish momentum continuation.
Entry: Buy stop above last week’s high.
Stop-loss: Below the low of the same candle.
If the weekly candle closes below this level, the trade is invalidated.
Take Profit: Trailing stop following the lows of new weekly candles.
SNPS | Continued stock growth- Timeframe: Weekly
- Trade type: Buy stop order
- Price: 479.80
- Take Profit: Open
- Stop Loss: 438.55 (-8.60 %)
Idea: Long on a breakout above last week's high - bullish momentum continuation.
Entry: Buy stop above last week’s high.
Stop-loss: Below the low of the same candle.
If the weekly candle closes below this level, the trade is invalidated.
Take Profit: Trailing stop following the lows of new weekly candles.
NFLX Bearish Wedge Breakdown Setup | 1H Analysis.Netflix (NFLX) is trading within a contracting wedge while facing repeated rejection from the highlighted resistance zone. The lower highs and weakening bullish momentum suggest sellers remain in control.
A confirmed break below the wedge support could trigger a continuation of the bearish move toward the projected support levels.
Key Levels:
* 🔴 Resistance: 74.80 – 75.80
* 🟦 1st Support: 70.00
* 🟦 2nd Support: 66.00
* 📉 Bias: Bearish while below resistance.
NAK: Macro ABC Correction Setup Points to Major Downside TargetLooking at the overarching structure of Northern Dynasty Minerals (NAK), it is becoming difficult to ignore the dominant macro ABC bearish corrective sequence playing out. The multi-year descending trendline originating from the structure's highest point has acted as perfect overhead resistance, capping the rally attempt precisely at point B. As long as this crucial pivot point holds, the technical bias remains overwhelmingly skewed toward the downside, aligning perfectly with a high-stakes fundamental environment. The company's entire valuation hinges on the Pebble Project, and with oral arguments in the federal lawsuit to overturn the EPA's veto concluded on June 25, 2026, the case is officially ripe for a decision. A final ruling against the company would demolish the fundamental thesis and trigger the technical completion of this pattern.
Zooming into the daily price action, the internal rally that formed the "BC" leg was captured within a clear consolidation range before collapsing back through the key breaker block. The failure to reclaim this breaker block as support and the subsequent breakdown below it signal that intermediate buying pressure is completely exhausted, giving way to heavy distribution. This technical weakness mirrors the underlying financial strain; as a pre-revenue exploration company, NAK’s April 2026 annual filings included a critical "going concern" warning from its auditors. Sustaining this massive litigation is incredibly expensive, and without operational cash flow, any prolonged delay in the court's ruling will likely force aggressive share dilution, putting further organic downward pressure on the stock.
This combination of technical rejection and fundamental fragility sets the stage for a dramatic trend-completion leg down to target C. The Department of Justice's active defense of the EPA's veto earlier this year has already demonstrated the market’s extreme sensitivity to adverse regulatory news, previously triggering a massive single-day plunge. If the federal district court rules against the company in the near term, there is virtually no fundamental safety net to prevent a complete capitulation. The chart is signaling a full downward flush toward the projected target, marking the ultimate technical and fundamental resolution of this multi-year saga.
PayPal's $53B Buyout: A Global Fintech AwakeningStripe and Advent International just disrupted the financial world. They offered over $53 billion to acquire PayPal. This bold proposal values PayPal at $60.50 per share. It represents a massive 28% premium over recent market closures. Macroeconomic indicators frame this historic bid. High inflation and shifting interest rates squeeze legacy payment processors. Despite the premium, Goldman Sachs maintains a cautious outlook. They recently raised their price target for PayPal to $48. However, Goldman keeps a "Sell" rating. Markets demand profitability and resilience. This proposed mega-merger highlights rapid consolidation in global economics. Private equity and agile fintechs now dictate market momentum.
Geopolitics and Geostrategy
Global financial infrastructure is a prime geopolitical battleground. A Stripe-PayPal merger would create an undisputed Western payments titan. This geostrategic move counters the dominance of Asian networks like Alipay. Regulators across multiple continents will scrutinize this $53 billion transaction. Anti-monopoly laws will test international alliances. Cross-border capital flows determine national security parameters. Controlling this vast transaction network grants immense geopolitical leverage. Governments rely on digital payment arteries to enforce economic sanctions. Thus, this buyout carries severe strategic implications for global financial sovereignty.
Industry Trends and Business Models
The digital payments sector faces rapid evolution. Industry trends heavily favor embedded finance and unified commerce platforms. PayPal struggles against younger, more agile competitors. The proposed business model involves Stripe and Advent sharing equal ownership. This 50/50 split blends private equity capital with aggressive fintech innovation. It transforms traditional transaction fee models. The new entity would dominate both online checkout and backend merchant acquiring. Diversified revenue streams now mandate cryptocurrency integration and dynamic checkout experiences. Stagnant business models will perish in this hyper-competitive ecosystem.
Management, Leadership, and Company Culture
PayPal’s management faces a defining leadership crisis. New executives must navigate a fierce turnaround strategy. They must evaluate this $53 billion lifeline objectively. Rejecting the offer requires flawless execution of internal cost-saving plans. Accepting it demands a massive cultural shift. Company culture at PayPal must pivot toward rapid innovation. Stripe’s aggressive, builder-centric ethos contrasts sharply with PayPal’s legacy corporate structure. True leadership requires making ruthless decisions under immense Wall Street pressure. The boardroom must prioritize long-term survival over short-term pride.
Technology, High-Tech, and Cybersecurity
A combined Stripe-PayPal entity would control immense technological power. High-tech integration demands flawless execution. The companies must merge distinct cloud infrastructures and API architectures. Cybersecurity remains the paramount concern. Processing trillions of dollars attracts sophisticated state-sponsored hackers. The unified network must deploy zero-trust security frameworks. Advanced artificial intelligence will detect fraud anomalies instantly. Machine learning algorithms optimize transaction approval rates. Superior technology dictates market share in modern finance. This merger would set a new global benchmark for financial cybersecurity.
Science, Patent Analysis, and Pharmaceutical Industry
Digital finance increasingly intersects with hard science. Patent analysis reveals intense competition over cryptographic tokenization. These distinct patents build the foundation for future commerce. The pharmaceutical industry directly benefits from these payment innovations. Secure, instant cross-border transactions streamline global drug supply chains. Pharmaceutical companies manage complex intellectual property purchases utilizing encrypted payment rails. Furthermore, advanced data analytics trace sensitive medical transactions securely. This synergy between high-tech finance and life sciences accelerates global healthcare delivery.
BEN - Resistance Break and 50 SMA Support Retest💡 Swing setup idea
50 SMA support retest
🔎 Analysis summary:
The stock broke above resistance and came back to retest the 50 SMA as support. Buyers are also starting to step in, which keeps this setup constructive.
👀 Levels to watch:
Entry trigger: Break above $32.35
Target: $34.92
Stop: Under the support / 50 SMA
💬 What do you think about this setup? Let me know in the comments! 👇
Good luck!
⚠️ Note: This is for educational purposes only and is not financial advice.
$KMB - Darvas Box Consolidation & 50 SMA Breakout on High Volume💡 Swing setup idea
Bullish breakout
🔎 Analysis summary:
The stock is consolidating and forming a Darvas box pattern. It successfully crossed the 50 SMA with high volume, showing strong relative strength while the broader market is trending down.
🔔 Friendly reminder: The S&P 500 is currently trending down, so please keep the broader market weakness in mind before entering any new trades.
👀 Levels to watch:
Entry trigger: Break above $100.82
Target: $109.44
Stop: Break back into the box
💬 What do you think of this setup? Let me know in the comments! 👇
Good luck!
⚠️ Note: This is for educational purposes only and is not financial advice.