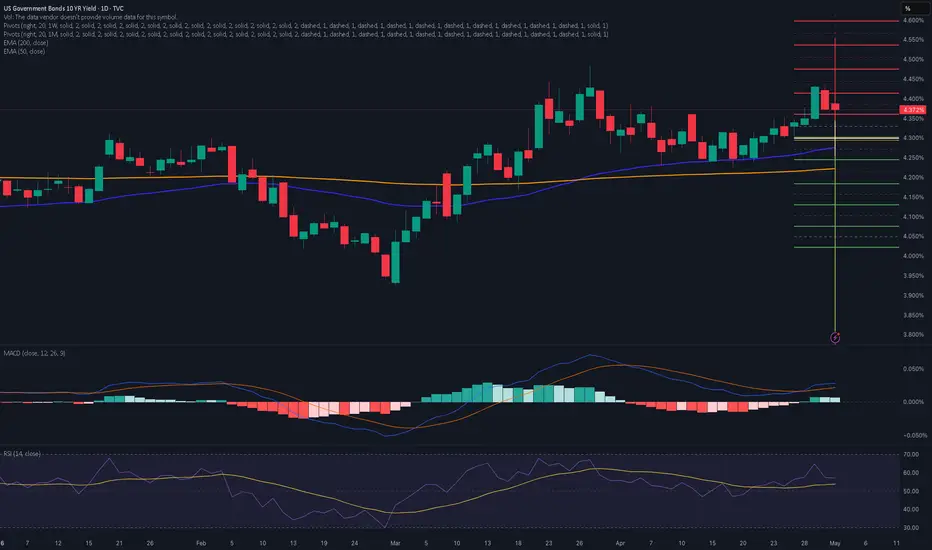
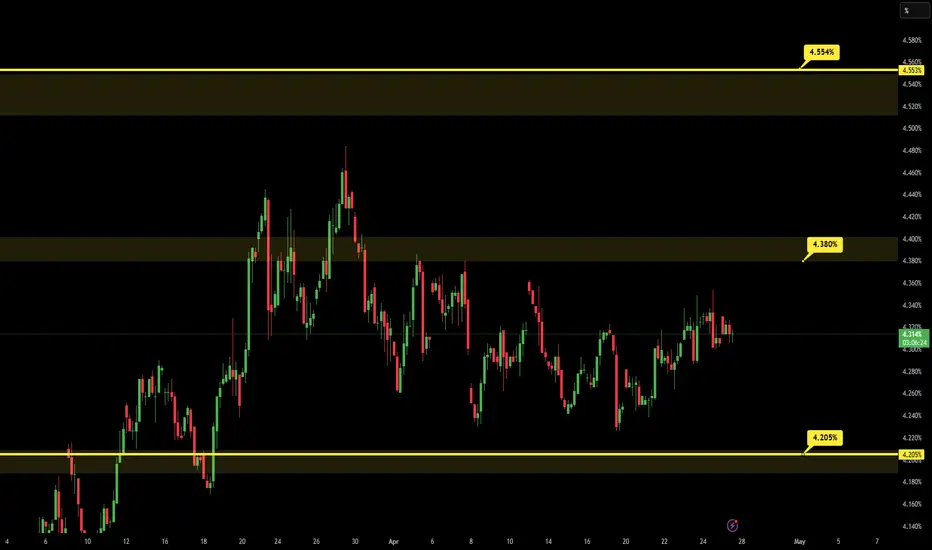
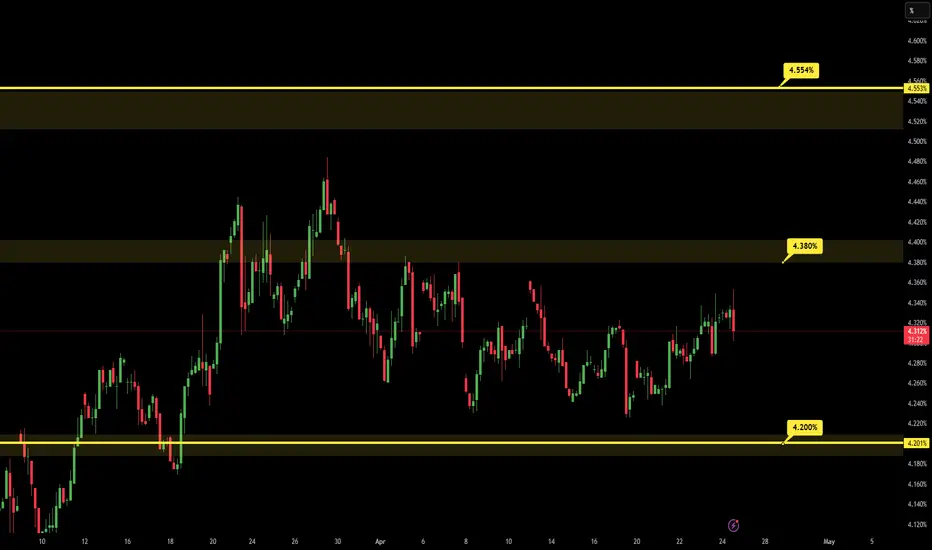
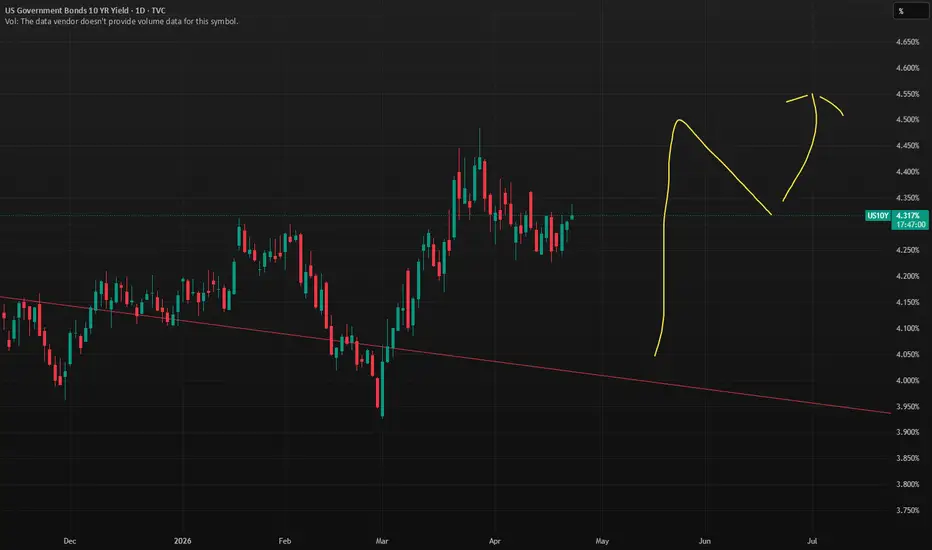
US 10Y TREASURY: Relaxation continues?The 10-year U.S. Treasury yields were traded modestly lower during the week as investors focused on key macroeconomic data and ongoing geopolitical developments in the Middle East. Bond markets remained highly sensitive to expectations surrounding Federal Reserve policy, particularly ahead of the latest U.S. labor market reports and upcoming inflation figures next week. Stronger than expected payroll data reinforced the view that the Fed could keep interest rates elevated for longer, although softer wage growth helped ease immediate inflation concerns.
Investors are now turning attention toward next week’s inflation data, which could become the next major catalyst for Treasury markets. As per 10Y charts, yields double-topped at the level of 4,46%, from where a short reversal started. The lowest weekly level reached was 4,31%, however, the week was closed at 4,36%. The level of 4,3% is currently pending a clear testing, which might occur in the week ahead. On a longer time-scale easing of yields might continue till 4,2% in the future period.
 Long
Long

Short 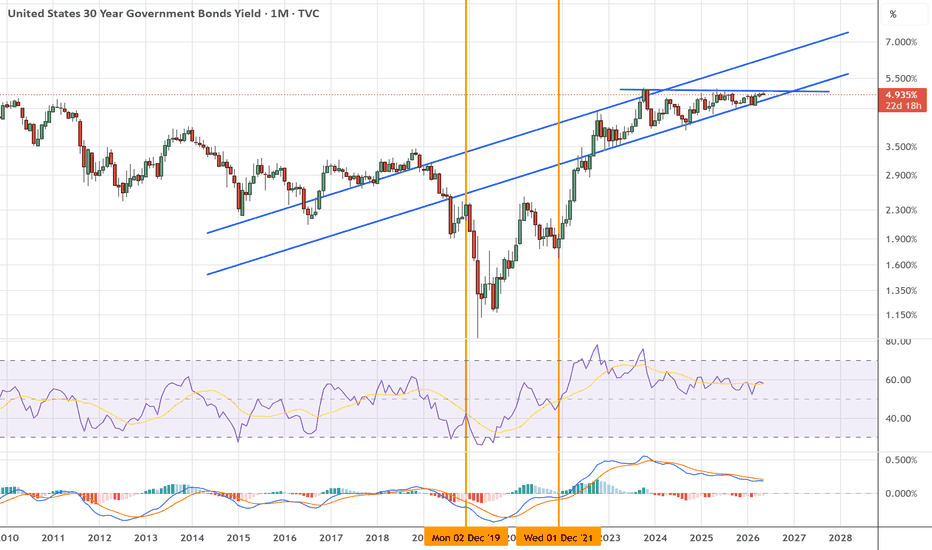
UNITED STATES 10 YEAR TREASURY BONDYIELD. US10YThe united states 10year treasury yield closed Friday at 4.372% in the fx window. The monthly chart shows enormous upswing potential based on the breakout of the monthly supply roof ,on technical i need a pull back as retest candle to the broken supply roof to go long and target 5.2%
the flip side will be a break and close of the current ascending trendline and the target will be 3.3%-3.4% zone .
the structure is showing me a bullish potential and it has a lot to do with the dollar index performance .
what is US10Y???
The 10-year Treasury note is a debt security issued by the U.S. government with a 10-year maturity, paying fixed interest semiannually. US10Y specifically denotes its current yield—the effective annual return if bought today—which fluctuates based on market demand.
This yield serves as a "risk-free" rate benchmark, influencing mortgage rates, corporate bonds, and stock valuations. Rising yields often signal economic growth or inflation expectations, while falling yields may indicate recession fear.
US10Y, the yield on the 10-year U.S. Treasury note, moves inversely to its price and is heavily influenced by prevailing interest rates set by the Federal Reserve and market expectations.
Fed Policy Impact
When the Fed raises short-term rates (like the federal funds rate) to combat inflation, new Treasuries offer higher coupons, causing existing bond prices to fall and US10Y yields to rise. Rate cuts have the opposite effect: lower yields on new issues boost demand for existing bonds, pushing US10Y down.
if investors anticipate prolonged high rates, US10Y climbs as a risk premium builds in. Inflation plays a role too—higher inflation erodes fixed payments, demanding elevated yields
Treasury notes and bonds are U.S. government debt securities backed by the full faith and credit of the U.S. government. Their yields represent the effective annual return investors earn based on current market prices.
(1)Treasury Notes
Treasury notes (T-notes) have maturities from 2 to 10 years and pay semiannual interest at a fixed coupon rate set at auction. Yield is the total return if held to maturity, rising when prices fall due to higher market rates.
(2)Treasury Bonds
Treasury bonds (T-bonds) mature in 20 or 30 years, also paying interest every six months. They typically offer higher yields than notes to compensate for longer-term interest rate and inflation risks.
(3)Yield Mechanics
Yield to maturity accounts for interest payments, price paid, and face value at maturity; it moves inversely to price—higher yields when bond prices drop amid rising rates. Current yield is simply annual interest divided by current price. Longer maturities generally yield more, except in inverted yield curves.
(4)A coupon is the periodic interest payment made by a bond issuer to bondholders, typically expressed as a fixed annual percentage of the bond's face (par) value. It's set at issuance and paid semiannually until maturity.
How It Works
For a $1,000 bond with a 5% coupon rate, the annual coupon payment totals $50—often split into two $25 payments every six months. This differs from yield, which fluctuates with market prices; the coupon rate remains fixed.
Relation to Treasuries
In U.S. Treasury notes and bonds (like the US10Y), coupons provide steady income alongside principal repayment at maturity, making them low-risk investments. Zero-coupon bonds pay no coupons but sell at a discount for equivalent yield.
Coupon rate and yield to maturity (YTM) both relate to bond returns but measure different aspects.
Coupon Rate
This is the fixed annual interest rate stated on the bond, expressed as a percentage of its face (par) value, paid periodically (often semiannually). It never changes over the bond's life; for a $1,000 bond with a 5% coupon, you get $50 yearly regardless of market price.
Yield to Maturity
YTM estimates the total annualized return if held to maturity, factoring in coupon payments, time to maturity, face value repayment, and current market price. It equals the coupon rate only when bought , otherwise, it adjusts for discounts (higher YTM) or premiums (lower YTM).
(5)Zero-coupon bonds are debt securities that pay no periodic interest (coupons) during their term. Investors buy them at a deep discount to face value and receive the full par amount at maturity, with the difference representing compounded interest.
How They Work
Unlike regular coupon bonds, zeros provide a single lump-sum payment at maturity, often 10+ years out; for example, a $10,000 face value bond might cost $3,500 today. The yield comes from price appreciation, making them sensitive to interest rate changes.
(6)Treasury STRIPS (Separate Trading of Registered Interest and Principal Securities) are common zeros created by stripping coupons from T-notes or bonds. They're ideal for long-term goals like retirement due to predictable payouts and low risk.
HOW YIELD AFFECT STOCK MARKET.
Rising bond yields, like US10Y, often pressure stock markets by increasing competition from "risk-free" fixed-income returns and raising corporate borrowing costs.
Valuation Impact
Higher yields discount future corporate earnings more heavily in models like DCF, lowering present values and stock prices—especially for growth stocks reliant on distant cash flows.
Opportunity Cost
Bonds become more attractive than equities for income, prompting investors to shift funds and sell stocks.
Economic Effects
Elevated yields signal tighter credit, slowing growth, squeezing profit margins, and hurting cyclical sectors.
Exceptions
If yields rise with strong growth (not inflation fears), stocks can rally; rapid yield spikes historically challenge equities
this is just for educational purposes only,pls do your own.
#us10y #us10 #bonds #yield .#bond yield.
Long 
Long 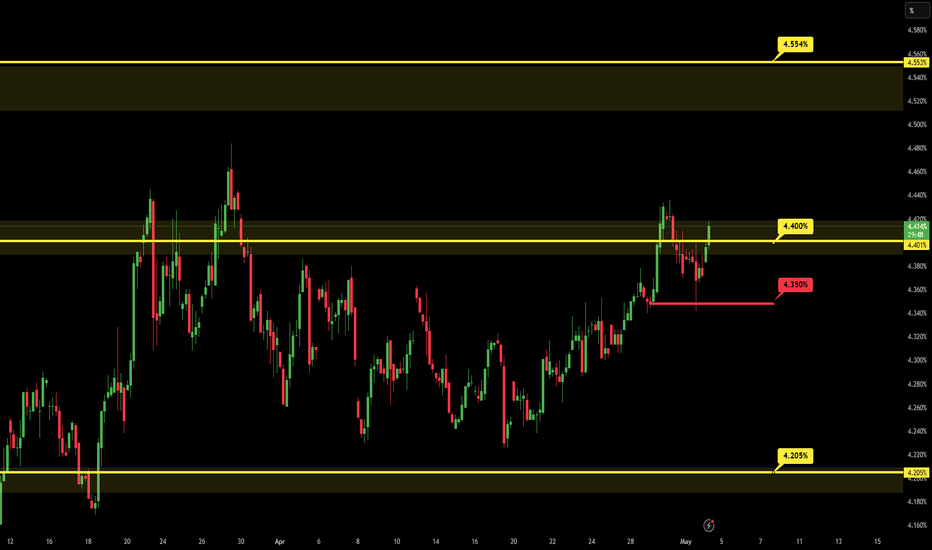
US 10Y TREASURY: Double topped?U.S. 10-year Treasury yields moved higher, approaching the 4.4% area, as markets reacted to a combination of resilient macro data and rising inflation pressures. Solid GDP growth around 2% and persistent price pressures, amplified by higher energy costs, have reinforced expectations that interest rates may stay elevated for longer. The Fed held its regular meeting, with a decision to keep interest rates unchanged, as was widely expected. Overall, the bond market reflects a macro environment where strong economic activity and geopolitically driven energy shocks are keeping inflation risks elevated, limiting the scope for lower yields in the near term.
The nervousness on the market was at its peak prior to the FOMC meeting yields shortly jumped toward the 4,43% but eased on Friday, closing the week at 4,37%. The 10Y charts are currently showing a formation called double-top, which indicates that yields might revert a bit in the coming period. The next level to test might be around 4,3%. It should be also considered that the week ahead brings NFP and Unemployment rate for March, in which sense, some increased volatility might be again expected on Friday.
Long 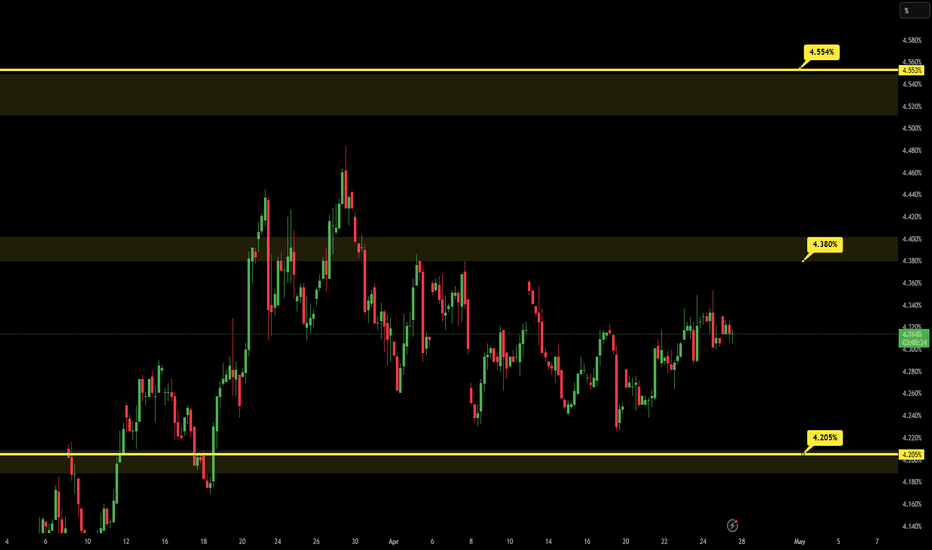
US 10Y TREASURY: Volatility ahead of the FOMCThe 10Y U.S. Treasury yields traded in a volatile manner this week as markets reacted to shifting expectations around Middle East developments and U.S.–Iran ceasefire dynamics. Early optimism that geopolitical tensions were easing briefly pushed yields lower, as oil prices declined and inflation fears softened. However, that move reversed as ceasefire optimism faded and markets reassessed the persistence of supply risks through the Strait of Hormuz, supporting a rebound in yields.
At the same time, macro data showing resilient inflation pressures and ongoing fiscal concerns kept the broader yield backdrop elevated. The 10Y yields were moving between 4,24% up to 4,35%. They closed the week at 4,31%. For the week ahead, the volatility might continue. The most important event for the week ahead is the FOMC meeting, which will be held on Wednesday. On this day, it could be expected that the market will be at a peak of nervousness. On the other hand, geopolitics and energy-driven inflation risks will continue to be the dominant drivers of direction in the Treasury market also in the coming period. In this sense, levels below the 4,4% could be tested for one more time. Also there is the same probability for yields to ease down toward the 4,2% supporting levels.
Long 
 Long
Long
Long 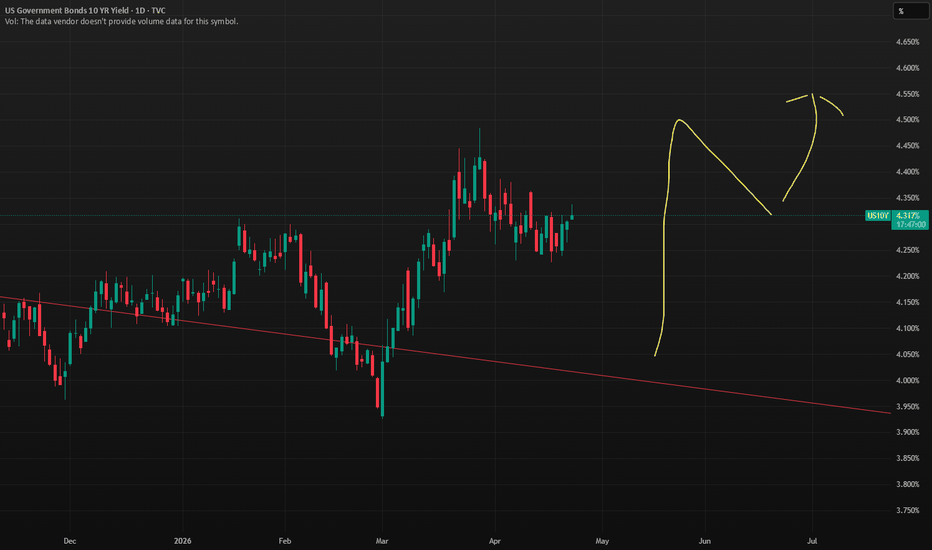
Long 
 Long
Long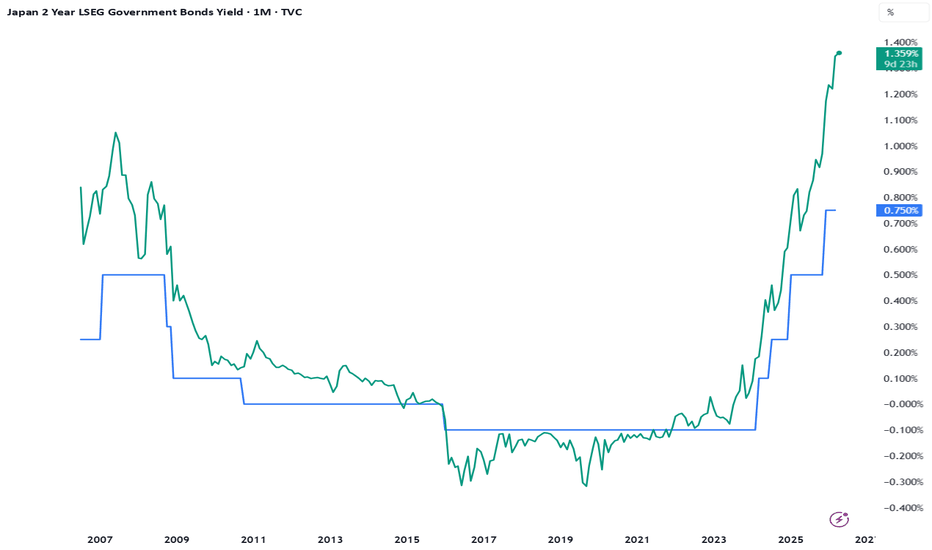
Long 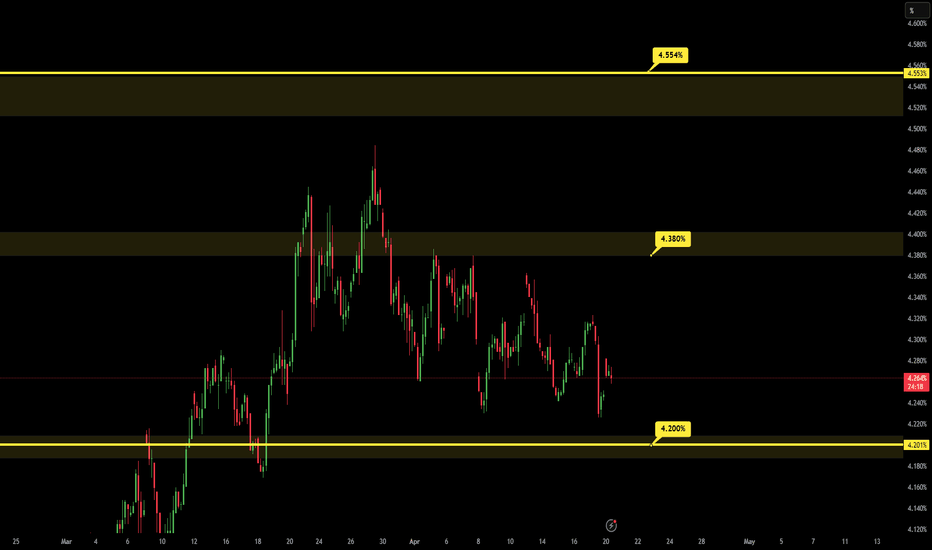
US 10Y TREASURY: Further easing, but risks holdU.S. 10Y Treasury yields held relatively steady, as markets balanced a shifting macro backdrop with ongoing geopolitical developments in the Middle East. Investors remained cautious, with yields stabilizing after recent volatility driven by energy price swings and changing expectations around inflation and monetary policy. The weekly trading range was between 4,36% down to 4,22%, with a weekly close at 4,24%.
From a macro perspective, the bond market continues to reflect uncertainty around inflation and Federal Reserve policy, particularly as softer economic data contrasts with persistent risks from higher energy costs. While easing inflation pressures would typically support lower yields, concerns that supply shocks could reignite price pressures have kept investors from aggressively bidding Treasuries. Geopolitically, signs of de-escalation in the Middle East, particularly around the Strait of Hormuz, have helped calm markets, reducing immediate safe-haven demand and limiting sharp moves lower in yields. At the same time, the situation remains fragile, with ongoing negotiations and intermittent tensions preventing a more decisive trend in the bond market.
For the week ahead, we could expect for yields to test the 4,2% support line. Whether there will be higher demand for Treasury bonds in the week ahead, remains questionable at this moment. Also a modest move toward the upside is also possible. Nothing significant should be expected except in the case of negative news about the Middle East conflict. Overall, further stabilization in yields is expected, however, there are still risks coming from geopolitics.
Long 
US 10Y TREASURY: Lacks clear directionThe 10-year U.S. Treasury yield remained volatile during the week, reflecting continued sensitivity to inflation and potential impact of increased oil prices. Recent economic data, including jobless claims, GDP revisions, and inflation prints, showed a mixed but generally softening growth backdrop, reinforcing expectations that U.S. economic momentum is cooling without a sharp downturn. Inflation indicators suggest price pressures are moderating but not fully anchored, with energy-related components keeping headline risks in focus. Markets continue to price a “higher for longer” policy environment from the Federal Reserve.
Bond market pricing continues to be volatile, with the 10-year yields moving between 4,37%, down to 4,23%. Yields closed the week at 4,31%. Currently, yields are actually moving without a clear direction. This is exactly the reflection of uncertainties that are surrounding the market environment. This might also continue in the future period. As long as Middle East tensions last, any news will be reflected also in bond yields, due to its potential impact on increased inflation and at its last instance, to Fed's rate decision. Based on current charts, some further relaxation in bond yields is probable, where 4,2% could be tested. A move toward the upside should not be neglected as a probability under all given external developments.