Canada 5Y Yield — A Bullish Bet Beyond the BarrierCanada 5-Year Government Bond Yield is sitting close to a notable resistance region, but I’m maintaining a bullish perspective and looking for price to push into uncharted territory. 📈
At first glance, the current location may encourage sellers to step in, but my trade idea is built on the information coming from my own methodology rather than simply reacting to the resistance level. The structure continues to provide enough evidence for me to favor the upside scenario.
If demand remains activ
Government bonds
Chart of the Week: US 10-Year Treasury YieldBenchmark US 10-year Treasury yields pushed towards 5% on Friday, their highest level since October 2023, after US consumer price inflation accelerated on expectations the Fed will raise interest rates next week.
On the monthly chart, we've been tracking a long-term triangle. Measuring the widest part of the pattern (3.25% to 5.02%) from the breakout point around 4.45% gives us an upside target of approximately 6.20%.
What's notable is that when we zoom out further, the 38.2% retracement of the
Yields Surging in Tandem: Extended Momentum Test Key CeilingReality Check
We’ve been bullish on Yield. Many posts on that. However, our earlier expectation for a temporary pause or consolidation across treasury yields simply did not play out. Instead of cooling off, upside momentum accelerated sharply, blowing straight through intermediate levels much faster than anticipated.
However, looking at the daily timeframes now, the technical posture has shifted from a healthy trend expansion into heavily stretched territory. Both the 10 yr and 2 yr yields are
US 10-Year Notes Near 19-Year Highs at 5%The benchmark 10-year US Treasury note is approaching a major milestone, and this is the type of move that can have consequences across the macro landscape, from USD to stocks to commodities.
The 5% level is important as this is what establishes the current high, and it traded for just one morning on October 23rd of 2023. At the time, there was a bit of pain starting to show in stocks as the rally that started a year earlier was pulling back, and the big fear was an oncoming maturity wall of U
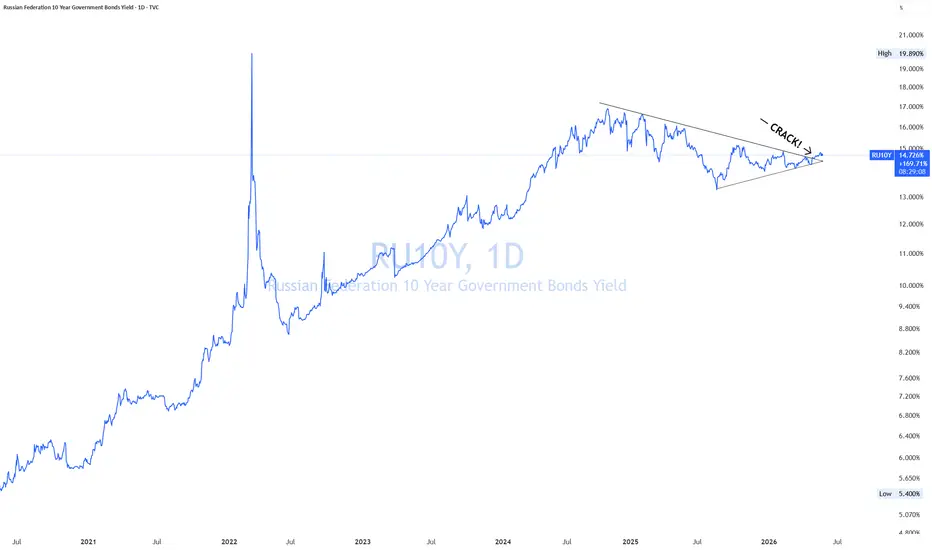
Russia In Trouble! Dutch Disease!Russia is walking into a wartime version of Dutch disease:
Energy cash flows + defense spending temporarily mask weakening civilian productivity and diversification.
High yields despite controls are the tell.
Resource dependence feels strong… until the economy forgets how to do anything else.
High commodity revenues + state-directed spending + defense concentration can temporarily prop up nominal growth while quietly hollowing out productive diversification.
Dutch disease is when a coun
US30 Y Bonds — Bullish Continuation SetupUS30 Y Bonds are showing a constructive bullish structure, with buying interest supporting the upside momentum. The current price action suggests that buyers are maintaining control and the market has the potential to continue higher if the bullish structure remains intact.
From a technical perspective, the setup is based on continued demand and positive market structure, with buyers stepping in around key areas and preventing a deeper downside correction. A sustained move above the recent resi
USA/JAPAN/FRANCE, the public debt challengeThe rise in long-term bond yields is currently a major fundamental challenge in the Western world. The accumulation of budget deficits each year is fueling public debt, which now exceeds 100% of GDP in most major Western economies.
This public debt generates an annual interest burden that takes up an increasingly large share of government spending, thereby reducing the financing available for the real economy.
In the United States, for example, the annual debt service burden related to interest
Bessent's Refinance is Failing AlreadyThe Treasury announced today that they will be buying back $6 billion worth of 10 and 20 year treasury bonds today, with the expectation that this would pressure those yields down.
Well....it seems to be doing the opposite.....
Most likely due to the markets smelling blood in the water and understanding that if the treasury has to do this, liquidity is really drying up.
So what are they going to do?
Probably more of the same.
Expect major dollar devaluation and yield curve control.
Bond yield
France/Germany yield spread on red alertAs France’s 10-year government bond yield has reached the same level as Italy’s 10-year government bond yield, the question of the trajectory of French public debt is becoming increasingly important. This issue is all the more significant because France is the second-largest economy in the Eurozone and a major global power.
Among the worrying factors at present are a budget deficit that remains well above the European 3% target, an interest burden that accounts for more than 13% of the governme
Japanese Long-Term Rates: Is It Really Dangerous?The marked upward trend in Western bond yields since 2022 has become a major fundamental concern for markets. Oil prices, inflation, budget deficits and public debt are all factors pushing long-term yields higher, particularly in Europe, the United States and Japan.
For the Japanese economy, the situation could become complicated because public debt represents more than 240% of GDP, while interest payments are taking up an increasingly large share of the government’s annual budget.
The chart be
US 10Y TREASURY YIELD | WEEKLY STRUCTURAL ANALYSIS | 06-SEP-2026INTRODUCTION
US 10Y Treasury Yield continues operating within a Range Structure, with Recovery Participation developing above the Structural Pivot.
The recovery remains inside the broader range framework.
STRUCTURE
Structure: Range Structure
Structural Phase: Recovery
Behaviour: Recovery Participation
MARKET CONTEXT
The yield is currently within the Resistance Zone, while remaining above the Structural Pivot.
The Behavioural Pivot is the immediate reference for continuation.
KEY LEVELS
R
US 30-Year Yield: Critical Juncture Ahead of Inflation DatLast week's push to new highs (~5.30%) has brought us right up against a major confluence zone: the 61.8% retracement of the 1995–2020 decline at 5.34%, sitting almost on top of the 2007 high at 5.40%.
Weekly/daily RSI is showing divergence here, pointing to fading upside momentum — so we're allowing for some consolidation or a pullback near-term.
The bigger picture stays constructive: the weekly Ichimoku cloud has supported this market since 2020 (Chikou span above price, price above the clou
BOND YIELDS ↑ DOES GOLD HAVE TO FALL?XAUUSD: Rising Bond Yields Do Not Necessarily Mean Gold Will Fall
Traders are often familiar with a simple formula:
Rising bond yields → Gold falls.
Falling bond yields → Gold rises.
Because bonds pay interest, while gold does not.
But the market is not always that simple.
What Are Yields?
Let’s use a simple example.
You buy a house for approximately $670,000 and rent it out for approximately $1,025 per month.
In one year, the income you receive is:
$1,025 × 12 months = $12,300 per year
US 10 Yr: Big Picture Bull Versus Short Term FatigWhile headline noise says rates will keep rocketing, the charts reveal two very different stories depending on your view. The monthly chart shows rock solid macro power, while the weekly chart flashes signs of exhaustion.
Monthly View: Iron Trendline Remains Unbroken
Take one step back to the monthly timeframe and the primary direction is unmistakable.
The white diagonal trendline rising from 2023 acts as a steel floor. Every single multi month dip has been bought with conviction right off tha
US 2 Yr: The Macro Dilemma Between Two TimeframesThe crowd expects rates to surge. While long duration yields climb under supply pressure, the front end tells a different story. The weekly and monthly charts show two distinct phases playing out.
Weekly Picture: Room For A Pullback
The latest rally ran straight into the upper channel line and stalled. At the same time, weekly momentum shows a clear slowdown. Relative strength failed to match earlier peaks, confirming buyer exhaustion at the ceiling.
With this rejection, the path of least resi
The 10-year Note - 6 Month Stochastic RSI at 97 and fallingThe 6-month Stochastic RSI provides a high-probability alert for a mean-reversion lower in yields. However, this is a trend exhaustion signal, not a trend reversal signal. The optimal strategy is to wait for a confirmed daily close below 4.30% to validate the downtrend.
For the "down trend in yields" to succeed, look for confirmation from the Dollar Index (DXY). A softer USD typically accompanies falling real yields.
Could this be the Pivotal Moment where Rates Fall from here?
US10Y Rising Yields on a new massive Bull CycleAt the start of this year (January 02, see chart below) we gave a bullish call on the U.S. Government Bonds 10YR Yield (US10Y), expecting a rebound on its 1M MA50 (blue trend-line) and break-out above the 3-year Triangle:
That break-out happened in April and technically this is the start of a new Bullish Leg towards the 10-year Higher Highs trend-line.
After all, the market has entered a new massive Bull Cycle following the April 2022 bullish break-out above both the 1M MA200 (orange trend
The Bond Market Is Sending a Warning🚨 A Major Structural Shift Is Happening in the Bond Market
Is the era of cheap money and ultra-low yields really over?
Financial markets have experienced no shortage of major events in recent years.
From the pandemic and the historic inflation shock to aggressive central bank tightening, geopolitical conflicts, and the explosive rise of artificial intelligence, investors have had plenty to focus on.
But one of the most important developments may currently be unfolding in a place that many mar
US10Y - Bulls Face a Major Resistance Zone!US10Y remains bullish, trading inside the ascending blue channel while continuing to respect the long-term support and resistance zones.
Price is now testing the red resistance area, where a rejection could send price back toward the blue support area.
⭕For the bearish scenario to gain more strength, price would need to break below the blue trendline and the green trigger area, providing the first major indication that momentum may be shifting from bullish to bearish. Moreover, a bearish dive
US 10 Yr Yield: The Final Squiggle and the TINA Tug of WarTake a look at the battle playing out between the 4 hour and the Daily charts on the 10 Yr Treasury.
Daily, the chart saw a sudden blast of buying energy pushing yields right up against 4.80 percent. But when you zoom in to the 4Hr timeframe, the picture tells a different story.
Right now, the 4 hour chart is painting a bearish engulfing candle after tapping that 4.80 percent mark. Yields could pull back to test support or an EMA (one of the colored moving avgs), one last quick pop to trap lat
The Bond Market Is Pricing More Than a Fed Hike
Market: TVC:US10Y U.S. 10-Year Treasury Yield
Current condition: Bullish yield breakout above 4.744%, testing the 4.78–4.80% resistance zone
The U.S. 10-year Treasury yield is back near 4.78%, breaking above a resistance area that had repeatedly stopped the market around 4.74–4.75%.
The obvious explanation is simple: the Federal Reserve has turned more hawkish.
But that is only part of the story.
If this were purely a Fed-hike trade, we would expect most of the pressure to sit at the front
US10Y Weekly Chart BreakoutTVC:US10Y
The 10-year yield is top of watch for me as some might know (and has been fora while). I Have ben bullish on yields since we were near 4.1% and this chart began to really shape up. I think this still has room as Warsh and Bessent are seemingly on the same page on the likelihood we see another hike in rates this year let alone next year if inflation remains sticky.
I still remember the early conversations in 2023-2024 about how inflation could remain sticky around this 3% area - th