• 產品
  • 社群
  • 市場
  • 經紀商
  • 更多
立即開始
  • 市場
  • /美國
  • /股票
  • /投資想法
AMZN, 10d+/7.47%上升周期 大於10天 7.47% rising cycle 7.47% more than 10 days. ================================================================================================================================================================== 此數據為機器人分析。 根據亞當理論分析歷史趨勢(20移動平均線/60移動平均線/120移動平均線/240移動平均線),估計未來 10 天的趨勢。 白線為機器人預期價格,上下橫線為止損止盈價,無財務根據,結果僅供參考。 This data is analyzed by robots. Analyze historical trends based on The Adam Theory of Markets (20 moving averages/60 moving averages/120 moving averages/240 moving averages) and estimate the trend in the next 10 days. The white line is the robot's expected price, and the upper and lower horizontal line stop loss and stop profit prices have no financial basis. The results are for reference only.
NASDAQ:AMZN看多
由Tonyder提供
APPL,10d+/20.6% 上升周期 大於10天 20.6% rising cycle 20.6% more than 10 days. ================================================================================================================================================================== 此數據為機器人分析。 根據亞當理論分析歷史趨勢(20移動平均線/60移動平均線/120移動平均線/240移動平均線),估計未來 10 天的趨勢。 白線為機器人預期價格,上下橫線為止損止盈價,無財務根據,結果僅供參考。 This data is analyzed by robots. Analyze historical trends based on The Adam Theory of Markets (20 moving averages/60 moving averages/120 moving averages/240 moving averages) and estimate the trend in the next 10 days. The white line is the robot's expected price, and the upper and lower horizontal line stop loss and stop profit prices have no financial basis. The results are for reference only.
NASDAQ:AAPL看多
由Tonyder提供
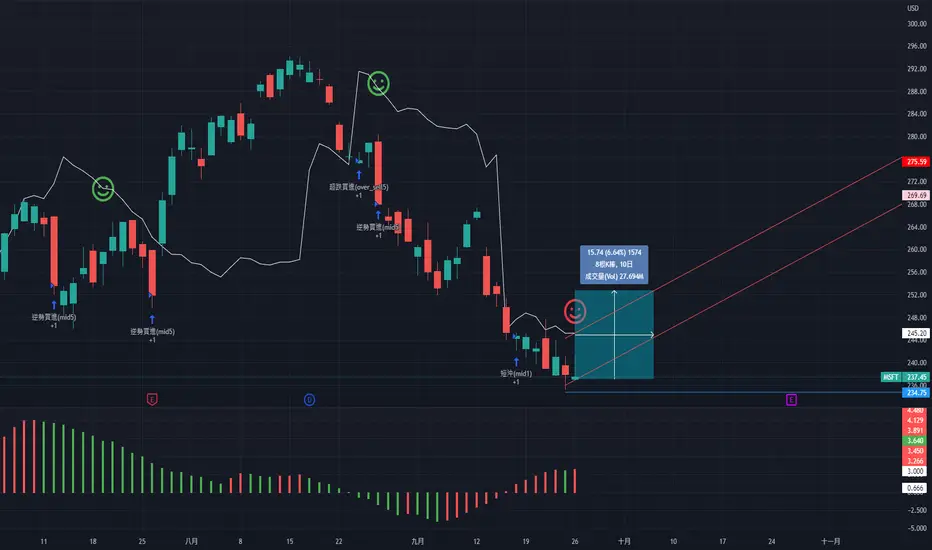
MSFT, 8d/6.64%上漲周期 8天 6.64% rising cycle 6.64% in 8 days. ================================================================================================================================================================== 此數據為機器人分析。 根據亞當理論分析歷史趨勢(20移動平均線/60移動平均線/120移動平均線/240移動平均線),估計未來 10 天的趨勢。 白線為機器人預期價格,上下橫線為止損止盈價,無財務根據,結果僅供參考。 This data is analyzed by robots. Analyze historical trends based on The Adam Theory of Markets (20 moving averages/60 moving averages/120 moving averages/240 moving averages) and estimate the trend in the next 10 days. The white line is the robot's expected price, and the upper and lower horizontal line stop loss and stop profit prices have no financial basis. The results are for reference only.
NASDAQ:MSFT看多
由Tonyder提供
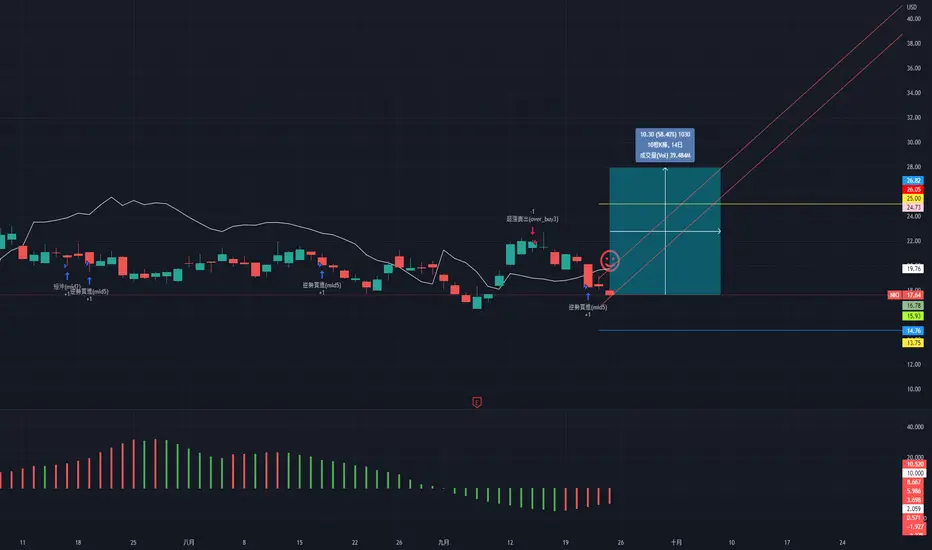
NIO, 10d+/58.4%上升周期 大於10天 58.4% rising cycle 58.4% more thna 10 days. ================================================================================================================================================================== 此數據為機器人分析。 根據亞當理論分析歷史趨勢(20移動平均線/60移動平均線/120移動平均線/240移動平均線),估計未來 10 天的趨勢。 白線為機器人預期價格,上下橫線為止損止盈價,無財務根據,結果僅供參考。 This data is analyzed by robots. Analyze historical trends based on The Adam Theory of Markets (20 moving averages/60 moving averages/120 moving averages/240 moving averages) and estimate the trend in the next 10 days. The white line is the robot's expected price, and the upper and lower horizontal line stop loss and stop profit prices have no financial basis. The results are for reference only.
NYSE:NIO看多
由Tonyder提供
SHOP, 9d/37.07%上升周期 9天 37.07% rising cycle 37.07% in 9 days. ================================================================================================================================================================== 此數據為機器人分析。 根據亞當理論分析歷史趨勢(20移動平均線/60移動平均線/120移動平均線/240移動平均線),估計未來 10 天的趨勢。 白線為機器人預期價格,上下橫線為止損止盈價,無財務根據,結果僅供參考。 This data is analyzed by robots. Analyze historical trends based on The Adam Theory of Markets (20 moving averages/60 moving averages/120 moving averages/240 moving averages) and estimate the trend in the next 10 days. The white line is the robot's expected price, and the upper and lower horizontal line stop loss and stop profit prices have no financial basis. The results are for reference only.
S看多
由Tonyder提供
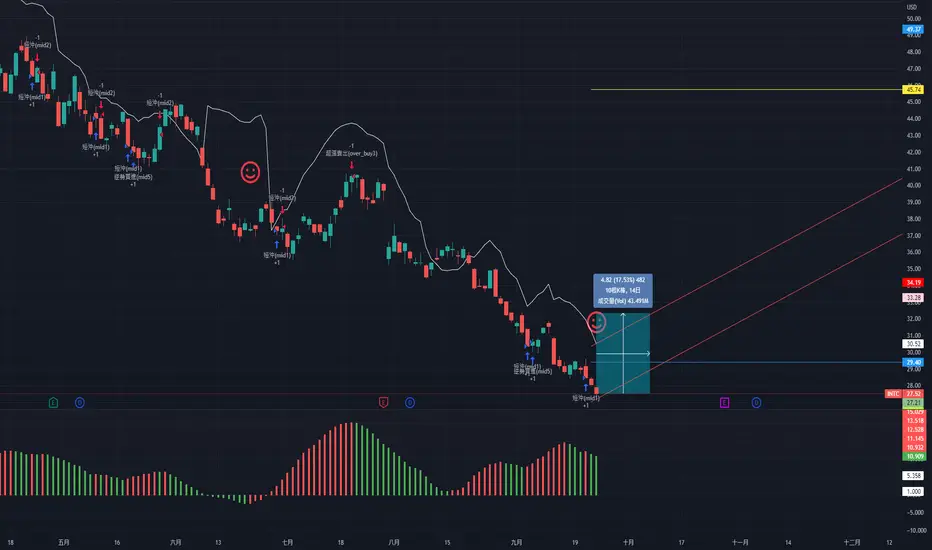
INTC, 9d/17.53%上升周期 9天17.53% rising cycle 17.53% in 9 days. ================================================================================================================================================================== 此數據為機器人分析。 根據亞當理論分析歷史趨勢(20移動平均線/60移動平均線/120移動平均線/240移動平均線),估計未來 10 天的趨勢。 白線為機器人預期價格,上下橫線為止損止盈價,無財務根據,結果僅供參考。 This data is analyzed by robots. Analyze historical trends based on The Adam Theory of Markets (20 moving averages/60 moving averages/120 moving averages/240 moving averages) and estimate the trend in the next 10 days. The white line is the robot's expected price, and the upper and lower horizontal line stop loss and stop profit prices have no financial basis. The results are for reference only.
NASDAQ:INTC看多
由Tonyder提供
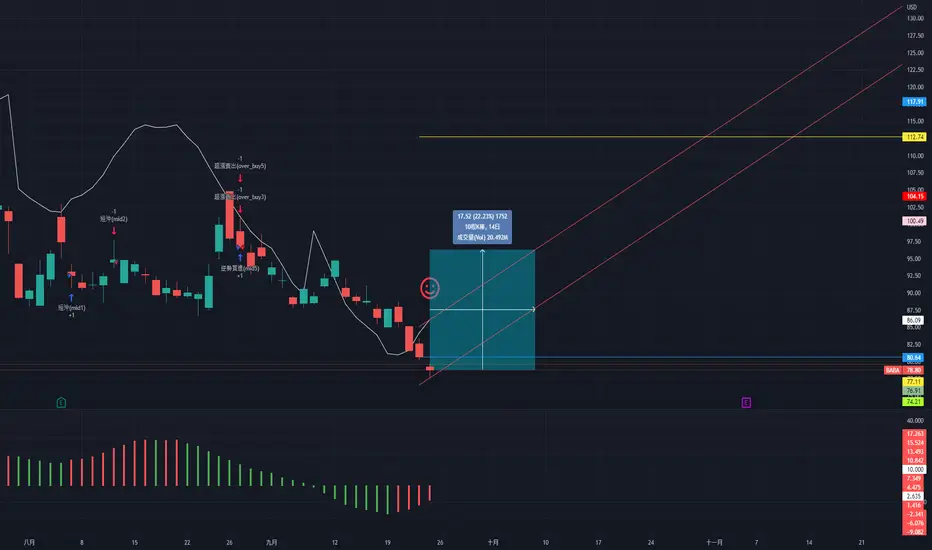
BABA, 10d+/22.23%上升周期 大於10天 22.23% rising cycle 22.23% more thna 10 days. ================================================================================================================================================================== 此數據為機器人分析。 根據亞當理論分析歷史趨勢(20移動平均線/60移動平均線/120移動平均線/240移動平均線),估計未來 10 天的趨勢。 白線為機器人預期價格,上下橫線為止損止盈價,無財務根據,結果僅供參考。 This data is analyzed by robots. Analyze historical trends based on The Adam Theory of Markets (20 moving averages/60 moving averages/120 moving averages/240 moving averages) and estimate the trend in the next 10 days. The white line is the robot's expected price, and the upper and lower horizontal line stop loss and stop profit prices have no financial basis. The results are for reference only.
NYSE:BABA看多
由Tonyder提供
11
JPM, 10d+/10.48%上漲周期 大於10天 10.48% rising cycle 10.48% more than 10 days. ================================================================================================================================================================== 此數據為機器人分析。 根據亞當理論分析歷史趨勢(20移動平均線/60移動平均線/120移動平均線/240移動平均線),估計未來 10 天的趨勢。 白線為機器人預期價格,上下橫線為止損止盈價,無財務根據,結果僅供參考。 This data is analyzed by robots. Analyze historical trends based on The Adam Theory of Markets (20 moving averages/60 moving averages/120 moving averages/240 moving averages) and estimate the trend in the next 10 days. The white line is the robot's expected price, and the upper and lower horizontal line stop loss and stop profit prices have no financial basis. The results are for reference only.
NYSE:JPM看多
由Tonyder提供
GOOGL, 10d+/16.25%上升周期 大於10天 16.25% rising cycle 16.25% more than 10 days. ================================================================================================================================================================== 此數據為機器人分析。 根據亞當理論分析歷史趨勢(20移動平均線/60移動平均線/120移動平均線/240移動平均線),估計未來 10 天的趨勢。 白線為機器人預期價格,上下橫線為止損止盈價,無財務根據,結果僅供參考。 This data is analyzed by robots. Analyze historical trends based on The Adam Theory of Markets (20 moving averages/60 moving averages/120 moving averages/240 moving averages) and estimate the trend in the next 10 days. The white line is the robot's expected price, and the upper and lower horizontal line stop loss and stop profit prices have no financial basis. The results are for reference only.
NASDAQ:GOOG看多
由Tonyder提供
FB/META, 9d/23.88%上升周期 9天 23.88% rising cycle 23.88% in 9 days. ================================================================================================================================================================== 此數據為機器人分析。 根據亞當理論分析歷史趨勢(20移動平均線/60移動平均線/120移動平均線/240移動平均線),估計未來 10 天的趨勢。 白線為機器人預期價格,上下橫線為止損止盈價,無財務根據,結果僅供參考。 This data is analyzed by robots. Analyze historical trends based on The Adam Theory of Markets (20 moving averages/60 moving averages/120 moving averages/240 moving averages) and estimate the trend in the next 10 days. The white line is the robot's expected price, and the upper and lower horizontal line stop loss and stop profit prices have no financial basis. The results are for reference only.
NASDAQ:META看多
由Tonyder提供
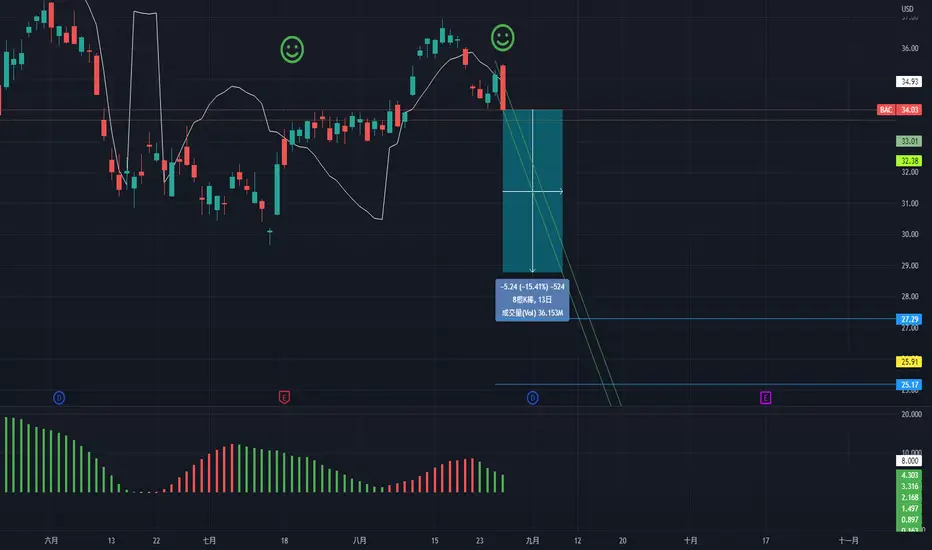
BAC, 8d/-15.41%下降週期 8天 -15.41% falling cycle -15.41% in 8 days. ================================================================================================================================================================== 此數據為機器人分析。 根據亞當理論分析歷史趨勢(20移動平均線/60移動平均線/120移動平均線/240移動平均線),估計未來 10 天的趨勢。 白線為機器人預期價格,上下橫線為止損止盈價,無財務根據,結果僅供參考。 This data is analyzed by robots. Analyze historical trends based on The Adam Theory of Markets (20 moving averages/60 moving averages/120 moving averages/240 moving averages) and estimate the trend in the next 10 days. The white line is the robot's expected price, and the upper and lower horizontal line stop loss and stop profit prices have no financial basis. The results are for reference only.
NYSE:BAC看空
由Tonyder提供
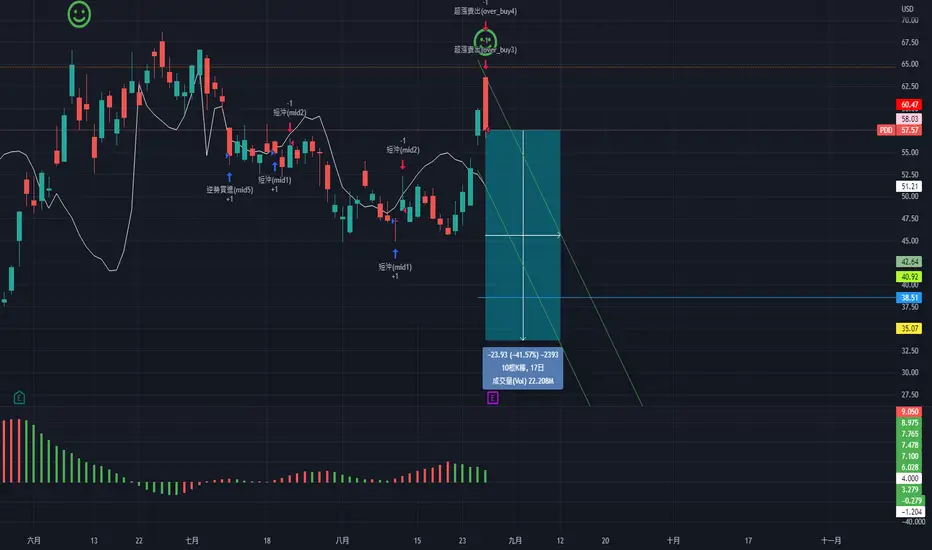
PDD, 10d+/-41.57%下降週期 大於10天 -41.57% falling cycle -41.57% more than 10 days. ================================================================================================================================================================== 此數據為機器人分析。 根據亞當理論分析歷史趨勢(20移動平均線/60移動平均線/120移動平均線/240移動平均線),估計未來 10 天的趨勢。 白線為機器人預期價格,上下橫線為止損止盈價,無財務根據,結果僅供參考。 This data is analyzed by robots. Analyze historical trends based on The Adam Theory of Markets (20 moving averages/60 moving averages/120 moving averages/240 moving averages) and estimate the trend in the next 10 days. The white line is the robot's expected price, and the upper and lower horizontal line stop loss and stop profit prices have no financial basis. The results are for reference only.
NASDAQ:PDD看空
由Tonyder提供
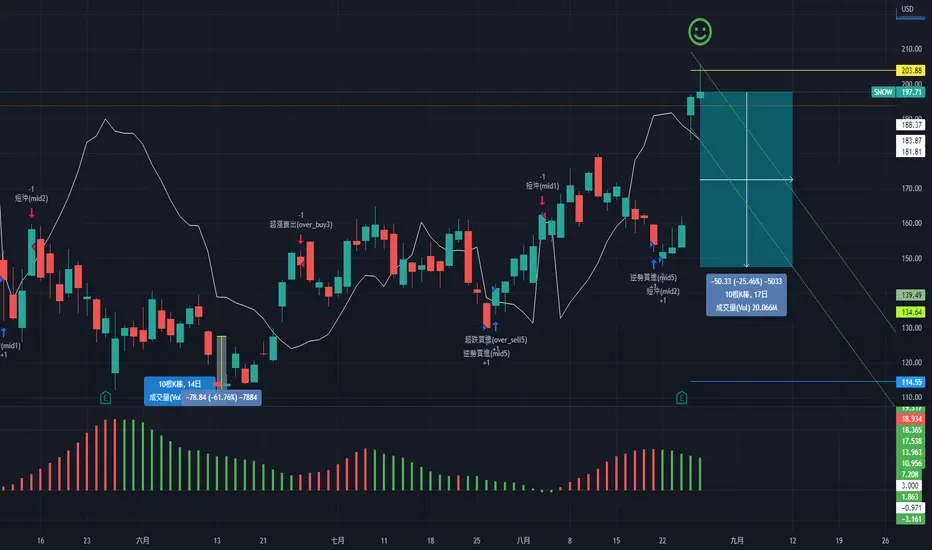
SNOW, 10d+/-25.46%下降週期 大於10天 -25.46% falling cycle -25.46% more than 10 days. ================================================================================================================================================================== 此數據為機器人分析。 根據亞當理論分析歷史趨勢(20移動平均線/60移動平均線/120移動平均線/240移動平均線),估計未來 10 天的趨勢。 白線為機器人預期價格,上下橫線為止損止盈價,無財務根據,結果僅供參考。 This data is analyzed by robots. Analyze historical trends based on The Adam Theory of Markets (20 moving averages/60 moving averages/120 moving averages/240 moving averages) and estimate the trend in the next 10 days. The white line is the robot's expected price, and the upper and lower horizontal line stop loss and stop profit prices have no financial basis. The results are for reference only.
NYSE:SNOW看空
由Tonyder提供
MSFT, 8d/-9.62%下降週期 8天 -9.62% falling cycle -9.68% in 8 days. ================================================================================================================================================================== 此數據為機器人分析。 根據亞當理論分析歷史趨勢(20移動平均線/60移動平均線/120移動平均線/240移動平均線),估計未來 10 天的趨勢。 白線為機器人預期價格,上下橫線為止損止盈價,無財務根據,結果僅供參考。 This data is analyzed by robots. Analyze historical trends based on The Adam Theory of Markets (20 moving averages/60 moving averages/120 moving averages/240 moving averages) and estimate the trend in the next 10 days. The white line is the robot's expected price, and the upper and lower horizontal line stop loss and stop profit prices have no financial basis. The results are for reference only.
NASDAQ:MSFT看空
由Tonyder提供
TSLA, 8d/-44.3%下降週期 8天 -44.3% falling cycle -44.3% in 8 days. ================================================================================================================================================================== 此數據為機器人分析。 根據亞當理論分析歷史趨勢(20移動平均線/60移動平均線/120移動平均線/240移動平均線),估計未來 10 天的趨勢。 白線為機器人預期價格,上下橫線為止損止盈價,無財務根據,結果僅供參考。 This data is analyzed by robots. Analyze historical trends based on The Adam Theory of Markets (20 moving averages/60 moving averages/120 moving averages/240 moving averages) and estimate the trend in the next 10 days. The white line is the robot's expected price, and the upper and lower horizontal line stop loss and stop profit prices have no financial basis. The results are for reference only.
NASDAQ:TSLA看空
由Tonyder提供
特斯拉小時級別多頭規劃歡迎大家留言分享自己的看法
NASDAQ:TSLA看多
19:50
由varungenioustrader提供
已更新
8/4 UBER优步 反弹持续,短期目标位在33.2~35.42免责声明: 我的全部视频都是我个人观点的分享,非投资建议,而且我的想法不一定全部都是正确,大家在做决定前一定要独立思考、仔细评估。我无法为大家的盈利或损失负责。投资有风险,投资需谨慎。
NYSE:UBER看多
17:59
由KimQuanWei提供
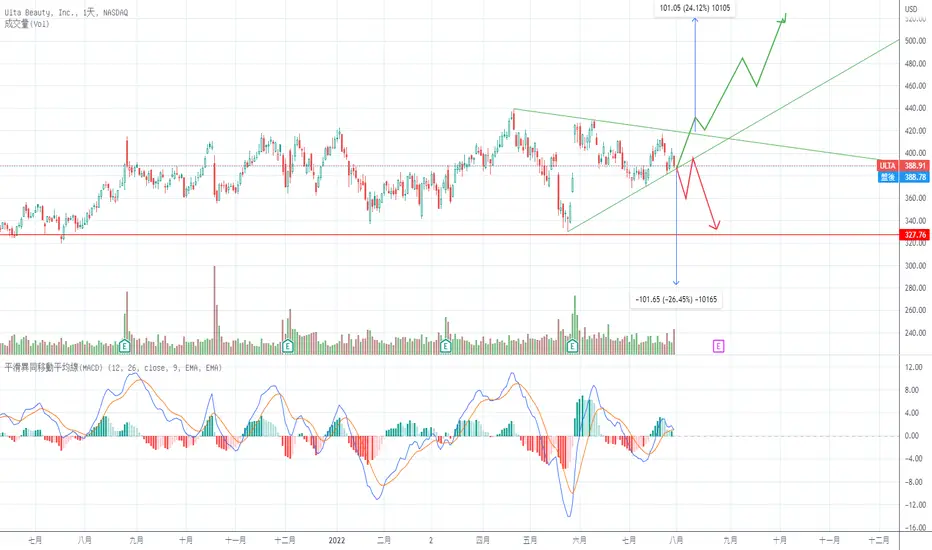
Trends and possibilities of ulta.The price of Ulta achieved a critical location. It is possible to rise or drop more than 20% within a short time. Therefore, we can do nothing but wait and watch now.
NASDAQ:ULTA
由Kissa_Lumi提供
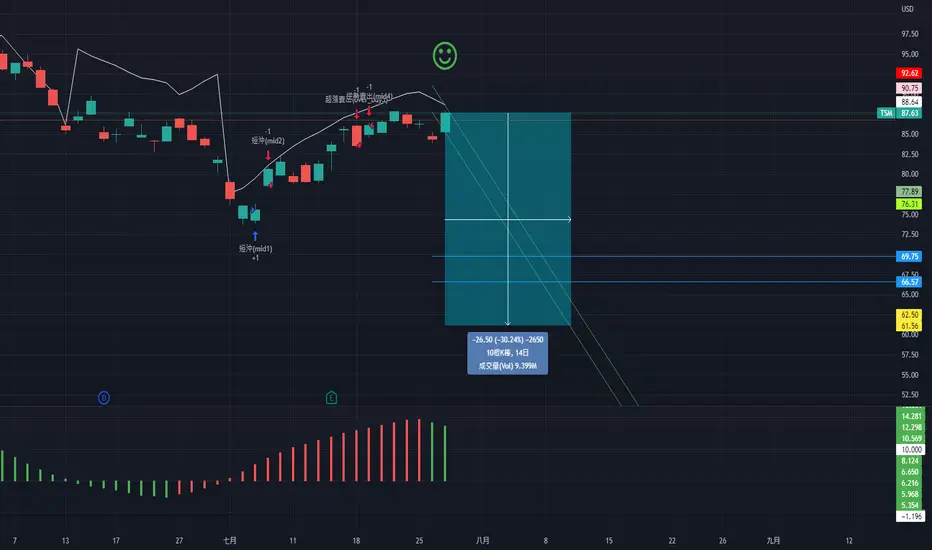
TSMC, 10d+/-30.24%下降週期 大於10天 -30.24% falling cycle -30.24% more than 10 days. ================================================================================================================================================================== 此數據為機器人分析。 根據亞當理論分析歷史趨勢(20移動平均線/60移動平均線/120移動平均線/240移動平均線),估計未來 10 天的趨勢。 白線為機器人預期價格,上下橫線為止損止盈價,無財務根據,結果僅供參考。 This data is analyzed by robots. Analyze historical trends based on The Adam Theory of Markets (20 moving averages/60 moving averages/120 moving averages/240 moving averages) and estimate the trend in the next 10 days. The white line is the robot's expected price, and the upper and lower horizontal line stop loss and stop profit prices have no financial basis. The results are for reference only.
NYSE:TSM看空
由Tonyder提供
特斯拉多頭可能性大家可以留言一起分享討論
NASDAQ:TSLA看多
06:14
由varungenioustrader提供
已更新
11
C, 10d+/-13.4%下降週期 大於10天 -13.4% faling cycle -13.4% more than 10 days. ================================================================================================================================================================== 此數據為機器人分析。 根據亞當理論分析歷史趨勢(20移動平均線/60移動平均線/120移動平均線/240移動平均線),估計未來 10 天的趨勢。 白線為機器人預期價格,上下橫線為止損止盈價,無財務根據,結果僅供參考。 This data is analyzed by robots. Analyze historical trends based on The Adam Theory of Markets (20 moving averages/60 moving averages/120 moving averages/240 moving averages) and estimate the trend in the next 10 days. The white line is the robot's expected price, and the upper and lower horizontal line stop loss and stop profit prices have no financial basis. The results are for reference only.
NYSE:C看空
由Tonyder提供
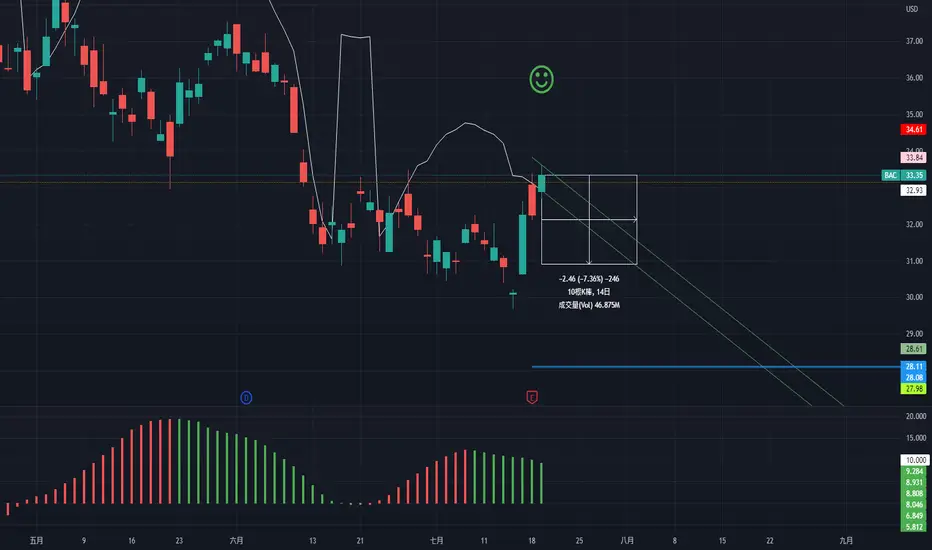
BAC, 10d+/-7.36%下降週期 大於10天 -7.36% falling cycle -7.36% more than 10 days. ================================================================================================================================================================== 此數據為機器人分析。 根據亞當理論分析歷史趨勢(20移動平均線/60移動平均線/120移動平均線/240移動平均線),估計未來 10 天的趨勢。 白線為機器人預期價格,上下橫線為止損止盈價,無財務根據,結果僅供參考。 This data is analyzed by robots. Analyze historical trends based on The Adam Theory of Markets (20 moving averages/60 moving averages/120 moving averages/240 moving averages) and estimate the trend in the next 10 days. The white line is the robot's expected price, and the upper and lower horizontal line stop loss and stop profit prices have no financial basis. The results are for reference only.
NYSE:BAC看空
由Tonyder提供
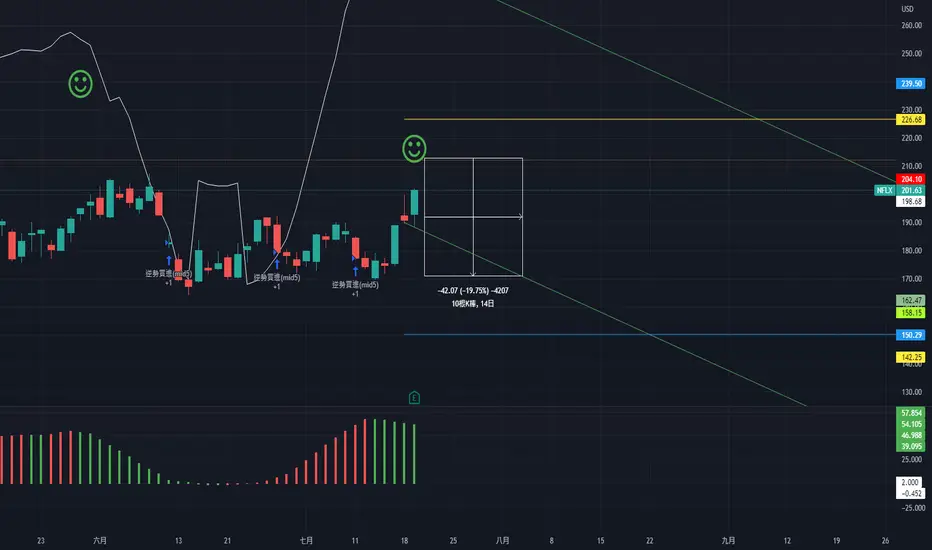
NFLX, 10d+/-19.75%下降週期 大於10天 -19.75% falling cycle -19.75% more than 10 days. ================================================================================================================================================================== 此數據為機器人分析。 根據亞當理論分析歷史趨勢(20移動平均線/60移動平均線/120移動平均線/240移動平均線),估計未來 10 天的趨勢。 白線為機器人預期價格,上下橫線為止損止盈價,無財務根據,結果僅供參考。 This data is analyzed by robots. Analyze historical trends based on The Adam Theory of Markets (20 moving averages/60 moving averages/120 moving averages/240 moving averages) and estimate the trend in the next 10 days. The white line is the robot's expected price, and the upper and lower horizontal line stop loss and stop profit prices have no financial basis. The results are for reference only.
NASDAQ:NFLX看空
由Tonyder提供
112233445566778899101011111212131314141515161617171818191920202121222223232424252526262727282829293030313132323333343435353636373738383939404041414242
…999999

人類製造

精選市場數據由ICE Data Services提供。精選參考數據由 FactSet 提供。版權所有 © 2026 FactSet Research Systems Inc.。版權所有 © 2026,美國銀行家協會 (American Bankers Association)。CUSIP數據庫由FactSet Research Systems Inc.提供。保留所有權利。美國證券交易委員會(SEC)申報文件及其他文件由 Quartr 提供。© 2026 TradingView, Inc.。

不僅是產品
  • 超級圖表
篩選器
  • 股票
  • ETF
  • 債券
  • 加密貨幣
  • CEX對
  • DEX對
  • Pine
熱圖
  • 股票
  • ETF
  • 加密貨幣
日曆
  • 經濟
  • 收益
  • 股息
  • IPO
更多產品
  • 新聞流
  • 投資組合
  • 基本圖
  • 殖利率曲線
  • 期權
  • 宏觀地圖
  • Pine Script®
App
  • 行動裝置
  • 電腦版
社群
  • 社交網路
  • 愛心牆
  • 推薦給朋友
  • 網站規則
  • 版主
投資想法
  • 交易
  • 教育
  • 編輯精選
Pine腳本
  • 指標與策略
  • 大師
  • 自由開發人員
  • 付費空間
工具與訂閱
  • 功能特色
  • 價格
  • 市場數據
  • 禮物方案
交易
  • 概要
  • 經紀商
  • 經紀商比較
  • The Leap
特別優惠
  • CME期貨
  • Eurex期貨
  • 美國股票包
關於公司
  • 我們是誰
  • 太空任務
  • 部落格
  • 幫助中心
  • 職涯
  • 媒體工具包
商品
  • TradingView商店
  • 交易者塔羅牌
  • C63 TradeTime
政策與安全
  • 使用條款
  • 免責聲明
  • 隱私政策
  • Cookies政策
  • 無障礙聲明
  • 安全提示
  • Bug賞金計劃
  • 狀態頁面
企業解決方案
  • 小工具
  • 圖表庫
  • Lightweight Charts™
  • 高級圖表
  • 交易平台
成長機會
  • 廣告
  • 經紀商整合
  • 夥伴計畫
  • 教育計劃
社群
  • 社交網路
  • 愛心牆
  • 推薦給朋友
  • 網站規則
  • 版主
投資想法
  • 交易
  • 教育
  • 編輯精選
Pine腳本
  • 指標與策略
  • 大師
  • 自由開發人員
  • 付費空間
企業解決方案
  • 小工具
  • 圖表庫
  • Lightweight Charts™
  • 高級圖表
  • 交易平台
成長機會
  • 廣告
  • 經紀商整合
  • 夥伴計畫
  • 教育計劃
Look FirstLook First