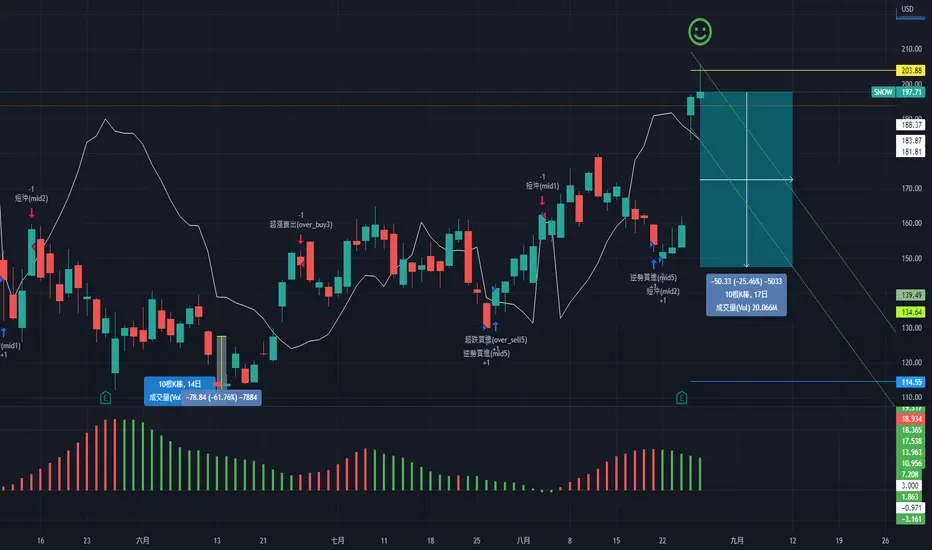
SNOW, 10d+/-25.46%下降週期 大於10天 -25.46%
falling cycle -25.46% more than 10 days.
==================================================================================================================================================================
此數據為機器人分析。 根據亞當理論分析歷史趨勢(20移動平均線/60移動平均線/120移動平均線/240移動平均線),估計未來 10 天的趨勢。 白線為機器人預期價格,上下橫線為止損止盈價,無財務根據,結果僅供參考。
This data is analyzed by robots. Analyze historical trends based on The Adam Theory of Markets (20 moving averages/60 moving averages/120 moving averages/240 moving averages) and estimate the trend in the next 10 days. The white line is the robot's expected price, and the upper and lower horizontal line stop loss and stop profit prices have no financial basis. The results are for reference only.
MSFT, 8d/-9.62%下降週期 8天 -9.62%
falling cycle -9.68% in 8 days.
==================================================================================================================================================================
此數據為機器人分析。 根據亞當理論分析歷史趨勢(20移動平均線/60移動平均線/120移動平均線/240移動平均線),估計未來 10 天的趨勢。 白線為機器人預期價格,上下橫線為止損止盈價,無財務根據,結果僅供參考。
This data is analyzed by robots. Analyze historical trends based on The Adam Theory of Markets (20 moving averages/60 moving averages/120 moving averages/240 moving averages) and estimate the trend in the next 10 days. The white line is the robot's expected price, and the upper and lower horizontal line stop loss and stop profit prices have no financial basis. The results are for reference only.
TSLA, 8d/-44.3%下降週期 8天 -44.3%
falling cycle -44.3% in 8 days.
==================================================================================================================================================================
此數據為機器人分析。 根據亞當理論分析歷史趨勢(20移動平均線/60移動平均線/120移動平均線/240移動平均線),估計未來 10 天的趨勢。 白線為機器人預期價格,上下橫線為止損止盈價,無財務根據,結果僅供參考。
This data is analyzed by robots. Analyze historical trends based on The Adam Theory of Markets (20 moving averages/60 moving averages/120 moving averages/240 moving averages) and estimate the trend in the next 10 days. The white line is the robot's expected price, and the upper and lower horizontal line stop loss and stop profit prices have no financial basis. The results are for reference only.
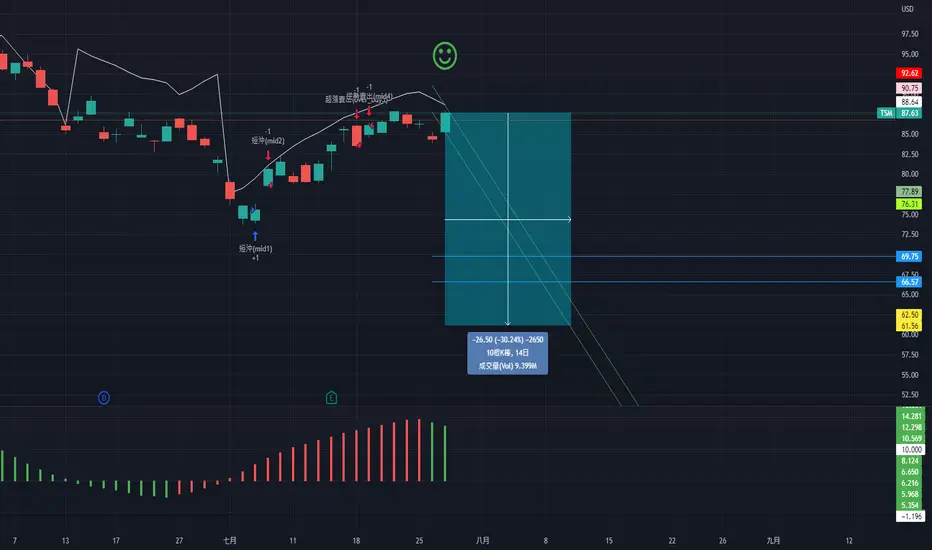
TSMC, 10d+/-30.24%下降週期 大於10天 -30.24%
falling cycle -30.24% more than 10 days.
==================================================================================================================================================================
此數據為機器人分析。 根據亞當理論分析歷史趨勢(20移動平均線/60移動平均線/120移動平均線/240移動平均線),估計未來 10 天的趨勢。 白線為機器人預期價格,上下橫線為止損止盈價,無財務根據,結果僅供參考。
This data is analyzed by robots. Analyze historical trends based on The Adam Theory of Markets (20 moving averages/60 moving averages/120 moving averages/240 moving averages) and estimate the trend in the next 10 days. The white line is the robot's expected price, and the upper and lower horizontal line stop loss and stop profit prices have no financial basis. The results are for reference only.
C, 10d+/-13.4%下降週期 大於10天 -13.4%
faling cycle -13.4% more than 10 days.
==================================================================================================================================================================
此數據為機器人分析。 根據亞當理論分析歷史趨勢(20移動平均線/60移動平均線/120移動平均線/240移動平均線),估計未來 10 天的趨勢。 白線為機器人預期價格,上下橫線為止損止盈價,無財務根據,結果僅供參考。
This data is analyzed by robots. Analyze historical trends based on The Adam Theory of Markets (20 moving averages/60 moving averages/120 moving averages/240 moving averages) and estimate the trend in the next 10 days. The white line is the robot's expected price, and the upper and lower horizontal line stop loss and stop profit prices have no financial basis. The results are for reference only.
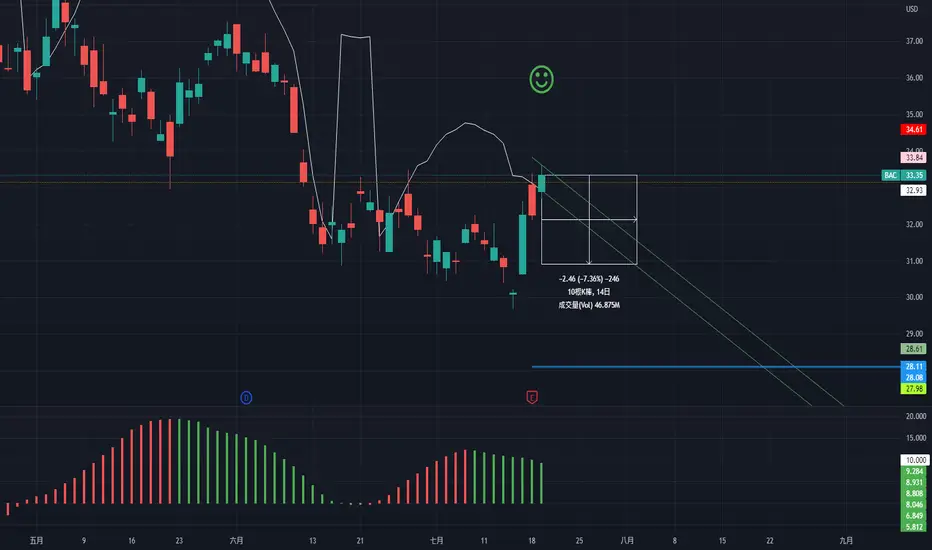
BAC, 10d+/-7.36%下降週期 大於10天 -7.36%
falling cycle -7.36% more than 10 days.
==================================================================================================================================================================
此數據為機器人分析。 根據亞當理論分析歷史趨勢(20移動平均線/60移動平均線/120移動平均線/240移動平均線),估計未來 10 天的趨勢。 白線為機器人預期價格,上下橫線為止損止盈價,無財務根據,結果僅供參考。
This data is analyzed by robots. Analyze historical trends based on The Adam Theory of Markets (20 moving averages/60 moving averages/120 moving averages/240 moving averages) and estimate the trend in the next 10 days. The white line is the robot's expected price, and the upper and lower horizontal line stop loss and stop profit prices have no financial basis. The results are for reference only.
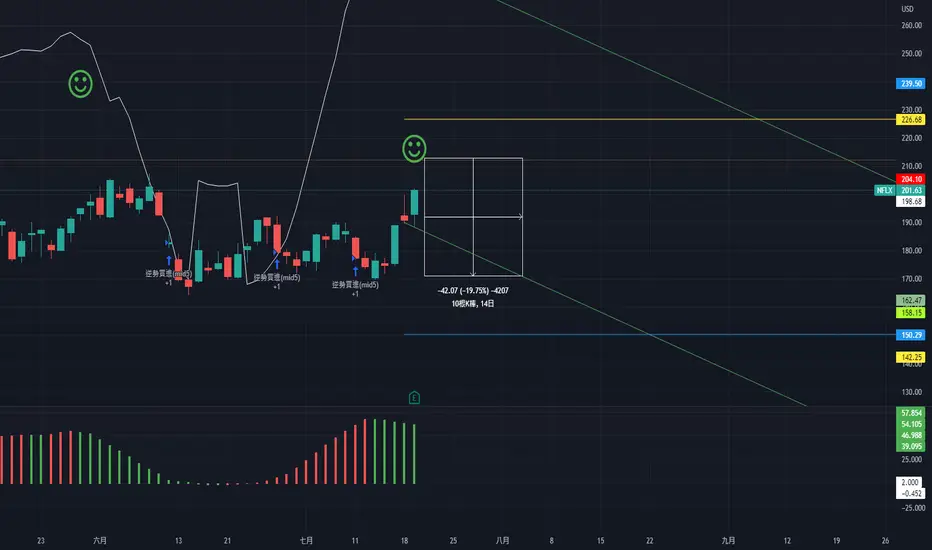
NFLX, 10d+/-19.75%下降週期 大於10天 -19.75%
falling cycle -19.75% more than 10 days.
==================================================================================================================================================================
此數據為機器人分析。 根據亞當理論分析歷史趨勢(20移動平均線/60移動平均線/120移動平均線/240移動平均線),估計未來 10 天的趨勢。 白線為機器人預期價格,上下橫線為止損止盈價,無財務根據,結果僅供參考。
This data is analyzed by robots. Analyze historical trends based on The Adam Theory of Markets (20 moving averages/60 moving averages/120 moving averages/240 moving averages) and estimate the trend in the next 10 days. The white line is the robot's expected price, and the upper and lower horizontal line stop loss and stop profit prices have no financial basis. The results are for reference only.
MSFT, 10d+/-9.6%下降週期 大於10天 -9.6%
falling cycle -9.6% more than 10 days.
==================================================================================================================================================================
此數據為機器人分析。 根據亞當理論分析歷史趨勢(20移動平均線/60移動平均線/120移動平均線/240移動平均線),估計未來 10 天的趨勢。 白線為機器人預期價格,上下橫線為止損止盈價,無財務根據,結果僅供參考。
This data is analyzed by robots. Analyze historical trends based on The Adam Theory of Markets (20 moving averages/60 moving averages/120 moving averages/240 moving averages) and estimate the trend in the next 10 days. The white line is the robot's expected price, and the upper and lower horizontal line stop loss and stop profit prices have no financial basis. The results are for reference only.
AMD, 10d+/-9.27%下降週期 大於10天 -9.27%
falling cycle -9.27% more than 10 days.
==================================================================================================================================================================
此數據為機器人分析。 根據亞當理論分析歷史趨勢(20移動平均線/60移動平均線/120移動平均線/240移動平均線),估計未來 10 天的趨勢。 白線為機器人預期價格,上下橫線為止損止盈價,無財務根據,結果僅供參考。
This data is analyzed by robots. Analyze historical trends based on The Adam Theory of Markets (20 moving averages/60 moving averages/120 moving averages/240 moving averages) and estimate the trend in the next 10 days. The white line is the robot's expected price, and the upper and lower horizontal line stop loss and stop profit prices have no financial basis. The results are for reference only.
NVDA, 10d+/23.29%下降週期 大於10天 -23.29%
falling cycle -23.29% more than 10 days.
==================================================================================================================================================================
此數據為機器人分析。 根據亞當理論分析歷史趨勢(20移動平均線/60移動平均線/120移動平均線/240移動平均線),估計未來 10 天的趨勢。 白線為機器人預期價格,上下橫線為止損止盈價,無財務根據,結果僅供參考。
This data is analyzed by robots. Analyze historical trends based on The Adam Theory of Markets (20 moving averages/60 moving averages/120 moving averages/240 moving averages) and estimate the trend in the next 10 days. The white line is the robot's expected price, and the upper and lower horizontal line stop loss and stop profit prices have no financial basis. The results are for reference only.
AAPL, 10d+/-5.73%下降週期 大於10天 -5.73%
falling cycle -5.73% more than 10 days.
==================================================================================================================================================================
此數據為機器人分析。 根據亞當理論分析歷史趨勢(20移動平均線/60移動平均線/120移動平均線/240移動平均線),估計未來 10 天的趨勢。 白線為機器人預期價格,上下橫線為止損止盈價,無財務根據,結果僅供參考。
This data is analyzed by robots. Analyze historical trends based on The Adam Theory of Markets (20 moving averages/60 moving averages/120 moving averages/240 moving averages) and estimate the trend in the next 10 days. The white line is the robot's expected price, and the upper and lower horizontal line stop loss and stop profit prices have no financial basis. The results are for reference only.
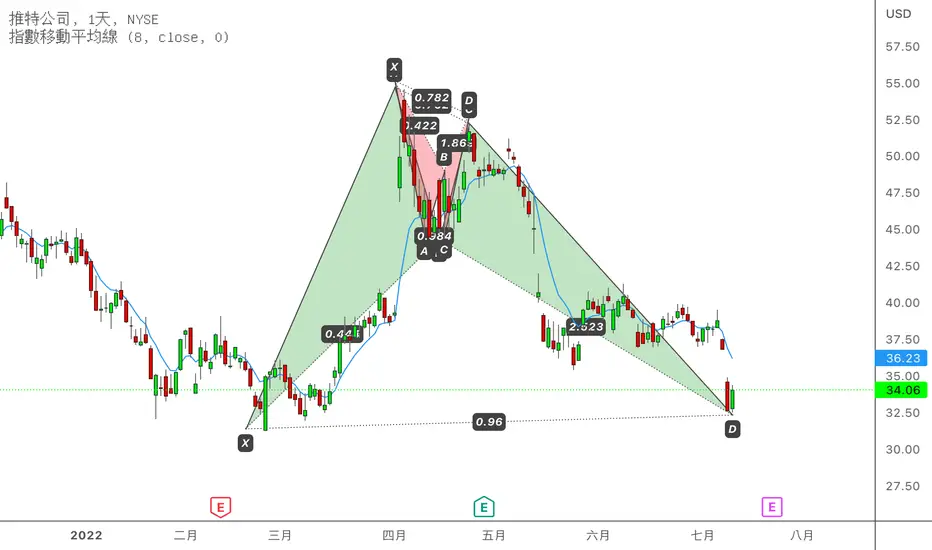
Twitter 精美的看多蝙蝠,與收購案的思路TWTR 在 Elon 暫緩收購 、提交了希望終止收購的申請之後進一步下挫
不知不覺地
從年初至今正好完成了一個教科書式的諧波嵌套
昨天也在打入蝙蝠入場位之後開始小有反應
無論是從投資角度還是交易角度
嘗試在這個位子做個多
把停損放到 30 下方
都是個盈虧比也還算不錯的選擇
Twitter 收購作為一個題材
這整件事其實也聊了好幾年了
畢竟單純從 TWTR 自己的財務表現,一直都稱不上是能夠支撐它的股價水位
2016 我還在美國基本上交易 TWTR 也都是為了同一個理由
隔了這麼多年本來以為終於要塵埃落定
結果看起來又有不小機率胎死腹中
不過踩定交易思路還是這個過程最輕鬆的
我們沒有要去預測併購成功與否,或是過程中的股價波動方向
只是一切將其歸納到 “交易計畫” 這個最小可處理單位
然後始終用輸得起的風險
把風險投入到值得冒險的交易中
股票、加密貨幣、外匯、商品亦然
也是面對今年以來的大幅波動
最優雅的參與方式之一了吧~
Let's see how it goes yo!
TSLA, 10d+/43.52%上升週期 10天 43.52%
rising cycle 43.52% more than 10 days.
==================================================================================================================================================================
此數據為機器人分析。 根據亞當理論分析歷史趨勢(20移動平均線/60移動平均線/120移動平均線/240移動平均線),估計未來 10 天的趨勢。 白線為機器人預期價格,上下橫線為止損止盈價,無財務根據,結果僅供參考。
This data is analyzed by robots. Analyze historical trends based on The Adam Theory of Markets (20 moving averages/60 moving averages/120 moving averages/240 moving averages) and estimate the trend in the next 10 days. The white line is the robot's expected price, and the upper and lower horizontal line stop loss and stop profit prices have no financial basis. The results are for reference only.
C看多
PFE, 10d+/32.91%上升週期 大於10天 32.91%
rising cycles 32.91% more than 10 days.
==================================================================================================================================================================
此數據為機器人分析。 根據亞當理論分析歷史趨勢(20移動平均線/60移動平均線/120移動平均線/240移動平均線),估計未來 10 天的趨勢。 白線為機器人預期價格,上下橫線為止損止盈價,無財務根據,結果僅供參考。
This data is analyzed by robots. Analyze historical trends based on The Adam Theory of Markets (20 moving averages/60 moving averages/120 moving averages/240 moving averages) and estimate the trend in the next 10 days. The white line is the robot's expected price, and the upper and lower horizontal line stop loss and stop profit prices have no financial basis. The results are for reference only.
INTC, 10d+/32.5%上升週期 大於10天 32.5%
rising cycle 32.5% more than 10 days.
==================================================================================================================================================================
此數據為機器人分析。 根據亞當理論分析歷史趨勢(20移動平均線/60移動平均線/120移動平均線/240移動平均線),估計未來 10 天的趨勢。 白線為機器人預期價格,上下橫線為止損止盈價,無財務根據,結果僅供參考。
This data is analyzed by robots. Analyze historical trends based on The Adam Theory of Markets (20 moving averages/60 moving averages/120 moving averages/240 moving averages) and estimate the trend in the next 10 days. The white line is the robot's expected price, and the upper and lower horizontal line stop loss and stop profit prices have no financial basis. The results are for reference only.