SNOW, 10d+/-61.76%下降周期 大於10天 -61.76%
falling cycle 61.76% more than 10 days.
==================================================================================================================================================================
此數據為機器人分析。 根據亞當理論分析歷史趨勢(20移動平均線/60移動平均線/120移動平均線/240移動平均線),估計未來 10 天的趨勢。 白線為機器人預期價格,上下橫線為止損止盈價,無財務根據,結果僅供參考。
This data is analyzed by robots. Analyze historical trends based on The Adam Theory of Markets (20 moving averages/60 moving averages/120 moving averages/240 moving averages) and estimate the trend in the next 10 days. The white line is the robot's expected price, and the upper and lower horizontal line stop loss and stop profit prices have no financial basis. The results are for reference only.
BABA, 10d+/-75.91%下降週期 大於10天 -75.91%
falling cycle -75.91% more than 10 days.
==================================================================================================================================================================
此數據為機器人分析。 根據亞當理論分析歷史趨勢(20移動平均線/60移動平均線/120移動平均線/240移動平均線),估計未來 10 天的趨勢。 白線為機器人預期價格,上下橫線為止損止盈價,無財務根據,結果僅供參考。
This data is analyzed by robots. Analyze historical trends based on The Adam Theory of Markets (20 moving averages/60 moving averages/120 moving averages/240 moving averages) and estimate the trend in the next 10 days. The white line is the robot's expected price, and the upper and lower horizontal line stop loss and stop profit prices have no financial basis. The results are for reference only.
MSFT, 10d+/-23.48%下降週期 大於10天 -23.48%
falling cycle -23.48% more than 10 days.
==================================================================================================================================================================
此數據為機器人分析。 根據亞當理論分析歷史趨勢(20移動平均線/60移動平均線/120移動平均線/240移動平均線),估計未來 10 天的趨勢。 白線為機器人預期價格,上下橫線為止損止盈價,無財務根據,結果僅供參考。
This data is analyzed by robots. Analyze historical trends based on The Adam Theory of Markets (20 moving averages/60 moving averages/120 moving averages/240 moving averages) and estimate the trend in the next 10 days. The white line is the robot's expected price, and the upper and lower horizontal line stop loss and stop profit prices have no financial basis. The results are for reference only.
TSLA, 10d+/-27.3下降週期 大於10天 -27.3%
falling cycle -27.3% more than 10 days.
==================================================================================================================================================================
此數據為機器人分析。 根據亞當理論分析歷史趨勢(20移動平均線/60移動平均線/120移動平均線/240移動平均線),估計未來 10 天的趨勢。 白線為機器人預期價格,上下橫線為止損止盈價,無財務根據,結果僅供參考。
This data is analyzed by robots. Analyze historical trends based on The Adam Theory of Markets (20 moving averages/60 moving averages/120 moving averages/240 moving averages) and estimate the trend in the next 10 days. The white line is the robot's expected price, and the upper and lower horizontal line stop loss and stop profit prices have no financial basis. The results are for reference only.
5/31 TSM(台積電) 短期反彈,挑戰115TSM 在底部形成双重底+收敛三角形突破,反弹测幅最小满足点102.58,且就波浪理论而言,已走了ABC三波,目前C波的落底位置在A波的0.618,且技术指标MACD、RSI都有背离转折,因此有跌幅落底的空翻多的迹象,因此本波反弹最大的压力在双尊头的颈线位置及逃逸缺口,上述二大压力刚好本波下跌反弹的黄金切割率0.382及0.5的位置,预计本波反弹有机会先挑战115。
免责声明:
我的全部视频都是我个人观点的分享,非投资建议,而且我的想法不一定全部都是正确,大家在做决定前一定要独立思考、仔细评估。我无法为大家的盈利或损失负责。投资有风险,投资需谨慎。
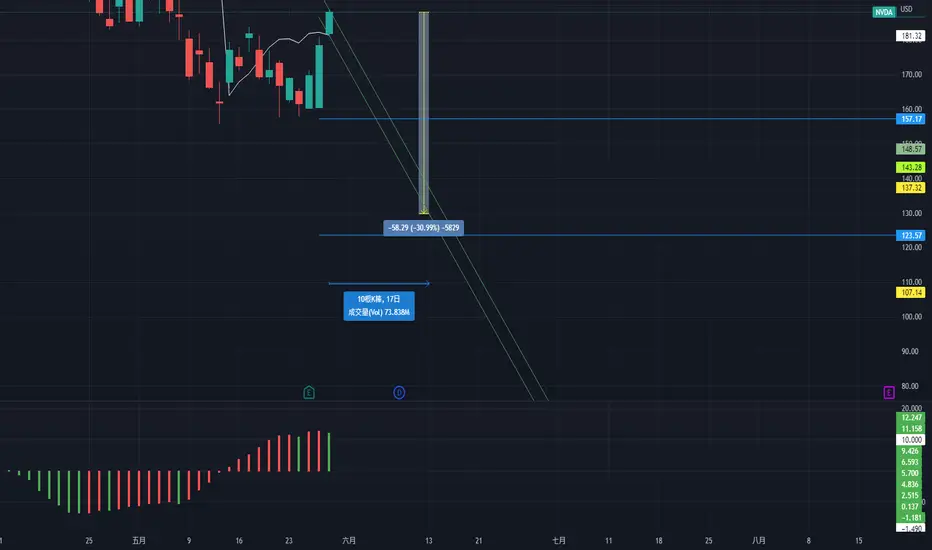
NVIDIA, 10d+/-30.99%下降週期 大於10天 -30.99%
falling cycle -30.99% more than 10 days.
==================================================================================================================================================================
此數據為機器人分析。 根據亞當理論分析歷史趨勢(20移動平均線/60移動平均線/120移動平均線/240移動平均線),估計未來 10 天的趨勢。 白線為機器人預期價格,上下橫線為止損止盈價,無財務根據,結果僅供參考。
This data is analyzed by robots. Analyze historical trends based on The Adam Theory of Markets (20 moving averages/60 moving averages/120 moving averages/240 moving averages) and estimate the trend in the next 10 days. The white line is the robot's expected price, and the upper and lower horizontal line stop loss and stop profit prices have no financial basis. The results are for reference only.
NETFIX, 10d+/-63.03%下降週期 大於10天 -63.03%
falling cycle -63.03% more than 10 days.
==================================================================================================================================================================
此數據為機器人分析。 根據亞當理論分析歷史趨勢(20移動平均線/60移動平均線/120移動平均線/240移動平均線),估計未來 10 天的趨勢。 白線為機器人預期價格,上下橫線為止損止盈價,無財務根據,結果僅供參考。
This data is analyzed by robots. Analyze historical trends based on The Adam Theory of Markets (20 moving averages/60 moving averages/120 moving averages/240 moving averages) and estimate the trend in the next 10 days. The white line is the robot's expected price, and the upper and lower horizontal line stop loss and stop profit prices have no financial basis. The results are for reference only.
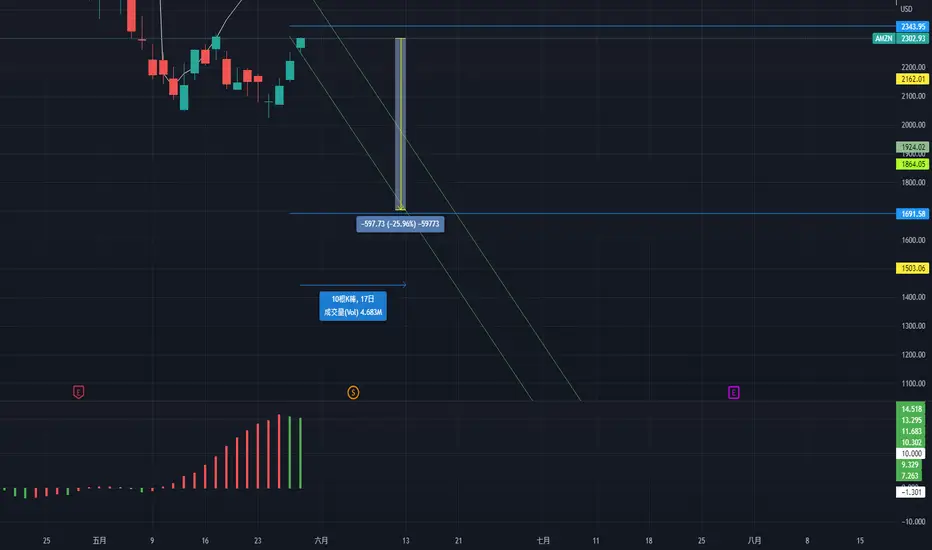
AMZN, 10d+/-25.96%下降週期 大於10天 -25.96%
falling cycle -25.96% more than 10 days.
==================================================================================================================================================================
此數據為機器人分析。 根據亞當理論分析歷史趨勢(20移動平均線/60移動平均線/120移動平均線/240移動平均線),估計未來 10 天的趨勢。 白線為機器人預期價格,上下橫線為止損止盈價,無財務根據,結果僅供參考。
This data is analyzed by robots. Analyze historical trends based on The Adam Theory of Markets (20 moving averages/60 moving averages/120 moving averages/240 moving averages) and estimate the trend in the next 10 days. The white line is the robot's expected price, and the upper and lower horizontal line stop loss and stop profit prices have no financial basis. The results are for reference only.
GOOGL, 10d+/-25.23%下降週期 大於10天 -25.23%
falling cycle -25.23% more than 10 days.
==================================================================================================================================================================
此數據為機器人分析。 根據亞當理論分析歷史趨勢(20移動平均線/60移動平均線/120移動平均線/240移動平均線),估計未來 10 天的趨勢。 白線為機器人預期價格,上下橫線為止損止盈價,無財務根據,結果僅供參考。
This data is analyzed by robots. Analyze historical trends based on The Adam Theory of Markets (20 moving averages/60 moving averages/120 moving averages/240 moving averages) and estimate the trend in the next 10 days. The white line is the robot's expected price, and the upper and lower horizontal line stop loss and stop profit prices have no financial basis. The results are for reference only.
FB/META, 10d+/-33.74%下降週期 大於10天 -33.74%
falling cycle -33.74% more than 10 days.
==================================================================================================================================================================
此數據為機器人分析。 根據亞當理論分析歷史趨勢(20移動平均線/60移動平均線/120移動平均線/240移動平均線),估計未來 10 天的趨勢。 白線為機器人預期價格,上下橫線為止損止盈價,無財務根據,結果僅供參考。
This data is analyzed by robots. Analyze historical trends based on The Adam Theory of Markets (20 moving averages/60 moving averages/120 moving averages/240 moving averages) and estimate the trend in the next 10 days. The white line is the robot's expected price, and the upper and lower horizontal line stop loss and stop profit prices have no financial basis. The results are for reference only.
F看空
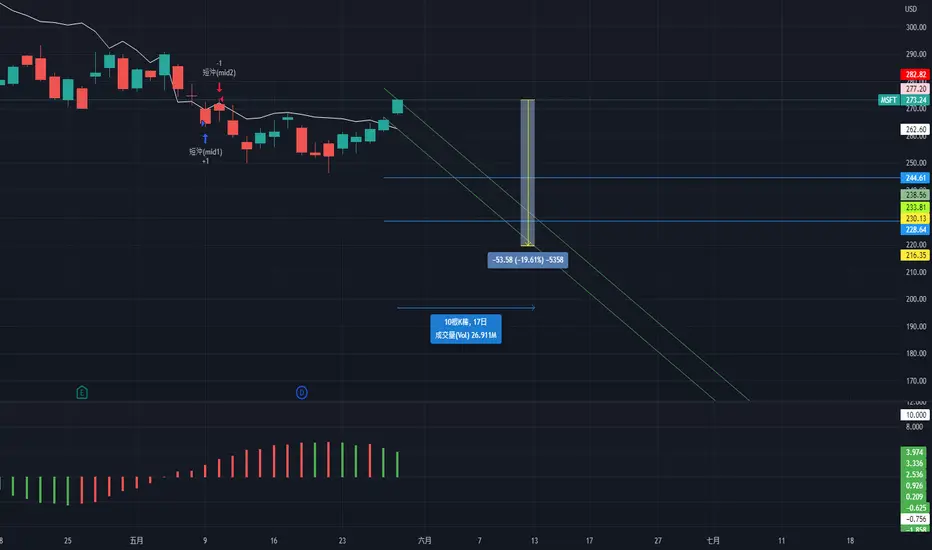
MSFT, 10d+/-19.61%下降週期 大於10天 -19.61%
falling cycle -19.61% more than 10 days.
==================================================================================================================================================================
此數據為機器人分析。 根據亞當理論分析歷史趨勢(20移動平均線/60移動平均線/120移動平均線/240移動平均線),估計未來 10 天的趨勢。 白線為機器人預期價格,上下橫線為止損止盈價,無財務根據,結果僅供參考。
This data is analyzed by robots. Analyze historical trends based on The Adam Theory of Markets (20 moving averages/60 moving averages/120 moving averages/240 moving averages) and estimate the trend in the next 10 days. The white line is the robot's expected price, and the upper and lower horizontal line stop loss and stop profit prices have no financial basis. The results are for reference only.
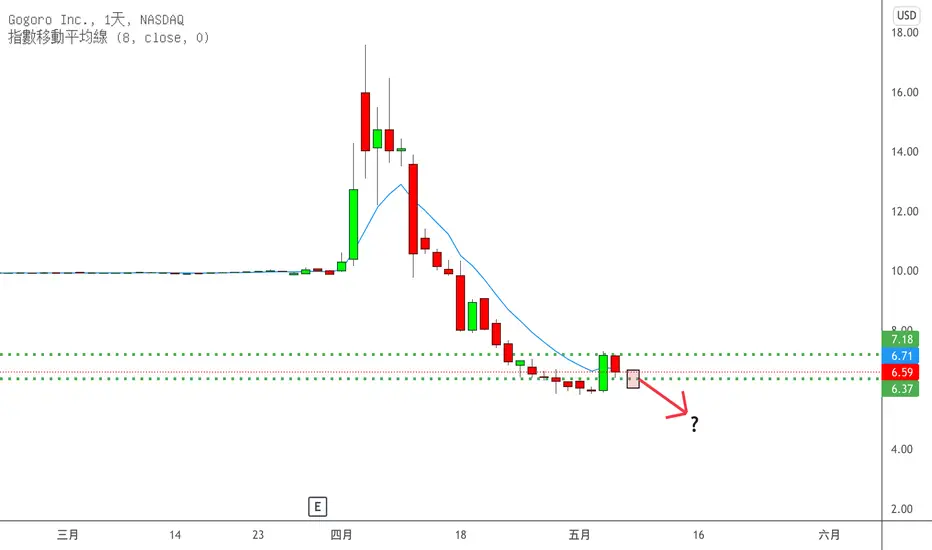
When Gogoro??? 先看看昨天的 inside day 突破方向吧四月初風風光光靠著 SPEC 順利在 Nasdaq 開始交易的 Gogoro
一個月從高點至今將近跌了 2/3
什麼時候抽 Gogoro 是台灣大大小小社群的一大流行語 (shout out to 羅傑)
什麼時候可以買 Gogoro 可能也是很多美股參與者近期非常關心的
其實這和之前寫的 逢低買入的三個標準
有滿直接的關係的
創出新低之後拉升最起碼也有個前低 5.82 作為參考
而昨天收出的 inside day 也是非常重要
如果有辦法上破,那我甚至今天就會有興趣用一些日內的風險參與
但如果繼續下破,那要貿然搶進還是大可不必
畢竟這段時間 其實保留現金已經是 PR 值非常前面的投資策略了 (?
Let's see how it goes yo!
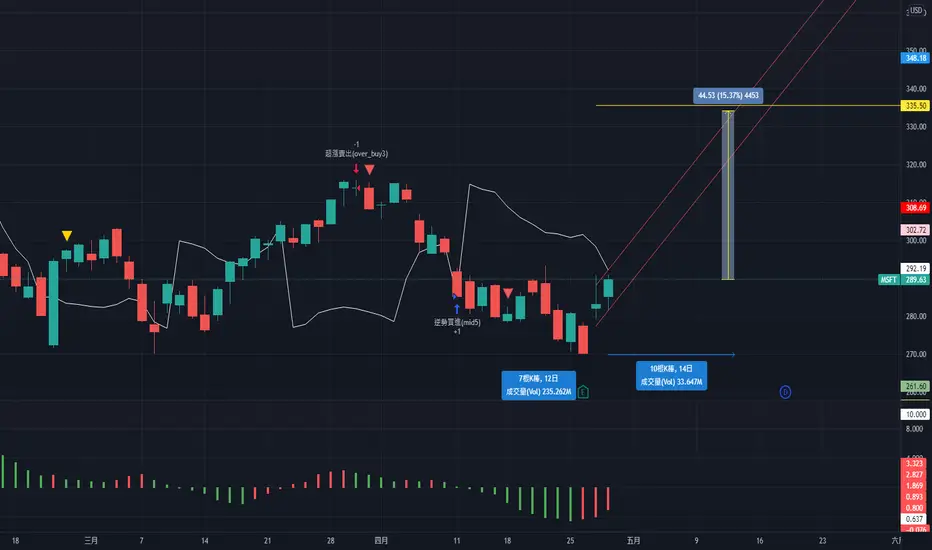
MSFT, 10d+/15.37%上升週期 大於10天 15.37%
rising cycle 15.37% more than 10 days.
==================================================================================================================================================================
此數據為機器人分析。 根據亞當理論分析歷史趨勢(20移動平均線/60移動平均線/120移動平均線/240移動平均線),估計未來 10 天的趨勢。 白線為機器人預期價格,上下橫線為止損止盈價,無財務根據,結果僅供參考。
This data is analyzed by robots. Analyze historical trends based on The Adam Theory of Markets (20 moving averages/60 moving averages/120 moving averages/240 moving averages) and estimate the trend in the next 10 days. The white line is the robot's expected price, and the upper and lower horizontal line stop loss and stop profit prices have no financial basis. The results are for reference only.
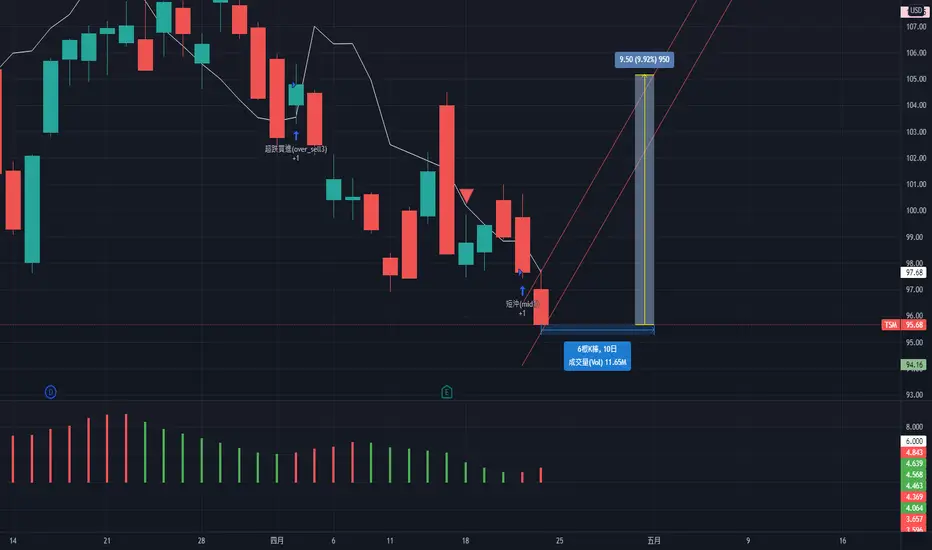
TSM, 10d+/9.92%上升週期 6天 9.92%
rising cycle 9.92% in 6 days.
==================================================================================================================================================================
此數據為機器人分析。 根據亞當理論分析歷史趨勢(20移動平均線/60移動平均線/120移動平均線/240移動平均線),估計未來 10 天的趨勢。 白線為機器人預期價格,上下橫線為止損止盈價,無財務根據,結果僅供參考。
This data is analyzed by robots. Analyze historical trends based on The Adam Theory of Markets (20 moving averages/60 moving averages/120 moving averages/240 moving averages) and estimate the trend in the next 10 days. The white line is the robot's expected price, and the upper and lower horizontal line stop loss and stop profit prices have no financial basis. The results are for reference only.
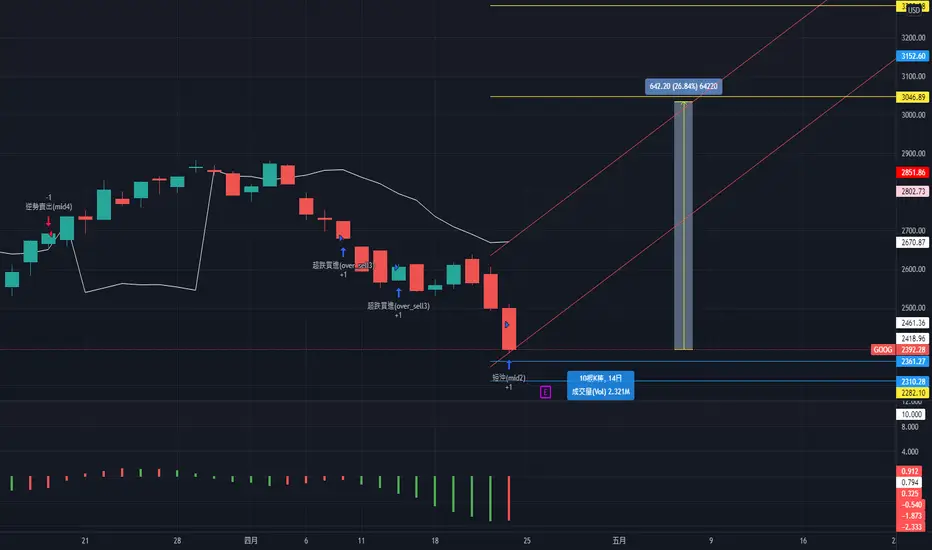
GOOGL, 10d+/26.84%上升週期 大於10天 26.84%
rising cycle 26.84% more than 10 days.
==================================================================================================================================================================
此數據為機器人分析。 根據亞當理論分析歷史趨勢(20移動平均線/60移動平均線/120移動平均線/240移動平均線),估計未來 10 天的趨勢。 白線為機器人預期價格,上下橫線為止損止盈價,無財務根據,結果僅供參考。
This data is analyzed by robots. Analyze historical trends based on The Adam Theory of Markets (20 moving averages/60 moving averages/120 moving averages/240 moving averages) and estimate the trend in the next 10 days. The white line is the robot's expected price, and the upper and lower horizontal line stop loss and stop profit prices have no financial basis. The results are for reference only.
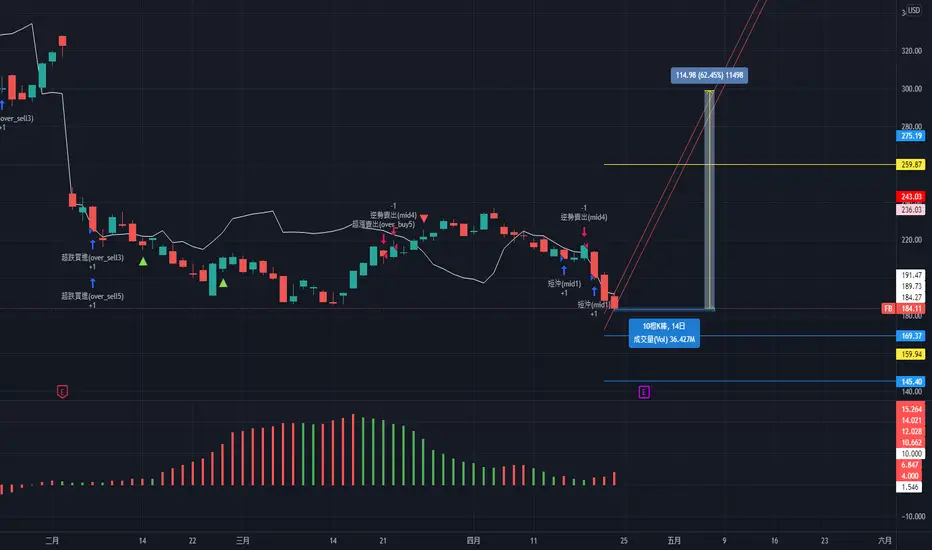
FB/META, 10d+/62.45%上升週期 大於10天 62.45%
rsing cycle 62.45% more than 10 days.
==================================================================================================================================================================
此數據為機器人分析。 根據亞當理論分析歷史趨勢(20移動平均線/60移動平均線/120移動平均線/240移動平均線),估計未來 10 天的趨勢。 白線為機器人預期價格,上下橫線為止損止盈價,無財務根據,結果僅供參考。
This data is analyzed by robots. Analyze historical trends based on The Adam Theory of Markets (20 moving averages/60 moving averages/120 moving averages/240 moving averages) and estimate the trend in the next 10 days. The white line is the robot's expected price, and the upper and lower horizontal line stop loss and stop profit prices have no financial basis. The results are for reference only.
F看多
TSLA, 10d+/20.07%上漲週期 大於10天 20.07%
rising cycle 20.07% more than 10 days.
==================================================================================================================================================================
此數據為機器人分析。 根據亞當理論分析歷史趨勢(20移動平均線/60移動平均線/120移動平均線/240移動平均線),估計未來 10 天的趨勢。 白線為機器人預期價格,上下橫線為止損止盈價,無財務根據,結果僅供參考。
This data is analyzed by robots. Analyze historical trends based on The Adam Theory of Markets (20 moving averages/60 moving averages/120 moving averages/240 moving averages) and estimate the trend in the next 10 days. The white line is the robot's expected price, and the upper and lower horizontal line stop loss and stop profit prices have no financial basis. The results are for reference only.
TSM, 4d/-8.41%下降週期 4天 -8.41%
falling cycle -8.41% in 4 days.
==================================================================================================================================================================
此數據為機器人分析。 根據亞當理論分析歷史趨勢(20移動平均線/60移動平均線/120移動平均線/240移動平均線),估計未來 10 天的趨勢。 白線為機器人預期價格,上下橫線為止損止盈價,無財務根據,結果僅供參考。
This data is analyzed by robots. Analyze historical trends based on The Adam Theory of Markets (20 moving averages/60 moving averages/120 moving averages/240 moving averages) and estimate the trend in the next 10 days. The white line is the robot's expected price, and the upper and lower horizontal line stop loss and stop profit prices have no financial basis. The results are for reference only.
MSFT, 7d/-15.84%下降週期 7天 -15.84%
falling cycle -15.84% in 7 days.
==================================================================================================================================================================
此數據為機器人分析。 根據亞當理論分析歷史趨勢(20移動平均線/60移動平均線/120移動平均線/240移動平均線),估計未來 10 天的趨勢。 白線為機器人預期價格,上下橫線為止損止盈價,無財務根據,結果僅供參考。
This data is analyzed by robots. Analyze historical trends based on The Adam Theory of Markets (20 moving averages/60 moving averages/120 moving averages/240 moving averages) and estimate the trend in the next 10 days. The white line is the robot's expected price, and the upper and lower horizontal line stop loss and stop profit prices have no financial basis. The results are for reference only.