Long
Long
Long 
 Short
Short
 Long
Long
Cerebras May Have Stopped the BleedingCerebras Systems has bled lower since a big IPO pop in May, and some traders may think the AI chipmaker is stabilizing.
The first pattern on today’s chart is the pair of lows slightly above $161 in late June and mid-July. Could that be viewed as a double-bottom?
Second is the falling trendline since June 18. CBRS pushed above that resistance on Tuesday and stayed there today. Prices are also above the 21-day exponential moving average. Those signals could suggest the short-term trend is getting more positive.
Third, the current stabilization is occurring near the $185 level where CBRS initially priced its shares.
TradeStation has, for decades, advanced the trading industry, providing access to stocks, options and futures. If you're born to trade, we could be for you. Learn more here about TradingView’s Broker of the Year!
Past performance, whether actual or indicated by historical tests of strategies, is no guarantee of future performance or success. There is a possibility that you may sustain a loss equal to or greater than your entire investment regardless of which asset class you trade (equities, options or futures); therefore, you should not invest or risk money that you cannot afford to lose. Online trading is not suitable for all investors. View the document titled Characteristics and Risks of Standardized Options at www.TradeStation.com . Before trading any asset class, customers must read the relevant risk disclosure statements on www.TradeStation.com . System access and trade placement and execution may be delayed or fail due to market volatility and volume, quote delays, system and software errors, Internet traffic, outages and other factors.
Securities and futures trading is offered to self-directed customers by TradeStation Securities, Inc., a broker-dealer registered with the Securities and Exchange Commission and a futures commission merchant licensed with the Commodity Futures Trading Commission). TradeStation Securities is a member of the Financial Industry Regulatory Authority, the National Futures Association, and a number of exchanges.
TradeStation Securities, Inc. and TradeStation Technologies, Inc. are each wholly owned subsidiaries of TradeStation Group, Inc., both operating, and providing products and services, under the TradeStation brand and trademark. When applying for, or purchasing, accounts, subscriptions, products and services, it is important that you know which company you will be dealing with. Visit www.TradeStation.com for further important information explaining what this means.  Long
Long
 Long
Long
 Long
Long
AMZN | ABC Correction Done — Break The HVA And Run!
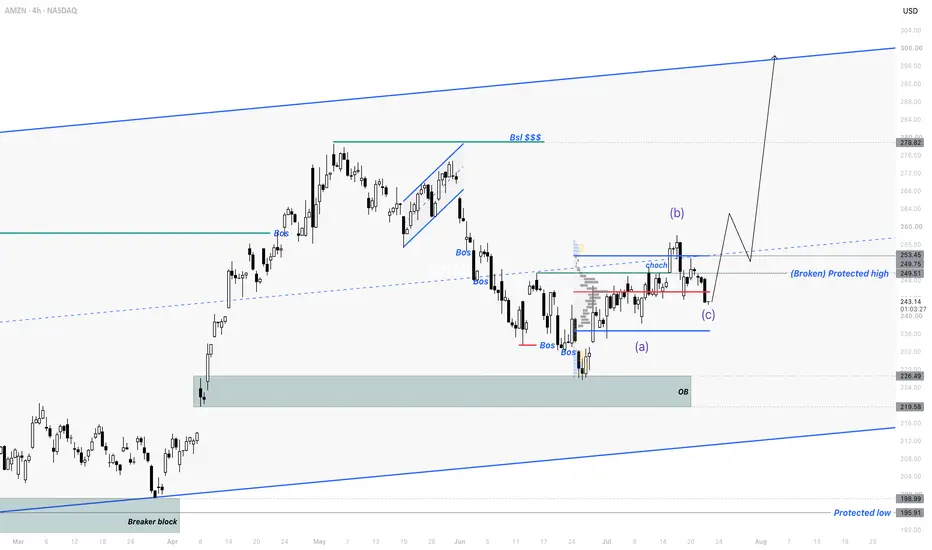
By analyzing the #AMZN (Amazon) chart on the 4H timeframe, we can see that the broader trend remains bullish, and the internal corrective phase looks to be wrapping up. Price is now compressing at a decisive volume level — and a clean break of it is the trigger for the next leg toward the liquidity above.
📊 4H Timeframe
On the 4H, the bigger picture is an uptrend riding inside its rising channel, with price holding comfortably above the Protected Low at $195.91 . Within that uptrend, price went through an internal correction: it printed a bearish internal CHoCH, followed by several bearish BOS on the way down, taking price into the demand area near the Order Block ( $219.58 – $226.49 ).
That corrective phase is now over. Price broke the Protected High of the internal downtrend at $249.51 with an impulsive wave — the structural signal that buyers reclaimed control. Since that break, price has been unwinding in a three-wave (a)-(b)-(c) correction, and it's currently trading around $242.89 , sitting right at the High Value Area (HVA) of the volume profile — the heaviest-traded level on the chart and the battleground that decides the next move.
🎯 The Bias
My base case is bullish continuation, but it needs confirmation. The trigger I want is a clear candle close above the High Value Area — that would confirm buyers have absorbed the heaviest volume on the chart and complete the corrective structure. On that break, the path opens toward the levels overhead at $249.75 and $253.45 , and then the buy-side liquidity (BSL) resting at $278.82 , with the trend continuing inside its channel. In my view, as long as AMZN holds above the Protected Low ($195.91), the uptrend stays intact and every dip remains constructive — but until that HVA gives way on a decisive close, price can keep consolidating here.
📰 Fundamental Backdrop
The technical setup lines up with a strong catalyst calendar. Amazon reports Q2 2026 results on July 30 after the US close — the key near-term event, with Wall Street modeling EPS of $1.82 (up from $1.68 a year ago) on revenue near $196 billion, and the company itself having guided to $194–199 billion. The quarter is expected to benefit from Prime Day shifting into Q2, continued AWS acceleration, and a record advertising business. Sentiment into the print is bullish: analysts carry a Strong Buy consensus, KeyBanc just raised its target to $335, and Bank of America projects around $198.8 billion in revenue with roughly 33% AWS cloud growth on enterprise AI adoption — noting that Amazon's expanding relationship with Anthropic alone could add more than $1.5 billion in sequential AWS revenue. The risk to respect is the spending: 2026 capex is tracking toward roughly $200 billion (BofA thinks the outlook could rise to ~$210 billion on higher memory costs), Amazon launched a $25 billion bond sale to fund it, and there's about $1 billion in incremental costs from the Leo satellite build ahead of a Q3 launch — all of which could pressure near-term margins. Net-net: the fundamentals support the bullish structure, but July 30 is a binary event that could easily be the catalyst that resolves this HVA battle in either direction.
This analysis will be updated as the market evolves. If this breakdown added value, drop a like 👍 and a comment 💬 to support the work — and share where you see Amazon heading next! Best Regards, BigBeluga 🐳 Long 
 Short
Short
Short 
 Short
Short
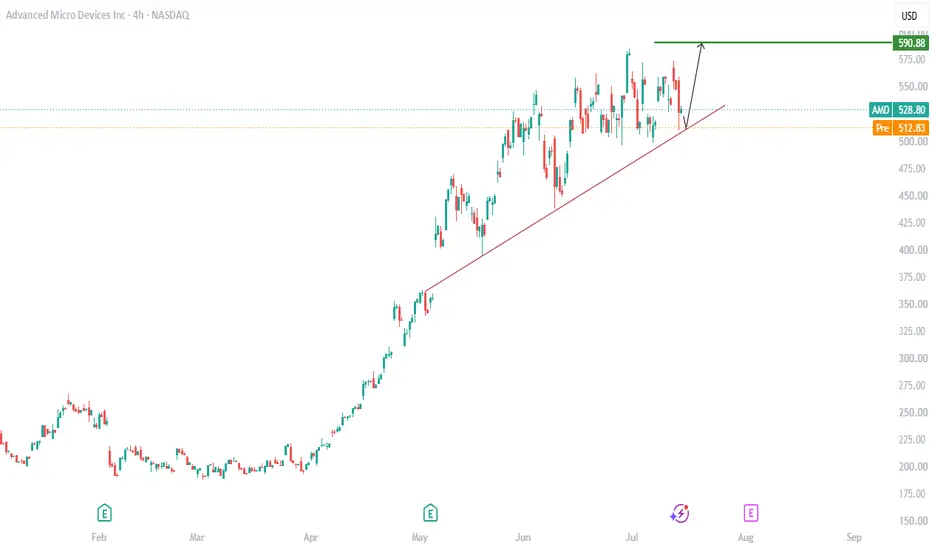
Advanced Micro Devices.(AMD): Bullish Trend Continues, Eyes ATH!Advanced Micro Devices (NASDAQ: AMD) stock is trading around the $500-$533 range. Despite a recent 3% to 4% dip linked to broader semiconductor sector shifts, analysts remain heavily bullish. Several major firms have raised price targets, driven by strong AI server demand and upcoming product developments.
Technical Insights:
Stock has persist its ascending channel momentum, trending on Higher highs and lows, in respect of the structure. Sellers comes in the market for short terms, while the buyers takes in charge of the overall trend. Price is at the trendline support, as we anticipate a new All Time High Bullish.
key Outline:
A clear reverse at this point, triggers a buy continuation, eyeing $590, as next potential high.
Thanks for reading.  Long
Long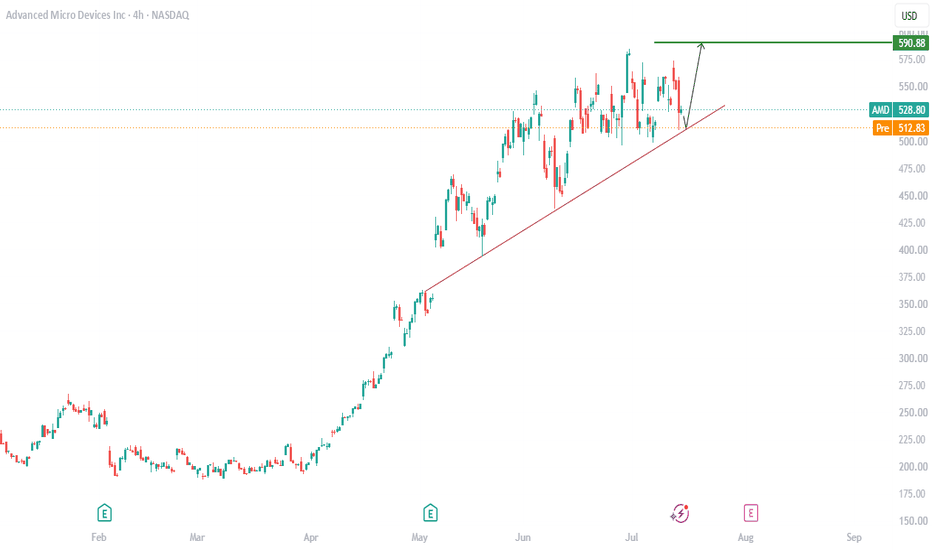
 Long
Long
 Long
Long
 Short
Short
TRX Gold Corp | Q3 2026 - Day Chart
MARKET-BEATING SCORE = 7/10
-----------------------------------
PEGY 1.00 — fairly valued.
EPS growth 46.0% — above-market.
Revenue growing 163.0% YoY — strong.
Gross margin 60.0% — strong moat.
FCF margin -2.7% — cash burn.
D/E 0.04 — conservative leverage.
-----------------------------------
"Could a policy change or major competitor disrupt growth in the next 2 years?"
TRX Gold's growth is primarily exposed to regulatory shifts in Tanzania, where historical policy volatility regarding mineral royalties and state ownership remains a concern despite an improving investment climate. While gold is a global commodity making traditional market-share competition less relevant, the company faces risks from supply chain bottlenecks and rising costs for energy and mining inputs. Overall, disruption is more likely to stem from geopolitical or fiscal policy changes than from technological advancements or new competitors within the next two years.
Risk Level:
Moderate
-----------------------------------
Multiple Time-Frame Analysis; Color Code | Strength favors the higher timeframe.
Yearly timeframe = black
Monthly timeframe = pink
weekly = grey
daily = red
4hr = orange
1hr = yellow
15min = blue
5min = green if they are shown. (Level visibility on intervals is set to timeframe the level was found on and below to keep chart view organized.)
** Candle Science explained **
A Range = two or more consecutive color candles.
There are two types of ranges - accumulation and distribution. **A single candle is a range on a lower timeframe. *Find the range and define its, creation dates, prices, and risk parameters. A range is broken down into 4 candle, which create 6 levels that define the range and illustrate market structure.
Focus only on the first and last candle of each range. The last candle of each type of range has two levels - see FS & Inv. FS Candles below.
DISTRIBUTION RANGES DEFINED:
When price is above a distribution range, these candles/levels act as support.
(BS) BACKSIDE Candle - First distribution candle in a distribution range. Expectation = strong reaction to price. long wicks reaching to or away from level. high angle accumulation trends, f.v,g's
(FS) FrontSide Candle - Last distribution candle in a distribution range. Expectation = reversal, create a low angle accumulation trend. The top of Distribution candles are used as support. The bottom of the FrontSide candle is the SwingLow of the range. The FS candle wants to protect the SwingLow. When/if Price Action closes below the SwingLow, the level is invalidated. Find another range to trade.
ACCUMULATION RANGES DEFINED: When price is below an accumulation range, these candles/levels act as resistance.
INVERSE BACKSIDE (Inv.BS) - First Accumulation candle in an accumulation range. Expectation. = strong reaction to price. long wicks reaching to or away from level. Creates high angle distribution trends, f.v.g, protects the Inv.FS candle
INVERSE FRONTSIDE (Inv.FS) - Last accumulation candle in an accumulation range. Expectation = reversal, create a low angle distribution trend. The bottom of Accumulation candles are used as resistance.
The top of the Inv.FrontSide candle is the SwingHigh of the range. The Inv.FS candle wants to protect the SwingHigh. When/if Price Action closes above the SwingHigh, the level is invalidated. Find another range to trade. FMST | Q3 2026 - Day ChartForemost Clean Energy Ltd. ||
MARKET-BEATING SCORE = 1/10
-----------------------------------
PEGY 0.96 — fairly valued.
P/E (TTM)
-5.35×
Ind: 15.98× ▲ 21.33
EPS growth 9.2% — modest.
Revenue growing 11.4% YoY — steady.
Gross margin 36.2% — decent.
FCF margin 6.8% — real cash generation.
D/E 0.98 — conservative leverage.
-----------------------------------
"Could a policy change or major competitor disrupt growth in the next 2 years?"
Policy changes remain a moderate risk as shifts in nuclear energy subsidies or environmental permitting could delay Foremost's exploration timelines in the Athabasca Basin. While the global pivot toward nuclear energy acts as a tailwind, competition from larger, well-capitalized producers and other junior explorers for drilling resources and capital remains intense. Additionally, any sudden pivot in green energy mandates toward non-nuclear alternatives could disrupt projected demand growth over the next two years.
Risk Level:
Moderate; intense but undervalued by industry averages. Pair with the monthly support level at $1.03 and weekly support at .72 - competition could result in better entry.
-----------------------------------
Multiple Time-Frame Analysis; Color Code | Strength favors the higher timeframe.
Yearly timeframe = black
Monthly timeframe = pink
weekly = grey
daily = red
4hr = orange
1hr = yellow
15min = blue
5min = green if they are shown. (Level visibility on intervals is set to timeframe the level was found on and below to keep chart view organized.)
** Candle Science explained **
A Range = two or more consecutive color candles.
There are two types of ranges - accumulation and distribution. **A single candle is a range on a lower timeframe. *Find the range and define its, creation dates, prices, and risk parameters. A range is broken down into 4 candle, which create 6 levels that define the range and illustrate market structure.
Focus only on the first and last candle of each range. The last candle of each type of range has two levels - see FS & Inv. FS Candles below.
DISTRIBUTION RANGES DEFINED:
When price is above a distribution range, these candles/levels act as support.
(BS) BACKSIDE Candle - First distribution candle in a distribution range. Expectation = strong reaction to price. long wicks reaching to or away from level. high angle accumulation trends, f.v,g's
(FS) FrontSide Candle - Last distribution candle in a distribution range. Expectation = reversal, create a low angle accumulation trend. The top of Distribution candles are used as support. The bottom of the FrontSide candle is the SwingLow of the range. The FS candle wants to protect the SwingLow. When/if Price Action closes below the SwingLow, the level is invalidated. Find another range to trade.
ACCUMULATION RANGES DEFINED: When price is below an accumulation range, these candles/levels act as resistance.
INVERSE BACKSIDE (Inv.BS) - First Accumulation candle in an accumulation range. Expectation. = strong reaction to price. long wicks reaching to or away from level. Creates high angle distribution trends, f.v.g, protects the Inv.FS candle
INVERSE FRONTSIDE (Inv.FS) - Last accumulation candle in an accumulation range. Expectation = reversal, create a low angle distribution trend. The bottom of Accumulation candles are used as resistance.
The top of the Inv.FrontSide candle is the SwingHigh of the range. The Inv.FS candle wants to protect the SwingHigh. When/if Price Action closes above the SwingHigh, the level is invalidated. Find another range to trade.