Long
Long
 Long
Long
LLY: Daily Accumulation Breakout1. The Macro Perspective: The Multi-Month Accumulation Base
I am taking a LONG bias on Eli Lilly and Company (LLY) on the daily (1D) timeframe.
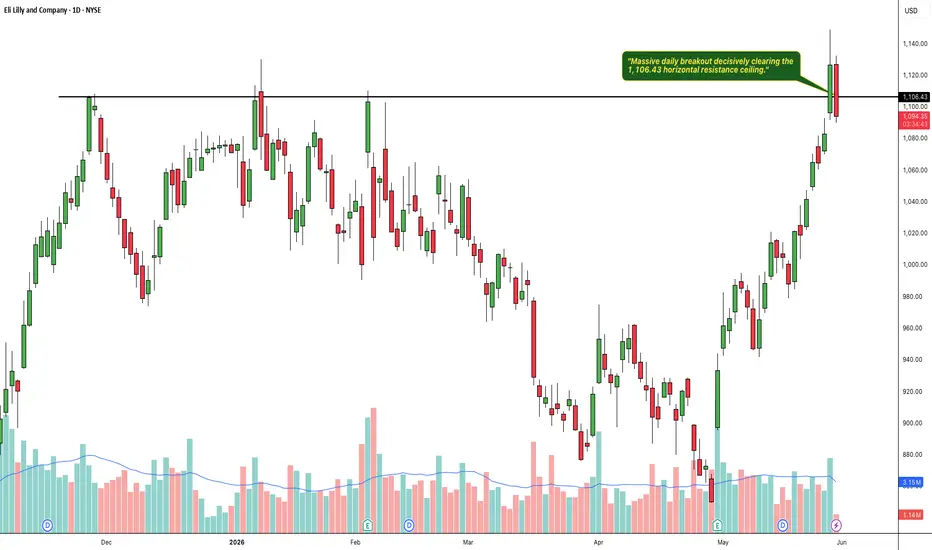
When analyzing pure market structure on a mega-cap pharmaceutical leader, prolonged consolidation periods are necessary to build kinetic energy for the next major thrust. Following its previous rally, the stock entered a massive horizontal digestion cycle spanning several months. This structure successfully absorbed profit-taking and allowed institutional capital to quietly accumulate shares. Fundamentally, this technical momentum aligns perfectly with the company's blockbuster Q1 2026 earnings report, where revenue came in at $19.8 billion, easily beating the $17.8 billion consensus estimate. Furthermore, non-GAAP EPS of $8.55 topped the $6.79 consensus by nearly 26%. The company also provided a strong FY 2026 guidance range of 35.50-37.00 EPS. Adding to the bullish fundamental backdrop, on May 26, 2026, Eli Lilly announced deals worth up to nearly $4 billion to acquire three vaccine developers—Curevo, LimmaTech Biologics, and Vaccine Co.—expanding its pipeline into infectious disease prevention.
2. The Educational Setup: Horizontal Boundary Defense
To understand the absolute technical validity behind this launch, look closely at how the price structure interacted with its core boundaries right before breaking out:
The 1,106.43 Supply Ceiling: The definitive line in the sand for a bullish continuation was the solid black horizontal resistance line drawn at 1,106.43. As the price tested this upper boundary multiple times over the past months, it established a massive supply zone that systematically rejected upward expansion.
The Dynamic Launchpad: During the consolidation block, deep pullbacks were repeatedly defended by institutional buyers, allowing the stock to carve out a series of higher lows. This sequence steadily squeezed volatility directly beneath the breakout zone, building immense structural pressure.
3. Current Price Action: Breakout and Volatility Expansion
Look at the massive daily candles on the far right of the chart. The structural pressure cooker has officially exploded. Driven by strong fundamental catalysts—including an additional $4.5 billion investment in Indiana manufacturing to meet the surging demand for its weight-loss portfolio—institutional buyers stepped in with undeniable conviction. The stock printed a powerful green expansion candle that has decisively obliterated the 1,106.43 multi-month ceiling. The stock has officially transitioned out of low-volatility accumulation and into a highly explosive markup trend into blue-sky territory.
4. The Trade Plan: Entries, Targets, and Risk Management
Entry Strategy: Momentum is exceptionally strong with the stock trading vertically out in the open above the pivotal breakout line. Chasing an extended daily breakout candle carries a minor risk of a short-term, lower-timeframe mean-reversion pullback. The highest-probability, lowest-risk entry strategy involves waiting for the initial vertical excitement to cool off. Look to scale into long positions on a potential structural pullback that perfectly retests the broken 1,090.00 to 1,106.00 prior resistance zone. Letting old historical resistance prove itself as a concrete new support floor provides an unmatched risk-to-reward ratio.
Take Profit (Targets): We use a classical measured move strategy based on the structural depth of the accumulation pattern. By taking the depth of the major range and projecting it upward from the breakout point, our primary structural target sits comfortably in the 1,250.00 to 1,280.00 zone over the coming weeks as price discovery continues. This trajectory aligns with recent analyst sentiment, where The Goldman Sachs Group raised its price target on Eli Lilly to $1,283.
Invalidation (Stop Loss): An explosive breakout thesis is completely invalidated if the price fails to hold its newly claimed structural floor and collapses back inside the core of the base boundaries. A hard stop loss should be placed safely below the recent swing lows and the mid-level of the base, specifically around the 1,020.00 to 1,040.00 level. A definitive daily close completely back below 1,020.00 would act as a severe warning sign of a failed breakout and a major bull trap.
5. Time Horizon:
Because this technical setup is built on a 1-Day chart capturing a clear structural phase transition and an all-time high horizontal breakout, this is a high-alpha swing trade designed to capture a rapid momentum markup phase over the coming weeks. Let the trend run!  Long
Long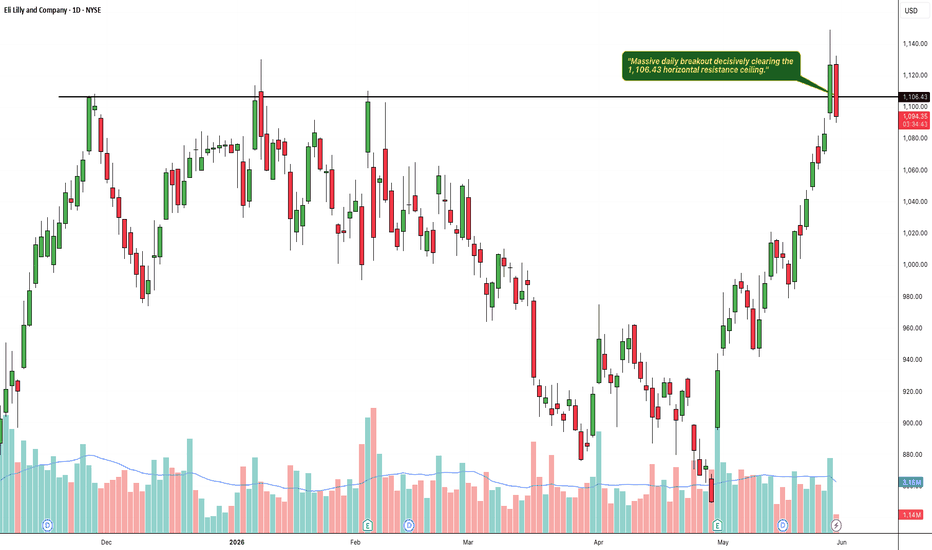
MAR: Daily Ascending Triangle Breakout & Retest1. The Macro Perspective: The Ascending Triangle Base
I am taking a LONG bias on Marriott International (MAR) on the daily (1D) timeframe.
When analyzing pure market structure on a global hospitality leader, prolonged consolidation patterns are necessary to build kinetic energy for the next major thrust. Following its steady rally throughout late 2025 and early 2026, the stock entered a massive ascending triangle formation. This structure was characterized by a flat overhead resistance ceiling and a rising sequence of higher lows along a dynamic trendline. This pattern successfully absorbed profit-taking and allowed institutional capital to quietly accumulate shares. Fundamentally, this technical momentum aligns perfectly with the company's strong Q1 2026 earnings report, where adjusted diluted EPS came in at $2.72, easily surpassing consensus estimates of $2.58. Furthermore, total revenues reached $6.65 billion, reflecting a 6% year-over-year increase. The company also reported a 4.2% increase in global RevPAR, exceeding expectations driven by strong travel demand.
2. The Educational Setup: Horizontal Resistance and Dynamic Support
To understand the absolute technical validity behind this setup, look closely at how the price structure interacted with its core boundaries right before breaking out:
The 378.05 Resistance Ceiling: The definitive line in the sand for a bullish continuation was the solid black horizontal resistance line drawn at 378.05. As the price tested this upper boundary multiple times over the past month, it established a massive supply zone that systematically rejected upward expansion until the recent catalyst.
The Ascending Trendline: During the consolidation block, every deep pullback was heavily defended by institutional buyers at progressively higher levels, forming the solid black diagonal support line. This sequence steadily squeezed volatility directly beneath the breakout zone, building immense structural pressure.
3. Current Price Action: Breakout and Structural Retest
Look at the most recent daily candles on the far right of the chart. The structural pressure cooker exploded. Driven by strong fundamental catalysts, institutional buyers stepped in with undeniable conviction, printing a powerful green expansion candle that decisively obliterated the 378.05 ceiling and pushed the stock to fresh all-time highs near 386.88. The most recent daily candle is a healthy red pullback closing at 376.84, acting as a textbook retest of the breakout zone. The stock is officially attempting to transition out of accumulation and into a highly explosive markup trend into blue-sky territory.
4. The Trade Plan: Entries, Targets, and Risk Management
Entry Strategy: Momentum remains strong despite the recent intraday pullback. The highest-probability, lowest-risk entry strategy involves utilizing this exact current structural retest. Look to scale into long positions right here in the 375.00 to 378.00 zone. Letting old historical resistance prove itself as a concrete new support floor provides an unmatched risk-to-reward ratio before the next leg up.
Take Profit (Targets): We use a classical measured move strategy based on the structural depth of the ascending triangle. By taking the depth of the major range (roughly 30 points from the 348.00 swing low up to the 378.05 ceiling) and projecting it upward from the breakout point, our primary structural target sits comfortably in the 405.00 to 410.00 zone over the coming weeks as pure price discovery continues.
Invalidation (Stop Loss): An ascending triangle breakout thesis is completely invalidated if the price fails to hold its newly claimed structural floor and collapses back inside the core of the base boundaries. A hard stop loss should be placed safely below the diagonal trendline and the recent higher lows, specifically around the 355.00 to 360.00 level. A definitive daily close completely back below 355.00 would act as a severe warning sign of a failed breakout and a major bull trap.
5. Time Horizon:
Because this technical setup is built on a 1-Day chart capturing a clear structural phase transition and an all-time high horizontal breakout, this is a high-alpha swing trade designed to capture a rapid momentum markup phase over the coming weeks. Let the trend run!  Long
Long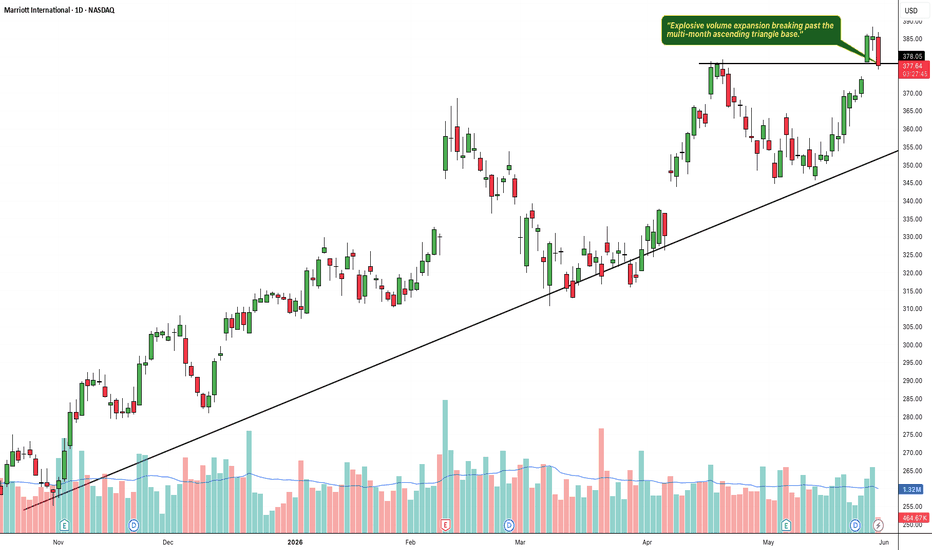
ASTS: Failed Breakout & Structural Invalidation1. The Macro Perspective: The V-Shaped Recovery and Failure
I am taking a BEARISH / CAUTIONARY bias on AST SpaceMobile, Inc. (ASTS) on the daily (1D) timeframe.
When analyzing pure market structure on an aggressive growth stock, vertical, V-shaped recoveries often lack the necessary structural digestion required to sustain a true breakout. Following a steep markdown into early May, the stock initiated a massive, high-velocity vertical squeeze back toward its historical highs. Fundamentally, this aggressive technical momentum was built on the anticipation of rapid satellite constellation deployment to enable commercial space-based cellular broadband. However, this entire fundamental thesis suffered a massive structural blow today. A catastrophic incident occurred at Cape Canaveral where a Blue Origin New Glenn rocket exploded during an engine test, severely damaging the launch complex. Analysts note this will cause significant delays for AST SpaceMobile, jeopardizing their timeline to get 45 satellites into orbit this year, which is required to begin commercial direct-to-cell service.
2. The Educational Setup: Horizontal Boundary Rejection
To understand the absolute technical failure behind this setup, look closely at how the price structure interacted with its core boundary right at the critical moment:
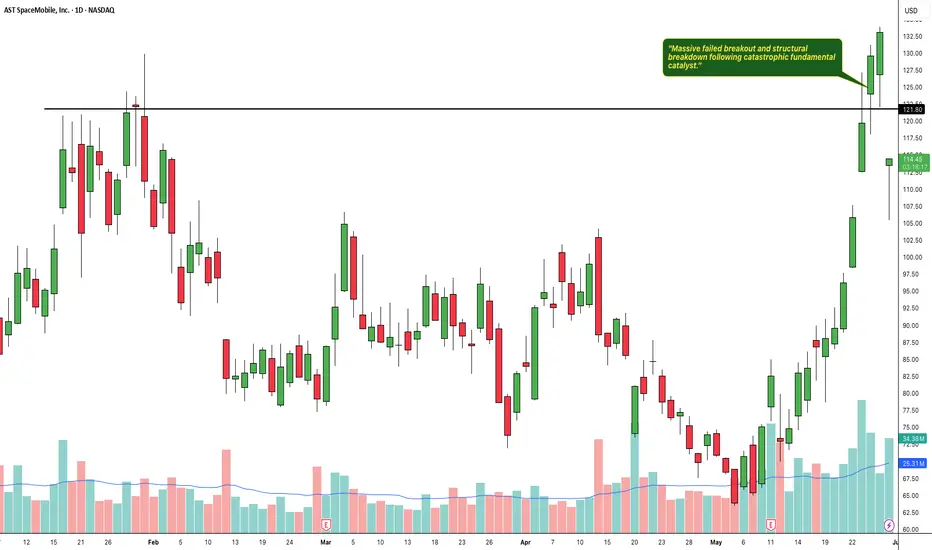
The 121.80 Pivot Ceiling: The definitive line in the sand for a bullish continuation was the solid black horizontal resistance line drawn at 121.80. While the price recently managed to push above this line, the vertical nature of the ascent meant there was zero structural support built beneath it. Buyers were entirely overextended.
3. Current Price Action: Failed Breakout and Bull Trap
Look at the most recent daily candle on the far right of the chart. The structural reality has violently snapped back. Following the devastating fundamental catalyst regarding the launchpad explosion, institutional buyers instantly pulled their bids. The stock printed a massive, full-bodied red expansion candle, gapping down and actively collapsing over 15% on the session. This explosive downside thrust has decisively obliterated the 121.80 level, pulling the price all the way down to the 112.80 zone. This price action confirms a textbook failed breakout and a massive bull trap. The stock has officially transitioned out of the markup phase and into a highly volatile downside correction.
4. The Trade Plan: Entries, Targets, and Risk Management
Entry Strategy: The bullish thesis is completely dead. For traders looking to capitalize on the downside momentum, the highest-probability entry strategy involves waiting for a dead-cat bounce or a minor intraday relief rally that retests the underside of the broken 118.00 to 121.00 zone, which should now act as a heavy new resistance ceiling.
Take Profit (Targets): Downside momentum is exceptionally strong, compounded by a major analyst downgrade from a global investment bank to a "Hold" rating with a lowered price target. By utilizing the depth of the recent structural swings, primary downside targets sit comfortably in the 95.00 to 100.00 zone, with further capitulation potentially revisiting the 80.00 to 85.00 structural base if panic selling accelerates.
Invalidation (Stop Loss): A bearish continuation thesis is invalidated if the market completely absorbs the fundamental shock and violently reclaims the structural high. A hard stop loss for short positions should be placed safely above the recent rejection wick and the 121.80 pivot, specifically around the 125.00 to 127.00 level.
5. Time Horizon:
Because this technical setup captures a massive structural phase transition and a violent failed breakout on the 1-Day chart, this is a high-volatility momentum setup designed to capture rapid downside expansion over the coming weeks. Respect the structural break!  Long
Long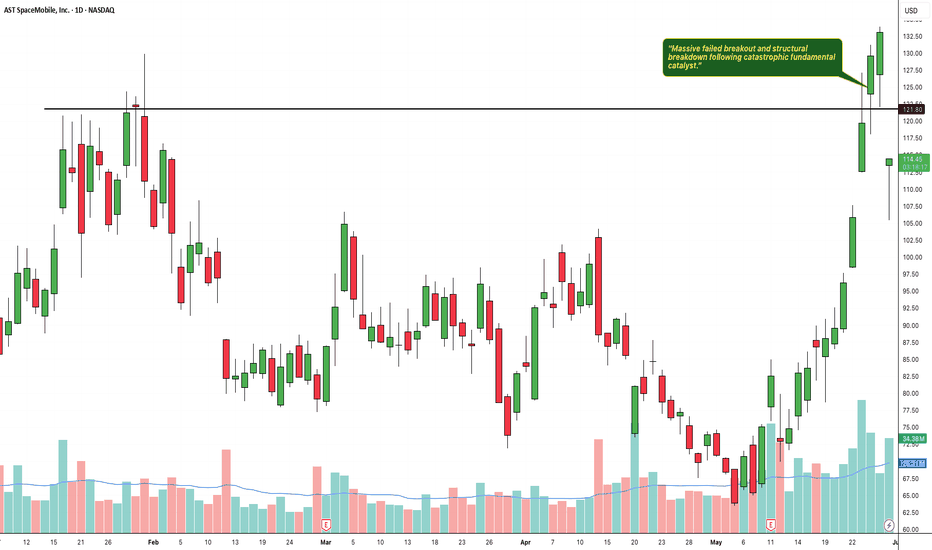
ILMN: Weekly Ascending Triangle Breakout1. The Macro Perspective: The Multi-Month Accumulation Base
I am taking a LONG bias on Illumina, Inc. (ILMN) on the macro weekly (1W) timeframe.
When analyzing pure market structure on a biotechnology leader, prolonged consolidation patterns are necessary to build kinetic energy for the next major thrust. Following a severe markdown phase throughout 2025, the stock carved out a massive structural bottom and entered a prolonged accumulation phase. This ascending triangle formation successfully absorbed overhead supply while institutional capital quietly accumulated shares at progressively higher levels. Fundamentally, this technical momentum is strongly supported by the company's recent Q1 2026 earnings report. Illumina delivered strong revenue of $1.09 billion, representing a 4.8% year-over-year increase, and reported a non-GAAP EPS of $1.15. Based on robust clinical demand, management even raised their full-year revenue guidance to roughly $4.57 billion. Furthermore, on May 28, 2026, the company announced the launch of an innovative whole-genome sequencing solution aimed at advancing molecular residual disease (MRD) research for cancer, providing a significant fundamental catalyst for future growth.
2. The Educational Setup: Horizontal Resistance and Ascending Support
To understand the absolute technical validity behind this launch, look closely at how the price structure interacted with its core boundaries prior to breaking out:
The 152.34 Resistance Ceiling: The definitive line in the sand for a macro trend reversal was the solid black horizontal resistance line drawn at 152.34. This level acted as a heavy supply zone over the past year, systematically capping upward momentum and rejecting breakout attempts.
The Ascending Trendline: Notice how every deep structural pullback since early 2025 was heavily defended by buyers at progressively higher levels, forming the solid black diagonal support line. This sequence of higher lows steadily squeezed volatility directly beneath the breakout zone, building immense structural pressure.
3. Current Price Action: Breakout and Volatility Expansion
Look at the most recent weekly candle on the far right of the chart. The structural pressure cooker has officially exploded. Driven by the strong earnings and new product pipeline, institutional buyers stepped in with undeniable conviction. The stock printed a massive, full-bodied green expansion candle that decisively obliterated the 152.34 ceiling, currently trading strong near 164.28. This explosive thrust confirms that the asset has officially transitioned out of the accumulation phase and into a highly explosive secular markup trend into fresh territory.
4. The Trade Plan: Entries, Targets, and Risk Management
Entry Strategy: Momentum is exceptionally strong with the stock trading vertically out in the open above the pivotal breakout line. Chasing an extended weekly breakout candle carries a minor risk of a short-term, lower-timeframe mean-reversion pullback. The highest-probability, lowest-risk entry strategy involves stepping down to the daily timeframe and looking to scale into long positions on a potential structural pullback that perfectly retests the broken 148.00 to 153.00 prior resistance zone. Letting old historical resistance prove itself as a concrete new support floor provides an unmatched risk-to-reward ratio.
Take Profit (Targets): By utilizing a classical measured move strategy based on the structural depth of the ascending triangle pattern, we can project upside targets. Taking the approximate depth of the range (roughly 70 points from the structural floor near 80.00 up to the 152.34 ceiling) and projecting it upward from the breakout point, our primary structural macro target sits comfortably in the 215.00 to 225.00 zone over the coming quarters as price discovery continues.
Invalidation (Stop Loss): An explosive breakout thesis is completely invalidated if the price fails to hold its newly claimed structural floor and collapses back inside the core of the base boundaries. A hard stop loss should be placed safely below the diagonal trendline and the recent weekly higher lows, specifically around the 130.00 to 135.00 level. A definitive weekly close completely back below 130.00 would act as a severe warning sign of a failed macro breakout and a major bull trap.
5. Time Horizon:
Because this technical setup is built on a 1-Week chart capturing a clear structural phase transition and a major horizontal breakout, this is a longer-term position trade designed to capture a rapid momentum markup phase over the coming months. Let the macro trend run!  Long
Long
LSTR: Weekly Macro Reversal & Breakout1. The Macro Perspective: The Deep Washout and Reversal
I am taking a LONG bias on Landstar System, Inc. (LSTR) on the macro weekly (1W) timeframe.
When analyzing pure market structure on a logistics and transportation leader, deep structural corrections often present highly lucrative asymmetrical risk-to-reward setups. Following a prolonged markdown phase throughout late 2024 and early 2025, the stock cascaded down into a deep washout zone. This painful correction successfully flushed out weak hands. Instead of consolidating at the absolute lows, heavy institutional capital aggressively stepped in, carving out a massive, V-shaped rounding bottom reversal over the past year. Fundamentally, this fierce technical momentum aligns with the company's robust Q1 2026 financial results. The transportation provider reported earnings per share of $1.16, surpassing consensus estimates, while revenue grew to $1.17 billion. Most impressively, the company achieved substantial margin expansion across key profitability metrics, signaling a successful navigation through the broader freight market downturn.
2. The Educational Setup: The 191.19 Resistance Clearance
To understand the technical validity behind this macro launch, look closely at how the price structure interacted with its core boundaries during the recovery phase:
The 191.19 Pivot Ceiling: The definitive line in the sand for a bullish structural shift was the solid black horizontal resistance line drawn at 191.19. This level marked a major structural high from the prior consolidation block before the capitulation. Clearing this level on a closing basis was essential to officially break out of the multi-year range and confirm a secular macro trend reversal.
The Dynamic Recovery: Notice the beautiful price action forming the right side of the rounding bottom throughout early 2026. The stock printed a relentless sequence of higher lows and expansion candles, systematically grinding back up toward the structural ceiling and building immense kinetic energy.
3. Current Price Action: Breakout and Volatility Expansion
Look at the most recent weekly candles on the far right of the chart. The structural reversal has been thoroughly validated. Institutional buyers have seized total control of the tape, printing a powerful sequence of towering green expansion candles on massive volume bars. The stock has decisively obliterated the 191.19 ceiling and is currently trading incredibly strong near the 207.44 level. This explosive thrust confirms that the asset has officially transitioned out of the markdown phase and into a highly explosive, high-volatility secular markup trend.
4. The Trade Plan: Entries, Targets, and Risk Management
Entry Strategy: Momentum is exceptionally strong with the stock trading firmly out in the open above the pivotal breakout line. Chasing an extended, vertical weekly move carries a minor risk of a short-term, lower-timeframe mean-reversion pullback. The highest-probability, lowest-risk entry strategy involves stepping down to the daily timeframe and looking to scale into long positions on any minor structural cooling-off period that revisits the 191.00 to 195.00 zone. Letting old historical resistance prove itself as a concrete new support floor provides an unmatched risk-to-reward ratio.
Take Profit (Targets): Because the stock is clearing a major multi-year structure to launch into pure price discovery, we use a measured move strategy based on the depth of the rounding bottom. By projecting the depth of the macro range upward from the breakout point, our primary structural target sits comfortably in the 235.00 to 245.00 zone over the coming quarters.
Invalidation (Stop Loss): A structural reversal thesis is completely invalidated if the price fails to hold its newly claimed structural floor and collapses back into the core of the rounding bottom structure. A hard stop loss should be placed safely below the breakout zone and recent lower-timeframe swing lows, specifically around the 175.00 to 180.00 level. A definitive weekly close completely back below 175.00 would act as a severe warning sign of a failed macro reversal and a major bull trap.
5. Time Horizon:
Because this technical setup is built on a 1-Week chart capturing a massive structural phase transition and a major pivot breakout, this is a longer-term position trade designed to capture a secular markup phase over the coming months and quarters. Let the macro trend run!  Long
Long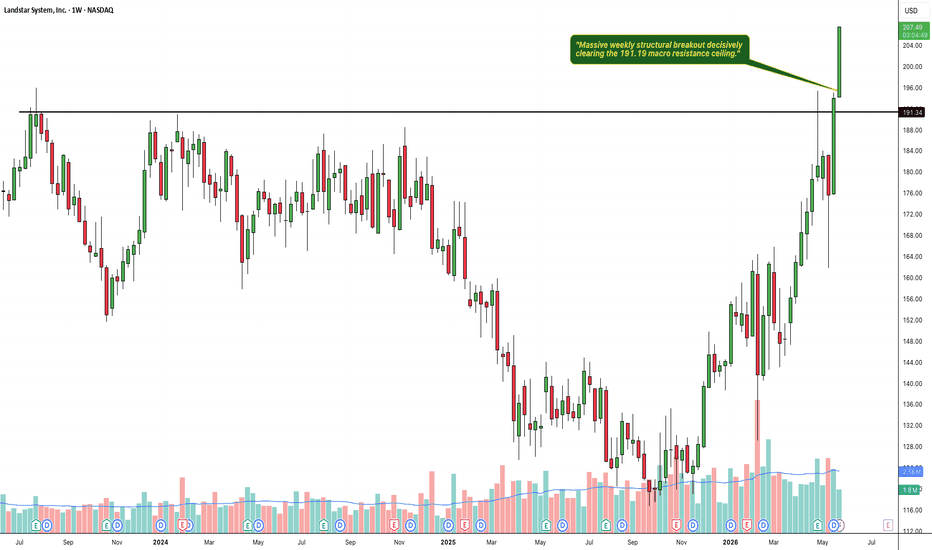
 Long
Long
 Long
Long
Short 
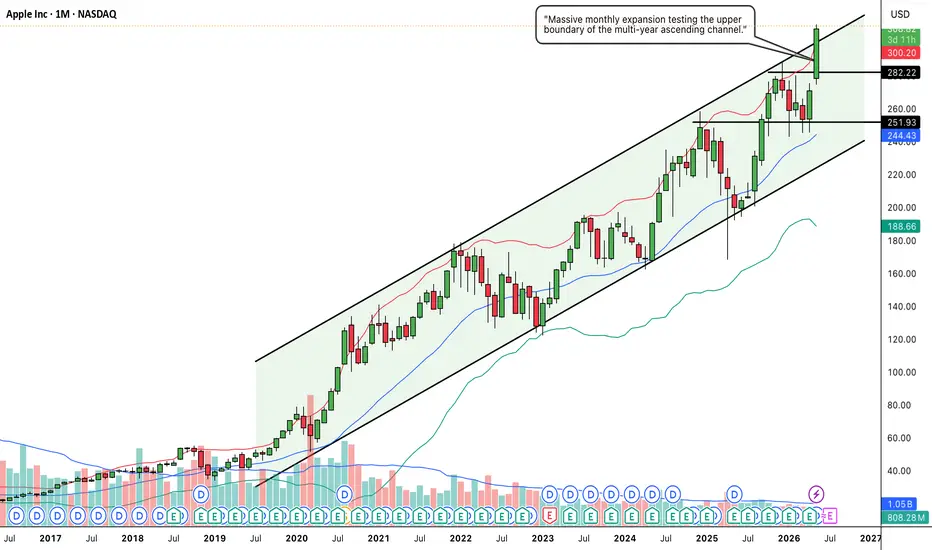
AAPL: Monthly Ascending Channel & Resistance Breakout1. The Macro Perspective: The Secular Ascending Channel
I am taking a LONG bias on Apple Inc. (AAPL) on the monthly (1M) timeframe.
When analyzing pure market structure on a mega-cap tech leader, long-term trend channels dictate the primary narrative. Look at the structural development on this chart. Since the pandemic crash in early 2020, AAPL has been flawlessly respecting a massive ascending parallel channel. This channel acts as a mechanical roadmap: the lower boundary consistently serves as a deep-value accumulation floor, while the upper boundary acts as a profit-taking zone. Following the most recent test of the channel's lower support line in early 2026, institutional buyers aggressively stepped in, launching the stock back toward the top half of the structure. Fundamentally, this fierce momentum aligns perfectly with Apple's recent blockbuster Q2 2026 earnings report, where the company delivered $111.2 billion in revenue and announced a massive new $100 billion share repurchase authorization.
www.investing.com
2. The Educational Setup: Clearing Horizontal Resistance
To understand the technical validity behind this recent thrust, look at how the price interacted with key horizontal levels within the channel:
The 251.93 Support Base: During the mid-channel chop, sellers tried to push the price lower but repeatedly failed at the 251.93 structural support. This established a critical, unbreakable higher low.
The 282.22 Resistance Ceiling: The main obstacle preventing AAPL from reaching the channel top was the solid black horizontal resistance line drawn at 282.22. This marked a major historical pivot where supply previously capped rallies. By chopping tightly beneath this line while the moving averages caught up, the stock built the necessary kinetic energy for a major breakout.
3. Current Price Action: Volatility Expansion and Channel Top
Look at the most recent monthly candle on the far right of the chart. The structural pressure cooker has exploded. Buyers have seized absolute control, printing a massive, full-bodied green expansion candle that has decisively shattered the 282.22 resistance ceiling. The stock has surged to fresh highs near the 311.40 mark, driven by major positive catalysts such as the upcoming CEO transition to John Ternus and Apple's continued dominance in the premium consumption market. Furthermore, this aggressive move has pushed the price directly into the upper boundary of the macro ascending channel.
www.perplexity.ai
4. The Trade Plan: Entries, Targets, and Risk Management
Entry Strategy: Momentum is incredibly strong, but the stock is currently running directly into the upper resistance line of the multi-year channel. Buying blindly at the absolute top of a channel carries a severe risk of a mean-reversion pullback. The highest-probability, lowest-risk entry strategy involves stepping down to the weekly timeframe and waiting for a structural cooling-off period. Look to scale into long positions on a healthy pullback that perfectly retests the broken 275.00 to 285.00 zone. Letting the 282.22 historical resistance prove itself as a concrete new support floor offers a phenomenal risk-to-reward ratio.
Take Profit (Targets): If AAPL can establish the 282.22 level as support, the primary objective is a continued grind along the upper channel boundary, projecting a structural macro target zone of 340.00 to 350.00 over the coming quarters.
Invalidation (Stop Loss): The bullish continuation thesis is severely damaged if the price fails to hold the mid-channel support and collapses back below the breakout zone. A hard stop loss should be placed safely below the 251.93 swing low, around the 240.00 to 245.00 level. A definitive monthly close completely below 240.00 would act as a major warning sign of structural failure and a break of the macro channel.
5. Time Horizon:
Because this technical setup is engineered on a 1-Month chart capturing a secular channel and a major horizontal breakout, this is a longer-term position trade designed to capture sustained macro markup over the coming months and quarters. Let the mega-cap trend run!  Long
Long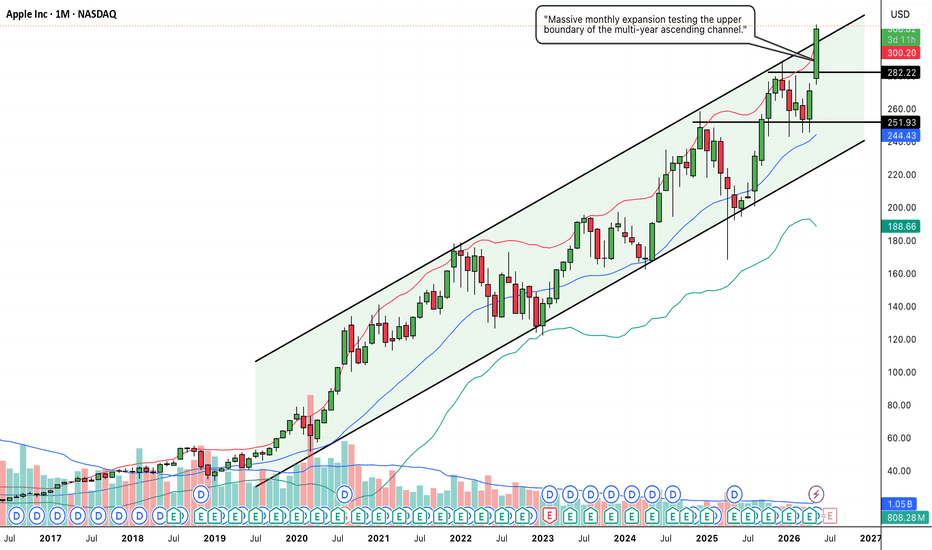
ASML: Daily Ascending Triangle Breakout1. The Macro Perspective: The Secular Tech LeaderI am taking a LONG bias on ASML Holding N.V. (ASML) on the daily (1D) timeframe.When analyzing pure market structure on a mega-cap technology leader, periods of horizontal digestion are essential before the next major leg up. Following a strong rally in early 2026, the stock entered a multi-month consolidation phase. Rather than collapsing, institutional buyers stepped in at progressively higher prices, establishing a clear sequence of higher lows. Fundamentally, this technical strength aligns with recent news that UBS raised its price target on ASML, citing rising demand for AI chips and predicting a prolonged investment cycle extending into 2028. Additionally, the company recently announced a strategic partnership with Tata Electronics to advance India's semiconductor manufacturing ecosystem, reinforcing ASML's global dominance. 2. The Educational Setup: The Ascending TriangleTo understand the absolute technical validity behind this setup, look at the key components forming the accumulation structure:The Rising Support Floor: Notice the diagonal trendline starting from the mid-March lows. Buyers consistently defended the daily 20 SMA (the middle blue line of the Bollinger Bands), carving out a sequence of higher lows. This indicates that institutional accumulation was becoming increasingly aggressive.The 1,529.24 Resistance Ceiling: While the lows were getting higher, the highs were being capped by a massive horizontal resistance line drawn at 1,529.24. The price action compressed tightly between the rising trendline and this rigid ceiling, forming a textbook Ascending Triangle. This pattern represents a volatility squeeze, where demand systematically overpowers supply until the ceiling breaks.3. Current Price Action: Volatility Expansion and BreakoutLook at the recent cluster of daily candles on the right side of the chart. The structural pressure cooker has exploded. Buyers have stepped in with undeniable conviction, printing a powerful sequence of green expansion candles that decisively shattered the 1,529.24 horizontal ceiling. The stock is currently trading around the 1,632.90 level, up 2.57% on the session. By closing cleanly above this multi-month resistance block, the price has transitioned out of the ascending triangle compression phase and into a high-volatility markup trend.4. The Trade Plan: Entries, Targets, and Risk ManagementEntry Strategy: Momentum is currently very strong, with the stock trading out in the open above the breakout line. Chasing an extended daily move carries a short-term mean-reversion risk. The highest-probability, lowest-risk entry strategy involves waiting for a minor structural cooling-off period. Look to scale into long positions or place limit orders to catch a potential pullback that retests the broken 1,520.00 to 1,540.00 neckline zone. Letting old historical resistance prove itself as a concrete new support floor offers a phenomenal risk-to-reward ratio.Take Profit (Targets): We use a classical measured move strategy based on the depth of the ascending triangle pattern. By taking the maximum depth of the pattern (roughly 290 points from the ~1,240 base up to the 1,529.24 ceiling) and projecting it upward from the breakout point, our primary structural target sits comfortably in the 1,800.00 to 1,820.00 zone over the coming weeks.Invalidation (Stop Loss): An ascending triangle breakout thesis is invalidated if the price fails to hold its newly claimed structural floor and collapses back below the rising trendline. A hard stop loss should be placed safely below the daily 20 SMA cushion and the recent higher low, specifically around the 1,410.00 to 1,430.00 level. A definitive daily close completely back below 1,400.00 would act as a severe warning sign of a failed macro breakout and a major bull trap.5. Time Horizon:Because this technical setup is built on a 1-Day chart capturing a classic structural continuation pattern and a clear horizontal breakout, this is a high-alpha swing trade designed to capture a rapid momentum markup phase over the coming weeks. Let the trend run!  Long
Long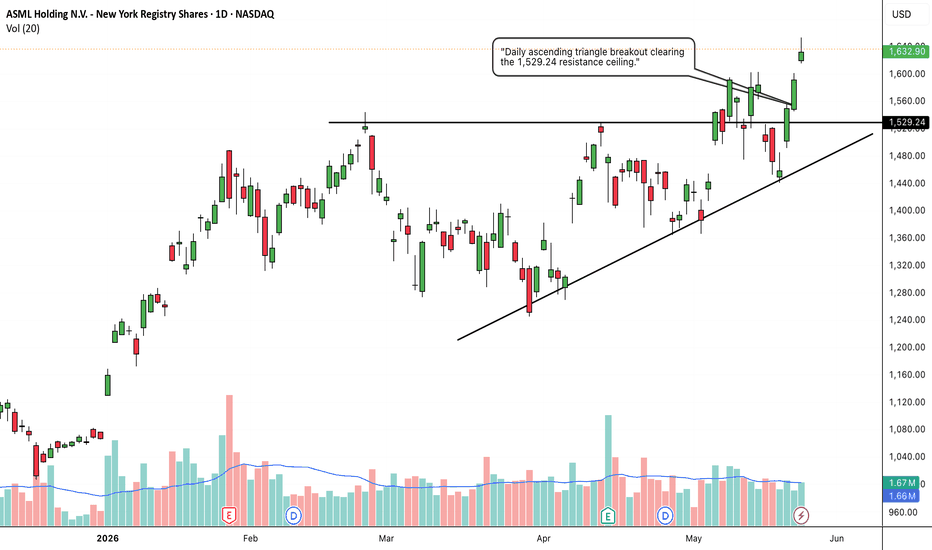
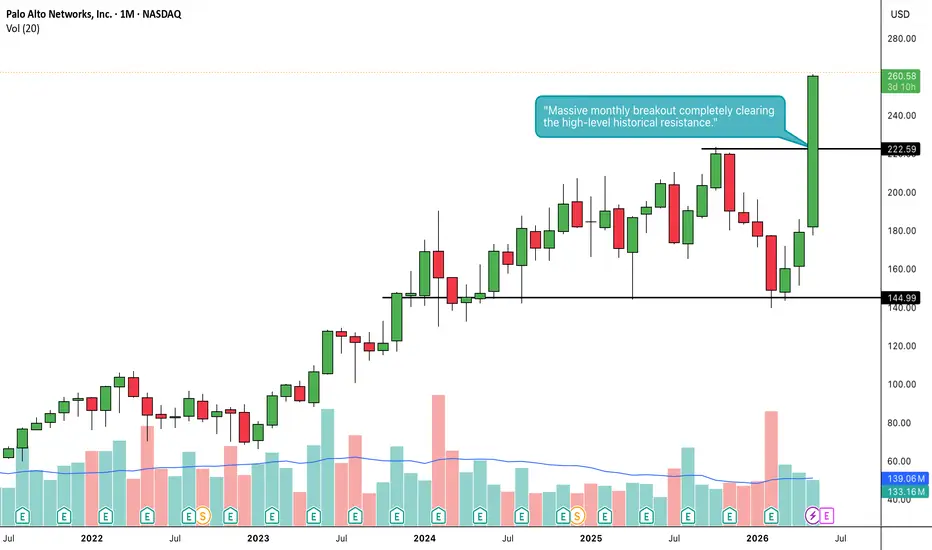
PANW: Monthly Macro Momentum Breakout1. The Macro Perspective: The Structural Shift
I am taking a LONG bias on Palo Alto Networks, Inc. (PANW) on the monthly (1M) timeframe.
When analyzing pure market structure on a mega-cap tech leader, the strongest secular trends are built upon solid foundational bases. Look at the structural development on this chart. The stock previously spent a significant period digesting below the major 144.99 structural baseline. After a decisive breakout above that level, rather than executing a vertical, unsustainable run, PANW entered a prolonged, high-level consolidation phase over the last several months. This secondary accumulation block absorbed profit-taking and allowed the moving averages to act as a rising cushion. Fundamentally, this technical strength aligns with PANW's robust financial performance, highlighted by a recent Q2 2026 earnings beat, strong Next-Generation Security ARR growth, and their continuous platformization push in cybersecurity.
public.com
2. The Educational Setup: High-Level Squeeze and Dynamic Defense
To understand the absolute technical validity behind this macro continuation, look at how the price behaved during the recent digestion phase:
The Dynamic Cushion: Notice how the deep corrective pullbacks within the high-level base were consistently defended near the rising monthly 20 SMA (the middle blue line of the Bollinger Bands, currently near 139.06). Strong-handed institutional portfolios stepped in to defend this moving average, creating a sequence of structural higher lows.
The Volatility Compression: The price chopped tightly beneath the historical resistance ceiling near the 215.00-220.00 zone. This high-level compression acts like a coiled spring, storing immense kinetic energy as demand methodically overpowers floating supply.
3. Current Price Action: Entering Pure Price Discovery
Look at the most recent monthly candle on the far right of the chart. The structural pressure cooker has exploded. Institutional buyers have stepped in with undeniable conviction, printing a massive, full-bodied green expansion candle that has surged up to 260.58 (+45.32%). This vertical thrust has decisively obliterated the previous historical supply zone on a noticeable volume expansion. The price has violently pierced the upper Bollinger Band, confirming a textbook shift out of a low-volatility accumulation phase and into a highly explosive, high-volatility secular markup trend into blue-sky territory. This coincides with major positive fundamental catalysts, including the recent launch of their Idira identity security platform built specifically for the AI enterprise.
investors.paloaltonetworks.com
4. The Trade Plan: Entries, Targets, and Risk Management
Entry Strategy: Macro momentum is exceptionally strong right now with the stock pushing hard into uncharted territory. Because the monthly candle is heavily extended and riding outside the upper Bollinger Band, chasing the price immediately carries a short-term, lower-timeframe mean-reversion risk. The highest-probability, lowest-risk entry strategy involves stepping down to the weekly timeframe and waiting for the initial vertical excitement to cool off. Look to scale into long positions on a potential pullback that perfectly retests the broken 215.00 to 225.00 prior resistance zone. Letting old historical resistance prove itself as a concrete new support floor offers a phenomenal risk-to-reward ratio.
Take Profit (Targets): Because the stock is breaking out of a massive high-level structure to launch into pure price discovery, we use a measured move strategy based on the depth of the consolidation range. Projecting the depth of the recent structure upward from the breakout point, our primary structural macro target sits comfortably in the 310.00 to 320.00 zone over the coming quarters.
Invalidation (Stop Loss): An explosive macro breakout thesis is completely invalidated if the price fails to hold its newly claimed structural floor and collapses back inside the core of the base. A hard stop loss should be placed safely below the recent weekly swing lows, specifically around the 170.00 to 180.00 level. A definitive monthly close completely back below 175.00 would act as a severe warning sign of a failed macro breakout and a major bull trap.
5. Time Horizon:
Because this technical setup is built on a 1-Month chart capturing a massive structural phase transition and an all-time high breakout, this is a longer-term position trade designed to capture a secular markup phase over the coming months and quarters. Let the macro trend run!  Long
Long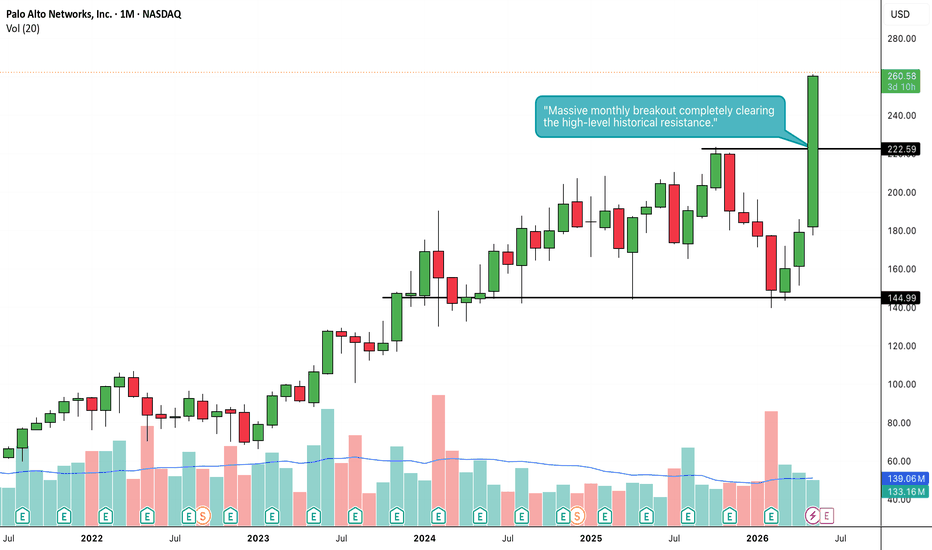
CRWD: Monthly Macro Momentum Breakout1. The Macro Perspective: The Multi-Month Accumulation Box
I am taking a LONG bias on CrowdStrike Holdings, Inc. (CRWD) on the macro monthly (1M) timeframe.
When analyzing pure market structure on a high-growth tech leader, the most lucrative trends emerge from deep, prolonged high-level consolidation phases. Following its massive secular run-up through early 2025, CRWD entered a highly necessary structural digestion cycle. The stock was tightly bounded by a structural floor near the 382.60 pivot and a formidable overhead resistance ceiling at 554.46. This multi-month horizontal accumulation range acted as a massive pressure cooker, successfully exhausting weak retail hands while institutional capital quietly absorbed liquidity and reset the technical structure.
2. The Educational Setup: Dynamic Support and Resistance Clearance
To understand the sheer technical validity behind this massive breakout, look closely at how the price interacted with its core boundaries right before launching:
The Dynamic Cushion: Notice how the deep corrective pullbacks within the high-level base were heavily defended. During the consolidation phase, institutional buyers repeatedly stepped in to protect the structural floor, eventually allowing the rising monthly moving averages to catch up and act as a dynamic launchpad.
The 554.46 Resistance Ceiling: The definitive line in the sand for a bullish continuation was the solid black horizontal resistance line drawn at 554.46. As the price climbed back to this line, it compressed heavily against the resistance, coiling the spring with immense kinetic energy beneath the surface.
3. Current Price Action: Entering Pure Price Discovery
Look at the most recent monthly candle on the far right of the chart. The structural pressure cooker has officially exploded. Institutional buyers have seized total control of the tape, printing a massive, full-bodied green expansion candle that has vertically surged to fresh highs above 660.00. This explosive thrust has decisively obliterated the 554.46 multi-month ceiling. Furthermore, the price has violently pierced the upper Bollinger Band, confirming that the asset has officially transitioned out of low-volatility accumulation and into a highly explosive, high-volatility secular markup trend, entering pure price discovery territory with zero historical overhead supply.
4. The Trade Plan: Entries, Targets, and Risk Management
Entry Strategy: Macro momentum is exceptionally strong with the stock trading vertically out in the open. Because the monthly candle is heavily extended and riding outside the upper Bollinger Band, chasing the price immediately carries a minor risk of a short-term, lower-timeframe mean-reversion pullback. The highest-probability, lowest-risk entry strategy involves stepping down to the weekly timeframe and waiting for the initial vertical excitement to cool off. Look to scale into long positions or place limit orders to catch a potential pullback to perfectly retest the broken 530.00 to 560.00 prior resistance zone. Letting old historical resistance prove itself as a concrete new support floor provides an unmatched risk-to-reward ratio.
Take Profit (Targets): Because the stock is clearing a major multi-month structure to launch into uncharted sky territory, we use a measured move strategy based on the depth of the accumulation base. By taking the absolute depth of the range (roughly 170 points from the 382.60 floor up to the 554.46 ceiling) and projecting it upward from the breakout point, our primary structural macro target sits comfortably in the 720.00 to 730.00 zone over the coming quarters.
Invalidation (Stop Loss): An explosive macro breakout thesis is completely invalidated if the price fails to hold its newly claimed structural floor and collapses back inside the core of the base boundaries. A hard stop loss should be placed safely below the recent weekly swing lows, specifically around the 450.00 to 470.00 level. A definitive monthly close completely back below 440.00 would act as a severe warning sign of a failed macro breakout and a major bull trap.
5. Time Horizon:
Because this technical setup is built on a 1-Month chart capturing a massive structural phase transition and an all-time high breakout, this is a longer-term position trade designed to capture a secular markup phase over the coming months and quarters. Let the macro trend run!  Long
Long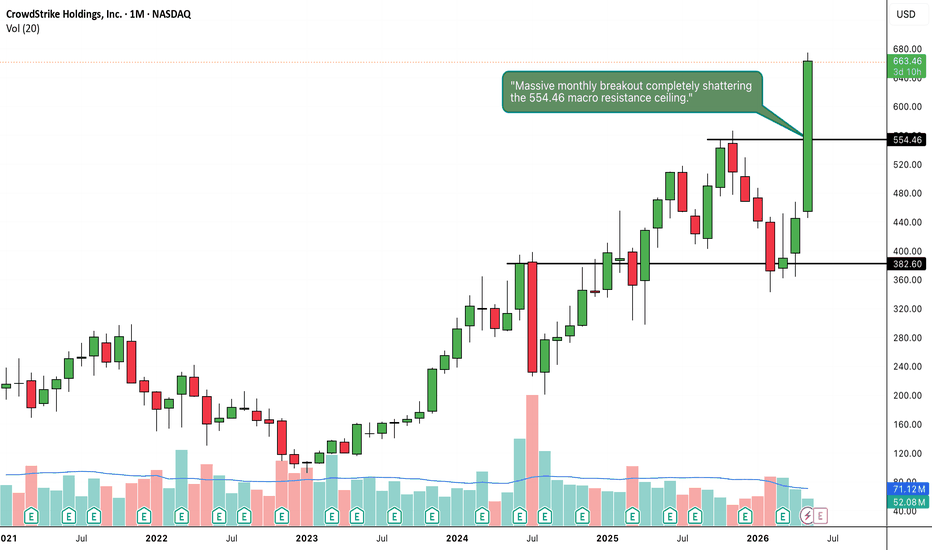
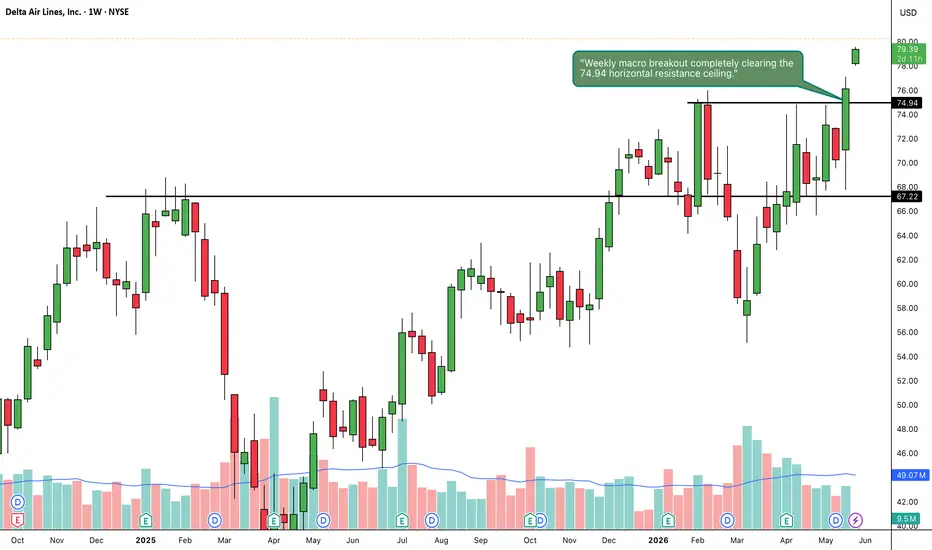
DAL: Weekly Accumulation Breakout1. The Macro Perspective: The Multi-Month Accumulation Base
I am taking a LONG bias on Delta Air Lines, Inc. (DAL) on the weekly (1W) timeframe.
When analyzing pure market structure on a major airline, prolonged consolidation periods often precede significant trend continuations. Looking at the chart, after a strong recovery phase, DAL entered a multi-month sideways accumulation block throughout early 2026. This structure was tightly bounded by a solid structural floor near 67.22 and a heavy overhead resistance ceiling at 74.94. This sideways digestion effectively absorbed profit-taking and allowed institutional buyers to quietly accumulate shares. Fundamentally, this strong technical momentum aligns with Delta's recent Q1 2026 financial performance; the airline reported a record March quarter adjusted operating revenue of $14.2 billion, which was up 9.4% year-over-year. Furthermore, the company delivered non-GAAP earnings of $0.64 per share, beating the forecast of $0.61.
2. The Educational Setup: Horizontal Boundary Defense
To understand the absolute technical validity behind this macro launch, look closely at how the price structure interacted with its core horizontal boundaries right before breaking out:
The 74.94 Resistance Ceiling: The definitive line in the sand for a bullish continuation was the solid black horizontal resistance line drawn at 74.94. As the price tested this line multiple times since February 2026, it established a clear, heavy supply zone that systematically rejected upward expansion.
The 67.22 Structural Floor: During the consolidation block, sellers repeatedly tried to push the price lower but were aggressively halted at the 67.22 support line. This created a robust, unbreakable accumulation floor where strong-handed portfolios absorbed floating supply.
3. Current Price Action: Breakout and Volatility Expansion
Look at the most recent weekly candle on the far right of the chart. The structural pressure cooker has officially exploded. Institutional buyers have stepped in with undeniable conviction, printing a massive, full-bodied green expansion candle that has vertically surged to 79.39. This explosive thrust has decisively obliterated the 74.94 multi-month ceiling. This breakout occurred despite some recent operational headwinds, where on May 26, 2026, Delta faced a rise in domestic flight cancellations exceeding the industry average due to adverse weather and air traffic control issues. The market is clearly looking past these short-term disruptions, focusing instead on the airline's strong structural demand and transitioning into a high-volatility markup trend.
4. The Trade Plan: Entries, Targets, and Risk Management
Entry Strategy: Momentum is exceptionally strong with the stock trading vertically out in the open. Chasing a breakout candle immediately carries a minor risk of a short-term, lower-timeframe mean-reversion pullback. The highest-probability, lowest-risk entry strategy involves stepping down to the daily timeframe and waiting for the initial vertical excitement to cool off. Look to scale into long positions or place limit orders to catch a potential pullback to perfectly retest the broken 73.00 to 75.00 prior resistance zone. Letting old historical resistance prove itself as a concrete new support floor provides an unmatched risk-to-reward ratio.
Take Profit (Targets): By taking the absolute depth of the horizontal accumulation range (roughly 7.7 points from the 67.22 floor up to the 74.94 ceiling) and projecting it upward from the breakout point, our primary structural macro target sits comfortably in the 82.50 to 83.50 zone over the coming weeks.
Invalidation (Stop Loss): An explosive macro breakout thesis is completely invalidated if the price fails to hold its newly claimed structural floor and collapses back inside the core of the base boundaries. A hard stop loss should be placed safely below the recent weekly swing lows, specifically around the 65.00 to 67.00 level. A definitive weekly close completely back below 67.00 would act as a severe warning sign of a failed macro breakout and a major bull trap. Additionally, investors should monitor insider activity, as over the past three months, insiders have sold $14.3 million in shares with no reported buying activity.
5. Time Horizon:
Because this technical setup is built on a 1-Week chart capturing a massive structural phase transition and a clean horizontal breakout, this is a medium-term position trade designed to capture a secular markup phase over the coming weeks and months. Let the macro trend run!  Long
Long
VAL: The High-Level Washing Machine and Explosive Box Breakout1. The Macro Perspective: The Thrust and The Digestion
I am taking a LONG bias on Valaris Limited (VAL) on the daily (1D) timeframe.
When analyzing pure market structure, massive momentum runs require massive digestion phases. Look at the structural development on the left side of this chart. After establishing a foundational floor, the stock experienced a violent, gap-up momentum thrust, surging vertically from the 70s all the way past 100. Naturally, that kind of parabolic move causes extreme exhaustion. However, look at what happened next. Instead of suffering a catastrophic, deep correction that wiped out the gains, institutional buyers aggressively defended the structure. They established a massive, high-level horizontal consolidation zone (the shaded Box). For months, the price chopped violently between the ~88.00 floor and the ~104.00 ceiling. This sideways action acts as a "washing machine"—it frustrates impatient retail traders into selling, allowing heavy capital to quietly absorb shares at a high level.
2. The Educational Setup: The Volatility Squeeze
To understand the sheer strength of this current breakout, look at the mechanics inside the box leading up to the launch:
The High-Level Base: By holding the gains of the initial thrust and refusing to break below the 88.00 floor, the stock formed a massive "Bull Flag" or "High-Level Base." This proves that institutional demand was far greater than retail profit-taking.
The Bollinger Band Squeeze: Look at the blue Bollinger Bands. As the price chopped sideways in the box, the upper and lower bands pinched tightly together. In technical analysis, volatility is cyclical; a massive contraction (a squeeze) is almost always followed by a violent expansion. The box acted like the ultimate pressure cooker, storing immense kinetic energy.
3. Current Price Action: The Lid Blows Off
Look at the most recent daily candles on the far right. The pressure cooker has absolutely exploded. Buyers have effortlessly shattered the 104.00 box ceiling with consecutive green momentum expansion candles, pushing the price past 111.00. Furthermore, notice how the price has violently pierced the upper Bollinger Band, forcing the bands to rapidly expand upward. By decisively clearing this massive multi-month accumulation zone, VAL has officially completed its digestion phase and entered a powerful new markup phase.
4. The Trade Plan: Entries, Targets, and Risk Management
Entry Strategy: Momentum is exceptionally strong right now near 111.00. Chasing a massive vertical expansion candle riding outside the daily Bollinger Bands carries a high risk of an agonizing intraday or daily mean-reversion pullback. The highest-probability, lowest-risk entry involves stepping down to an hourly timeframe and placing limit orders to catch a potential structural pullback to perfectly retest the top of the box in the 104.00 to 106.00 zone. Letting that old, heavy box resistance prove itself as a new, indestructible support floor offers a phenomenal risk-to-reward ratio.
Take Profit (Targets): We use measured structural targets based on the depth of the consolidation box. By taking the depth of the box (roughly 16 points from the 88.00 floor to the 104.00 ceiling) and projecting it upward from the breakout line, our primary structural swing target sits perfectly in the 120.00 zone.
Invalidation (Stop Loss): A box breakout thesis is only valid if the stock refuses to fall back deep into the trap. A hard stop loss should be placed safely below the top quarter of the box and the rising 20 SMA (middle Bollinger Band), around the 98.00 to 100.00 level. A definitive daily close completely back inside the middle of the box would act as a massive warning sign of a failed breakout and a severe bull trap.
5. Time Horizon:
Because this technical setup is built on a 1-Day chart capturing an explosive breakout from a massive high-level consolidation box, this is a short-to-medium-term swing trade designed to capture the violent momentum continuation. Let the new trend run!  Long
Long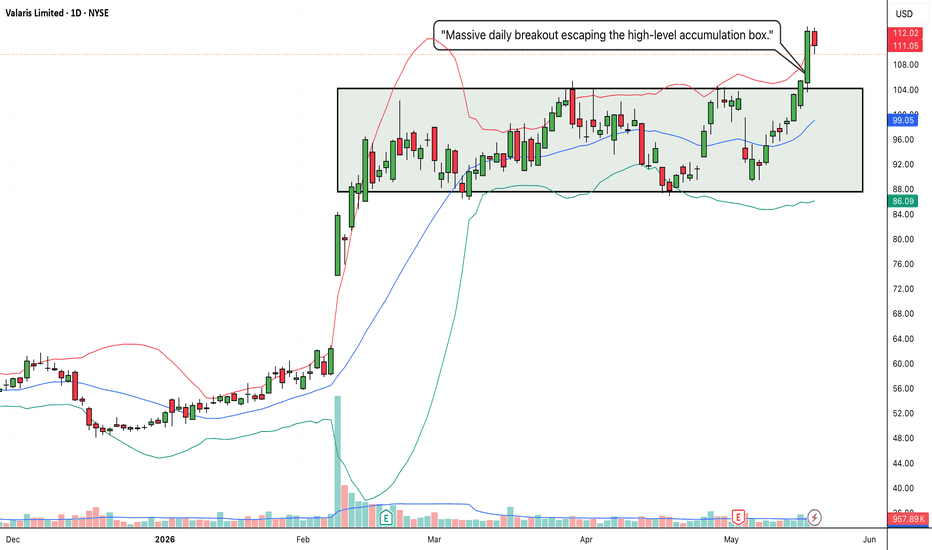
CON: Massive W-Bottom Macro Base and Explosive Breakout1. The Macro Perspective: The Multi-Month Washout
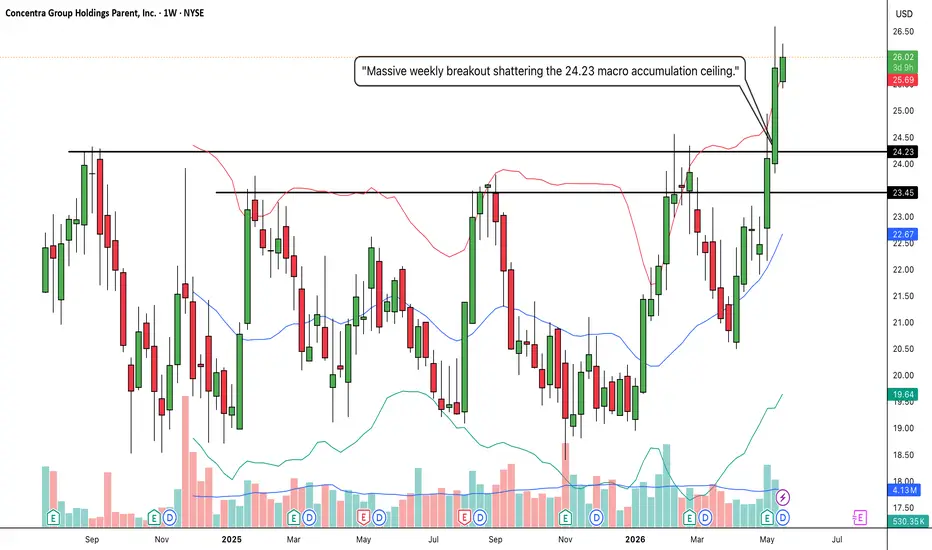
I am taking a LONG bias on Concentra Group Holdings Parent, Inc. (CON) on the weekly (1W) timeframe.
When analyzing pure market structure, the most lucrative macro trends are born from deep, exhausting accumulation phases. Look at the massive structural development spanning this chart. After establishing a historical resistance zone between the solid black 23.45 and 24.23 lines, the stock suffered a prolonged markdown phase. It washed out all the way down into the 19.50 zone, completely decimating weak hands and forcing retail capitulation. However, heavy institutional capital stepped in at those lows to establish an absolute concrete floor, initiating the left side of a massive "W" or Double Bottom accumulation structure.
2. The Educational Setup: The Higher-Low Springboard
To understand the sheer strength of this current breakout, look at how the right side of the "W" pattern was formed:
The Rejection and the Trap: The stock rallied back to the 24.23 ceiling and faced a brutal rejection. To an amateur trader, this looked like a massive double-top failure, triggering short sellers and panic selling.
The 20 SMA Defense: Notice what happened next. The stock pulled back, but it refused to make a new low. Instead, institutional buyers aggressively defended the rising 20 SMA (the middle blue line of your Bollinger Bands) right around the 20.00 to 21.00 level. By carving out a massive "Higher Low" directly on the moving average, they trapped the short sellers and created a powerful structural springboard for the next leg up.
3. Current Price Action: Blue Sky and Volatility Expansion
Look at the most recent weekly candles on the far right. The springboard has absolutely exploded. Buyers have effortlessly shattered the entire resistance block (23.11 dashed, 23.45 solid, and 24.23 solid) with consecutive, massive green momentum expansion candles. Furthermore, notice how the price has violently pierced the upper Bollinger Band, forcing the bands to rapidly expand upward alongside a noticeable surge in buying volume. By decisively clearing this massive multi-month accumulation zone, CON has officially entered "Blue Sky Territory" (pure price discovery).
4. The Trade Plan: Entries, Targets, and Risk Management
Entry Strategy: Momentum is exceptionally strong right now near 26.00. Chasing a massive vertical expansion candle riding outside the weekly Bollinger Bands always carries a higher risk of an agonizing intraday or daily mean-reversion pullback. The highest-probability, lowest-risk entry involves stepping down to a daily timeframe and placing limit orders to catch a potential structural pullback to perfectly retest the 24.00 to 24.50 breakout zone. Letting that heavy historical resistance prove itself as a new, indestructible support floor offers a phenomenal risk-to-reward ratio.
Take Profit (Targets): We use measured structural targets based on the depth of the massive macro base. By taking the depth of the W-Bottom (roughly 4.75 points from the ~19.50 floor up to the 24.23 ceiling) and projecting it upward from the breakout line, our primary structural swing target sits comfortably in the 28.75 to 29.00 zone. The psychological 30.00 mark will act as a secondary macro magnet.
Invalidation (Stop Loss): A macro breakout thesis is only valid if the new market structure holds. A hard stop loss should be placed safely below the breakout zone and the recent daily consolidation, around the 22.00 to 22.50 level. A definitive weekly close completely back inside the old accumulation base and breaking below the 20 SMA would act as a massive warning sign of a failed macro breakout and a severe bull trap.
5. Time Horizon:
Because this technical setup is built on a 1-Week chart capturing a massive structural W-Bottom completion and volatility expansion, this is a medium-to-longer-term position trade designed to capture the explosive new markup phase. Let the macro trend run! Long 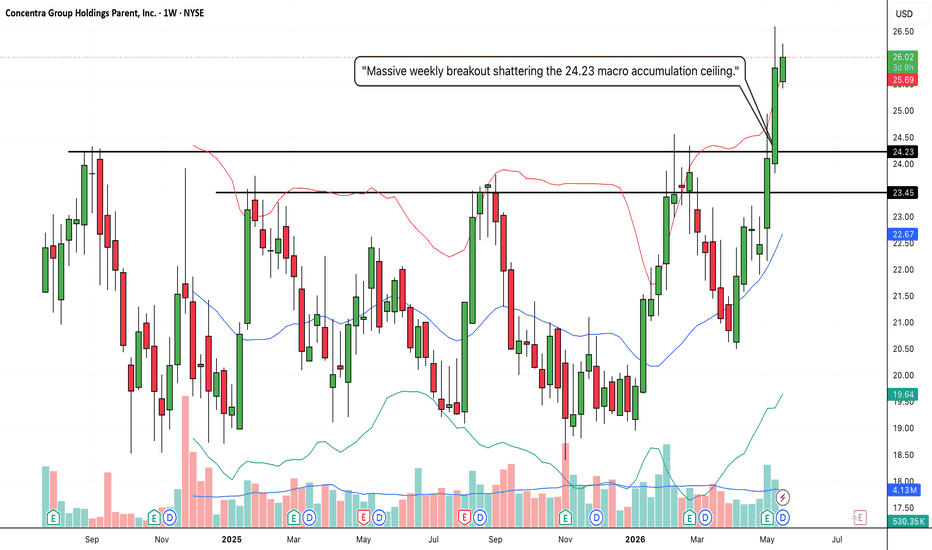
COST:The Macro Cup & Handle and Explosive All-Time High Breakout1. The Macro Perspective: The Digestion Bowl
I am taking a LONG bias on Costco Wholesale Corporation (COST) on the weekly (1W) timeframe.
When analyzing pure market structure, the healthiest and most sustainable secular trends require proportional digestion phases. Look at the massive structural development spanning the center of this chart. After establishing a historical peak at the solid black 1,066.96 line, the stock was technically exhausted. However, instead of collapsing into a bear market, institutional capital facilitated a highly controlled, multi-month markdown phase. The stock washed out down toward the 800 level, shaking out weak hands, before finding a concrete floor. Over the ensuing months, it carved out a massive "Cup" or rounding bottom, systematically marching right back up to challenge the scene of the crime.
2. The Educational Setup: The 20 SMA Pressure Cooker Handle
To understand the sheer strength of this current breakout, look at how the price systematically transitioned from accumulation back into a markup phase right at the ceiling:
The High-Level Squeeze: When the price reached the ultimate macro neckline at 1,066.96, amateur traders expected a brutal double-top rejection. Instead, institutional buyers aggressively defended the structure. They absorbed supply and forced the price to chop sideways in a tight range just below the resistance, establishing a structural "Handle."
The Dynamic Trampoline: Look closely at the handle formation. Every minor dip was perfectly bought right at the rising 20 SMA (the middle blue line of your Bollinger Bands). Consolidating tightly between a flat resistance ceiling and a rising moving average creates the ultimate pressure cooker. It gracefully transfers shares from impatient retail traders taking profits to strong-handed institutional buyers, allowing the bands to squeeze and storing immense kinetic energy.
3. Current Price Action: Blue Sky Territory
Look at the most recent weekly candle on the far right. The pressure cooker has absolutely exploded. Buyers have effortlessly shattered the 1,066.96 macro ceiling with a massive green momentum expansion candle, pushing the price well into the 1,070s. Furthermore, the price is now aggressively pushing against the upper Bollinger Band, forcing a volatility expansion. By decisively clearing this massive accumulation zone, COST has officially entered "Blue Sky Territory" (pure price discovery). All historical overhead supply has been completely eliminated.
4. The Trade Plan: Entries, Targets, and Risk Management
Entry Strategy: Momentum is exceptionally strong right now near 1,076.47. Chasing a massive vertical expansion candle breaking into new highs carries the risk of an agonizing intraday or daily drawdown as the stock naturally breathes. The highest-probability, lowest-risk entry involves stepping down to a daily timeframe and placing limit orders to catch a potential minor structural pullback to perfectly retest the 1,060.00 to 1,070.00 breakout zone. Letting that old, heavy historical resistance prove itself as a new, indestructible support floor offers a phenomenal risk-to-reward ratio.
Take Profit (Targets): We use measured structural targets based on the depth of the macro base. By taking the depth of the massive Cup (roughly 260+ points from the ~800 floor up to the 1,066.96 ceiling) and projecting it upward from the breakout line, our primary structural macro target sits comfortably in the 1,325.00 to 1,350.00 zone.
Invalidation (Stop Loss): A macro breakout thesis is only valid if the new market structure holds. A hard stop loss should be placed safely below the 20 SMA and inside the recent handle consolidation, around the 980.00 to 1,000.00 level. A definitive weekly close completely back inside the old accumulation base and breaking below the moving average would act as a massive warning sign of a failed macro breakout and a severe bull trap.
5. Time Horizon:
Because this technical setup is built on a 1-Week chart capturing a massive structural phase transition and Cup & Handle completion, this is a medium-to-longer-term position trade designed to capture a secular markup phase. Let the macro trend run!  Long
Long
DDOG:Multi-Year Rounding Bottom and ExplosiveAll-TimeHighBrekout1. The Macro Perspective: The Brutal Washout and Recovery
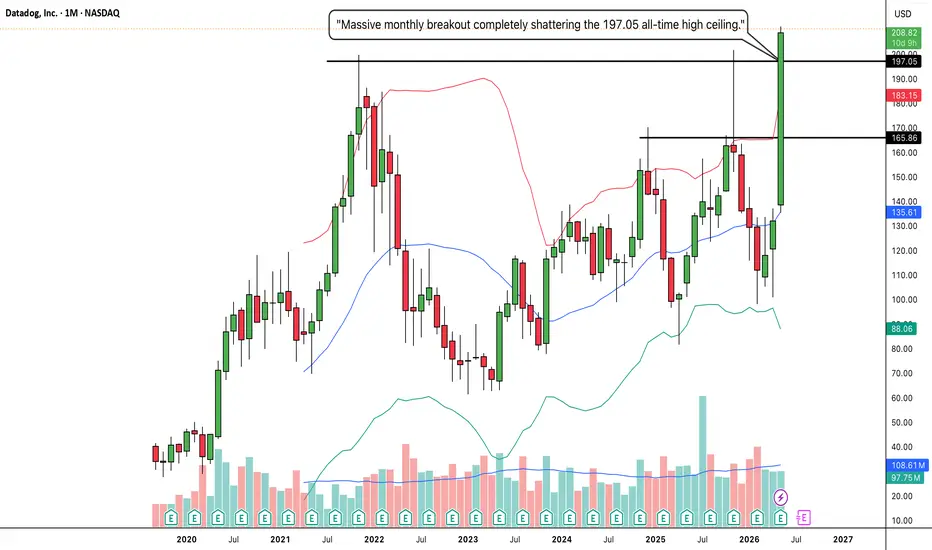
I am taking a LONG bias on Datadog, Inc. (DDOG) on the absolute macro monthly (1M) timeframe.
When analyzing pure market structure on a monthly chart, we are looking at cycles that take years to play out. Look at the massive structural development spanning this entire chart. After establishing a historical peak at the solid black 197.05 line, the stock suffered a brutal, agonizing markdown phase. This deep correction successfully washed out weak hands and forced mass retail capitulation, dragging the price all the way down into the 60s. However, instead of bleeding into a permanent bear market, heavy institutional capital stepped in to establish a concrete floor. Over the last two years, the stock has been quietly carving out an enormous "Rounding Bottom" accumulation phase, systematically riding the 20 SMA (the middle Bollinger Band) to march right back up the chart.
2. The Educational Setup: Conquering the Stepping Stones
To understand the sheer strength of this current breakout, look at how the price systematically transitioned from accumulation back into a markup phase:
The Mid-Level Digestion: The stock's recovery initially faced heavy resistance at the solid black 165.86 line. Instead of suffering a massive rejection, it paused, digested the supply, and formed a high-level consolidation right at the moving average.
The Institutional Urgency: When institutional capital decides it is time to move, they don't wait. Buyers used that mid-level digestion as a launchpad, creating an aggressive, near-vertical surge that refused to give sellers a chance to breathe.
3. Current Price Action: Blue Sky and Volatility Expansion
Look at the most recent monthly candle on the far right. The momentum is absolutely explosive. Buyers have effortlessly shattered both the 165.86 stepping stone and the 197.05 ultimate macro ceiling in a single, massive momentum expansion candle. Furthermore, notice how the price has violently pierced the upper Bollinger Band, forcing the bands to rapidly expand. By decisively clearing this multi-year accumulation zone, DDOG has officially entered "Blue Sky Territory" (pure price discovery). All historical overhead supply has been completely eliminated.
4. The Trade Plan: Entries, Targets, and Risk Management
Entry Strategy: Momentum is exceptionally strong right now near 208.82. Chasing a massive vertical expansion candle riding completely outside the monthly Bollinger Bands carries a severe risk of an agonizing drawdown as the stock naturally breathes. The highest-probability, lowest-risk entry involves stepping down to a weekly or daily timeframe and waiting for the dust to settle. Look to place limit orders to catch a potential minor structural pullback to perfectly retest the 195.00 to 200.00 breakout zone. Letting that old all-time high resistance prove itself as a new, indestructible support floor offers a phenomenal risk-to-reward ratio.
Take Profit (Targets): We use measured structural targets based on the depth of the macro base. By taking the depth of the massive Rounding Bottom (roughly 130 points from the ~65 floor up to the 197.05 ceiling) and projecting it upward from the breakout line, our primary structural macro target sits comfortably in the 325.00 to 330.00 zone. Immediate psychological milestones are 250.00 and 300.00.
Invalidation (Stop Loss): A macro breakout thesis is only valid if the new market structure holds. A hard stop loss should be placed safely below the 197.05 breakout line and the 165.86 mid-level pivot, around the 150.00 to 155.00 level. A definitive monthly close completely back inside the old accumulation base would act as a massive warning sign of a failed macro breakout and a severe bull trap.
5. Time Horizon:
Because this technical setup is built on a 1-Month chart capturing a massive structural phase transition and All-Time High breakout, this is a long-term position trade designed to capture a secular markup phase over the coming months. Let the macro trend run!  Long
Long
VRSN:Textbook Macro Break & Retest and ExplosiveV-ShapedBreakout1. The Macro Perspective: The Perfect Break and Retest
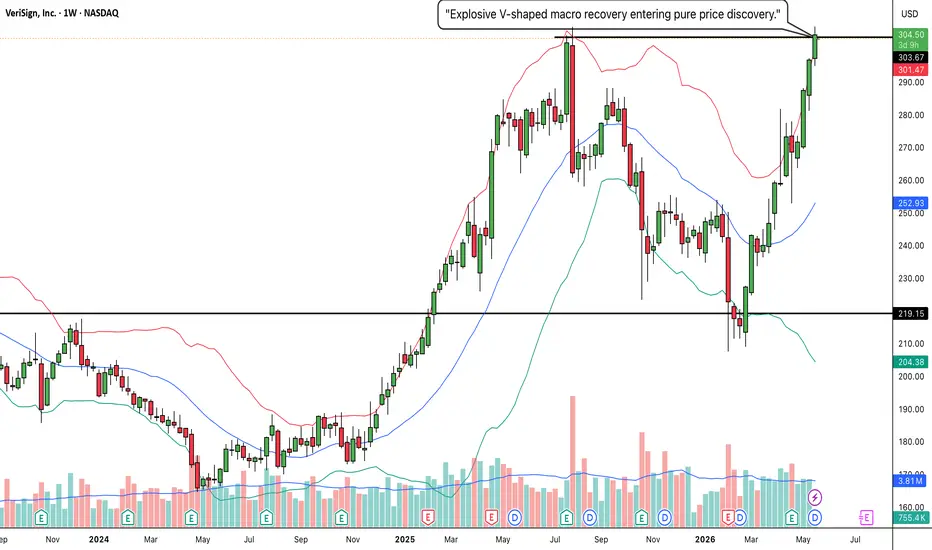
I am taking a LONG bias on VeriSign, Inc. (VRSN) on the weekly (1W) timeframe.
When analyzing pure market structure, the most lucrative macro trends are built on indestructible foundations. Look at the massive structural development spanning this entire chart. Previously, the stock was capped by the solid black resistance line at 219.15. When it finally broke out, it initiated a massive, parabolic run all the way up to the 305 zone. Naturally, that kind of momentum causes severe exhaustion. The stock suffered a brutal, highly volatile washout phase. But look exactly where the bleeding stopped. The price crashed straight down to the 219.15 line, found a concrete floor, and bounced. It perfectly retested its previous macro resistance, officially flipping it into indestructible support.
2. The Educational Setup: The Aggressive V-Shaped Right Side
To understand the sheer strength of this current breakout, look at how the price behaved after that massive 219.15 retest:
Institutional Urgency: After a deep washout, stocks usually chop sideways for months to build a rounded base. VRSN completely ignored that playbook.
The V-Shape: Institutional capital stepped in with extreme aggression, creating a V-shaped recovery. Buyers forced the price straight back up the right side of the chart, completely bypassing mid-level resistance and marching directly back to the ultimate macro ceiling at the solid black 304.50 line.
3. Current Price Action: Riding the Upper Band into Blue Sky
Look at the most recent weekly candles on the far right. The recovery has successfully converted into an explosive breakout. Buyers have effortlessly shattered the 304.50 macro ceiling with a strong green momentum expansion candle. Furthermore, notice how the price has violently pierced the upper Bollinger Band, forcing the bands to rapidly expand upward. By decisively clearing this massive multi-month ceiling, VRSN has initiated a powerful volatility expansion and officially entered "Blue Sky Territory" (pure price discovery).
4. The Trade Plan: Entries, Targets, and Risk Management
Entry Strategy: Momentum is exceptionally strong right now near 305.31. Chasing a massive vertical expansion candle riding outside the weekly Bollinger Bands always carries a higher risk of an agonizing intraday or daily mean-reversion pullback. The highest-probability, lowest-risk entry involves stepping down to a daily timeframe and placing limit orders to catch a potential structural pullback to perfectly retest the 300.00 to 305.00 breakout zone. Letting that heavy historical resistance prove itself as a new support floor offers a phenomenal risk-to-reward ratio.
Take Profit (Targets): We use measured structural targets based on the depth of the massive macro base. By taking the depth of the washout (roughly 85 points from the 219.15 floor up to the 304.50 ceiling) and projecting it upward from the breakout line, our primary structural swing target sits comfortably in the 385.00 to 390.00 zone. The massive 350.00 mark will act as the immediate psychological magnet.
Invalidation (Stop Loss): A V-shaped macro breakout thesis is only valid if the new market structure holds. A hard stop loss should be placed safely below the breakout line and the rising 20 SMA (middle Bollinger Band), around the 260.00 to 270.00 level. A definitive weekly close completely back inside the old base and breaking below 250.00 would act as a massive warning sign of a failed macro breakout and a severe bull trap.
5. Time Horizon:
Because this technical setup is built on a 1-Week chart capturing a massive structural break-and-retest followed by a V-shaped recovery, this is a medium-to-longer-term position trade designed to capture the explosive new markup phase. Let the macro trend run!  Long
Long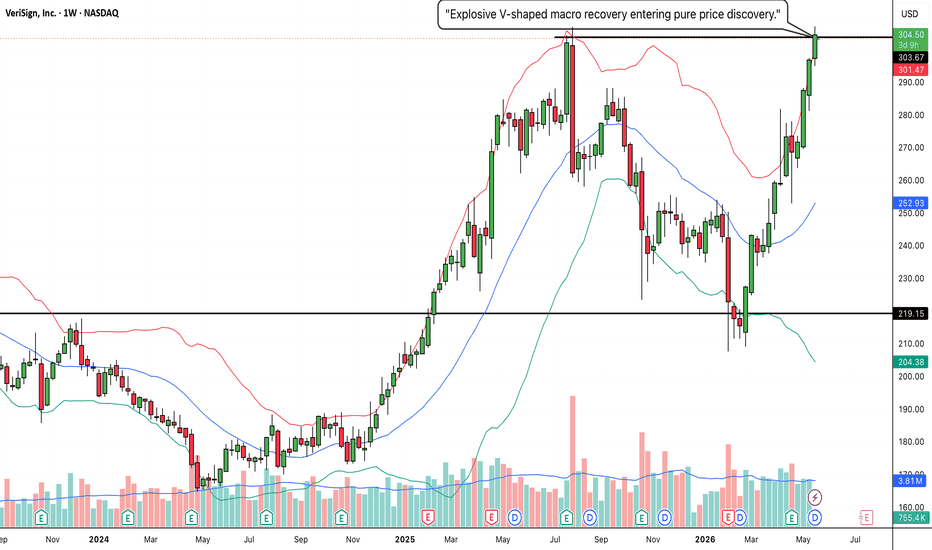
 Long
Long
 Long
Long
 Long
Long