Long
Long
 Long
Long
 Long
Long
Long 
Is Kratos Defense the Ultimate Space Warfare Stock?Global conflict shifts toward autonomous systems and orbit-based warfare in 2026. Savvy investors are focusing on Kratos Defense & Security Solutions (NASDAQ: KTOS). High-profile backers like Cathie Wood’s Ark Invest recently purchased $9.1 million of Kratos stock. Kratos also just won a prime $100 million sole-source Space Domain Awareness contract. Kratos is rapidly becoming a premier supplier for national defense recapitalization. This article analyzes how Kratos positions itself to lead modern defense across multiple sectors.
Geopolitics and Geostrategy
Great power competition drives the current geopolitical landscape. The United States, China, and Russia fight for dominance in orbit. Space is now a contested combat domain. Consequently, geostrategy demands continuous orbital tracking and threat detection. Kratos’s ground-based space monitoring networks provide vital intelligence. These systems protect US strategic satellites from adversarial interference. By securing orbital communication lines, Kratos fundamentally shapes global power balances. The company ensures allied nations maintain operational superiority in high-stakes environments.
Macroeconomics and Economics
High defense spending remains a global macroeconomic certainty. Governments globally prioritize military readiness over other fiscal concerns. This environment shields defense contractors from broader economic recessions. Kratos reports impressive financial performance in 2026. The company forecasts full-year revenues between $1.7 billion and $1.76 billion. High capital expenditures represent a strategic investment in scaling production. Kratos converts its record-high order backlog into highly profitable revenue streams. Investors value Kratos as a high-growth asset in a volatile economy.
Industry Trends and Business Models
Legacy defense firms construct expensive, slow-to-build hardware. In contrast, Kratos embraces a disruptive commercial business model. The company prioritizes affordability as its core technology. Kratos designs systems up front for rapid, low-cost mass production. The Pentagon increasingly demands cheaper, disposable hardware. This industry trend perfectly aligns with Kratos’s portfolio. Kratos manufactures low-cost jet drones like the XQ-58 Valkyrie. The company also produces affordable Spartan turbojet engines. This model allows rapid scaling to meet surging global demand.
Management, Leadership, and Company Culture
CEO Eric DeMarco advocates a culture of bold innovation. Kratos operates like a venture-backed tech startup. Leadership focuses on internally funded research and development. This strategy bypasses sluggish government development timelines. Management executes decisions rapidly to outpace larger rivals. Employees share a mission-driven culture focused on national security. Leadership designs the workspace to attract top-tier aerospace engineers. Kratos nurtures an environment where fast execution drives strategic success.
Technology, High-Tech, and Science
Kratos operates at the absolute cutting edge of aerospace science. The company develops hypersonic vehicles and advanced propulsion systems. Kratos recently selected Indiana for its Project Helios test facility. This mid-tier coupled arc jet facility accelerates hypersonic testing. Furthermore, Kratos pioneers virtualized space networks. These software-defined networks replace legacy hardware-heavy systems. Kratos’s high-tech solutions solve complex aerothermal and digital challenges. Scientific rigor keeps Kratos ahead of potential global adversaries.
Cybersecurity and Digital Systems
Modern warfare relies heavily on digital connectivity. However, digital systems invite severe cyber threats from hostile nations. Kratos leads the defense sector in robust cybersecurity solutions. The company builds highly secure satellite ground networks. Kratos encrypts vital telemetry, tracking, and control systems. Its software prevents malicious actors from hijacking military satellites. By securing data flows, Kratos protects global military operations. Cybersecurity remains a foundational pillar of Kratos’s technology stack.
Pharmaceutical and Bio-Defense
No direct link connects Kratos to commercial drug manufacturing. However, Kratos plays an indirect role in biochemical defense. The company manufactures mobile C5ISR shelters with CBRN protection. CBRN stands for chemical, biological, radiological, and nuclear defense. These specialized shelters protect sensitive personnel and medical equipment. They shield critical assets from biological weapons and toxic agents. Kratos protects the research infrastructure that fights biological warfare. In this way, Kratos secures the biodefense and pharmaceutical frontlines.
Patent Analysis and Intellectual Property
Patent analysis highlights Kratos’s aggressive intellectual property strategy. The company holds numerous patents in jet propulsion and telemetry. Kratos systematically patents its modular, low-cost drone designs. This proprietary technology blocks competitors from copying its affordable manufacturing processes. Kratos continuously files new patents in hypersonic design and satellite software. These patents safeguard Kratos’s first-mover advantage in high-growth fields. Investors trust Kratos because its patented innovations secure market dominance.  Long
Long
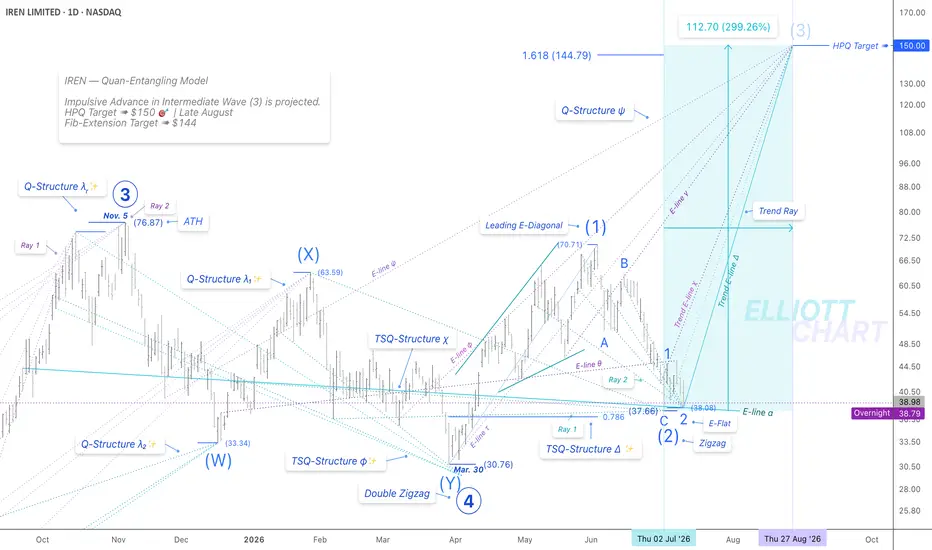
IREN | DailyNASDAQ:IREN — Quan-Entangling Model
Preset for the Projected Impulsive Extension 📈
Quan Analysis
Price is now established at $38, precisely on Trend E-line α (green solid line), interacting beneath the resistance E-line θ within the Transition-Support Quan-Structure χ, while aligning with refined Trend E-line Δ.
The TS Quan-Structure Δ continues to provide firm support through its two Rays ➤ 1 and 2—preserving the trend's origin at $37.66 through Ray 1, while defining a high-probability turning point at $38.08 through Ray 2, at the precise confluence of Trend E-lines α and Δ, forming the pivotal point of this Quan-Entangled Model.
With the trend root now established, the Trend Ray appears fully set for the projected Cymatic Trendflow of the Intermediate Wave (3) extension📈.
EW Analysis
Following a Double Zigzag in Primary Wave ⓸, IREN surged approximately 130%, expanding through a Leading Diagonal Intermediate Wave (1), followed by an approximately 78% retracement in Intermediate Wave (2). A relatively deep retracement typically follows a leading diagonal in a Wave (1) position.
Respecting $37.66 as the extreme low of Intermediate Wave (2), the completion of Minor Wave 1, followed by an Expanded Flat Minor Wave 2, sets the stage for the projected impulsive advance phase in Intermediate Wave (3) extension within the expanding Primary Sequence ⓹.
🔖 It's worth noting that every major turning point on the daily chart since early November has been identified with high precision through the defined Quan-Structures λᵣ, λ₁, λ₂, φ, and currently Δ⋆˚࿔༄ ✰.⋆
#StrategicAnalysis #FutureVision #TrendAnalysis #SmartInvesting #MarketInfrastructure #QuanAnalysis #QuantumEntanglement #TrendFlow #CymaticTrendflow  Long
Long
AbCellera Biologics Inc. Common Shares (ABCL) 1WNASDAQ:ABCL
On the weekly timeframe, a strong long setup is forming, marking the end of a multi-year downtrend and the formation of a solid base for medium-term growth. The key technical argument is the classic mirror level in the 5.32–5.80 range, which previously held back buyers for a long time and is now successfully being tested from above as a new support zone.
The bullish case is strengthened by price holding above all key moving averages, which are now turning upward, forming an additional protective shield for the uptrend. A clean impulsive breakout from the global descending trendline has been confirmed, so the current consolidation represents a healthy technical retest of the broken structure.
Position building is relevant within the current buy zone, where the appearance of long lower wicks on weekly candles clearly confirms that large players are defending this range. The main medium-term profit target is located at strong historical resistance around 14.97 dollars, which, given current entry levels, offers an excellent risk-to-reward ratio.
This analysis is for informational purposes only and does not constitute individual investment advice. Proper risk management is required.  Long
Long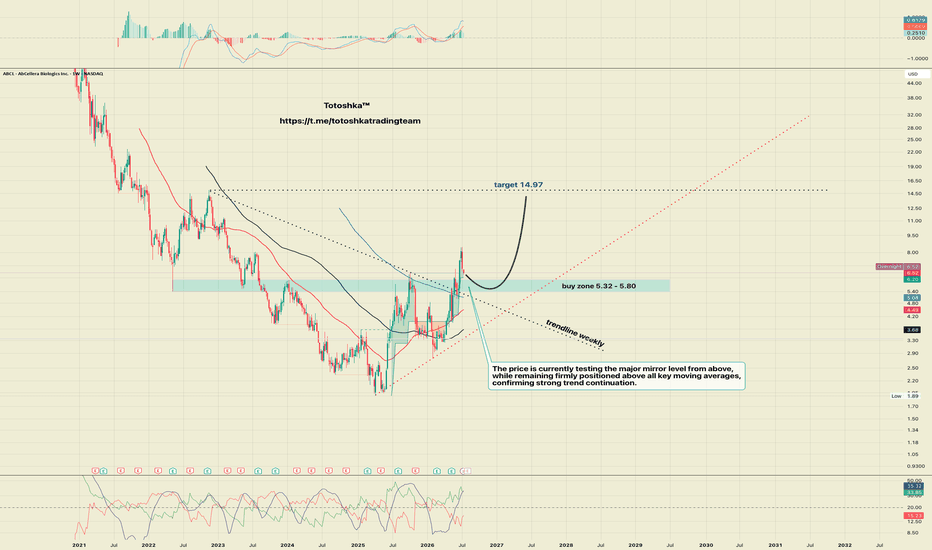
TSLA H1 MAP: 8.2/10 Wall at 415 vs Strong 389 Support▪️ TSLA H1 SNAPSHOT — EXECUTIVE SUMMARY
▪️ TSLA is currently trading near 394.79, hovering just above a strong support shelf after being rejected from the heavy supply cluster overhead. Market structure is consolidating, with price boxed between a well-defended floor below and a stack of stiff resistance above.
▪️ Primary outlook is neutral-to-cautious — the reaction at 389 is the key tell. While that shelf holds, buyers can attempt another push into resistance; losing it flips momentum lower toward the deeper demand zone.
▪️ Key resistance zone: 415, where sellers have defended 41 times — the strongest ceiling on the chart — and are expected to lean hard on first test. Above that sits a dense band at 426, 436, then 444.
▪️ Major defense line: 389 — a strong level at 24 retests. Holding here keeps the range intact; a decisive break below opens the door for a corrective slide.
▪️ Primary downside targets: 366, then 354.40, where liquidity and demand are stacked.
▪️ Major liquidity magnet below: 366–354 — this zone could trigger a strong bounce or reversal once tested.
▪️ Bullish scenario: If buyers hold 389 and reclaim 415, the path opens toward 426, with 436 as the extended upside objective.
▪️ KEY LEVELS
RESISTANCEs
▪️ 444.00 — ★ 5.6 Weak · 46 retests
▪️ 436.00 — ★★★ 7.8 Strong · 21 retests
▪️ 426.00 — ★ 4.7 Weak · 50 retests
▪️ 415.00 — ★★★★ 8.2 Very Strong · 41 retests
▪️ Current Price: 394.79
SUPPORTs
▪️ 389.00 — ★★★ 7.7 Strong · 24 retests
▪️ 366.00 — ★★★ 7.3 Strong · 14 retests
▪️ 354.40 — ★ 4.6 Weak · 19 retests
ProjectSyndicate Levels Desk — Overview of key S/R zones for TSLA, NVDA, NQ, ES, GC & JPN225 traders every week. Subscribe to stay up to date with the latest levels.  Long
Long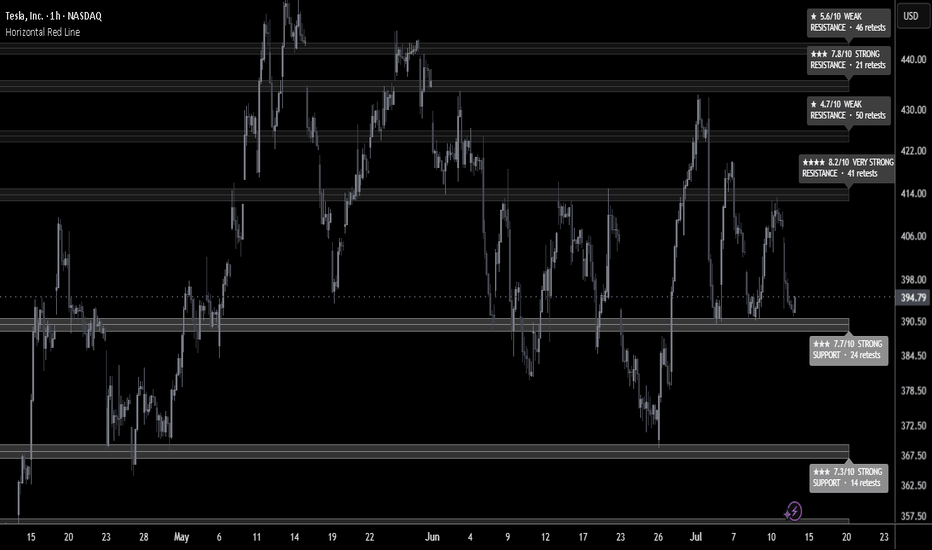
 Long
Long
NVDA Pinned Between 200 and 212 - 218 or 184 up next?▪️ NVDA H1 SNAPSHOT — EXECUTIVE SUMMARY
▪️ NVDA is currently trading near 203.54, holding just above a strong support shelf after failing to reclaim overhead supply. Market structure is consolidating, with price pinned between a well-defended floor below and moderate resistance above.
▪️ Primary outlook is neutral-to-constructive — the reaction at 200.00 is the key tell. While that shelf holds, buyers can attempt another push higher; losing it exposes the deeper demand stack below.
▪️ Key resistance zone: 212.00, where sellers have defended 18 times and are expected to lean again on first test. Above that sits 218.00 as the extended ceiling.
▪️ Major support / defense line: 200.00 — a strong level at 22 retests. Holding here keeps the bullish attempt alive; a decisive break below opens the door for a corrective slide.
▪️ Primary downside targets: 190.50, then 184.50, where liquidity and demand are stacked.
▪️ Major liquidity magnet below: 184.50–178.70 — this zone could trigger a strong bounce or reversal once tested.
▪️ Bullish scenario: If buyers reclaim and hold above 212.00, the path opens toward 218.00 as the primary upside objective.
▪️ KEY LEVELS
RESISTANCEs
▪️ 218.00 — ★ 4.5 Weak · 9 retests
▪️ 212.00 — ★★ 6.4 Moderate · 18 retests
▪️ Current Price: 203.54
SUPPORTs
▪️ 200.00 — ★★★ 7.3 Strong · 22 retests
▪️ 190.50 — ★★★ 7.7 Strong · 32 retests
▪️ 184.50 — ★ 4.6 Weak · 46 retests
▪️ 178.70 — ★ 4.5 Weak · 48 retests
ProjectSyndicate Levels Desk — Overview of key S/R zones for NVDA, NQ, ES, GC & JPN225 traders every week. Subscribe to stay up to date with the latest levels.  Long
Long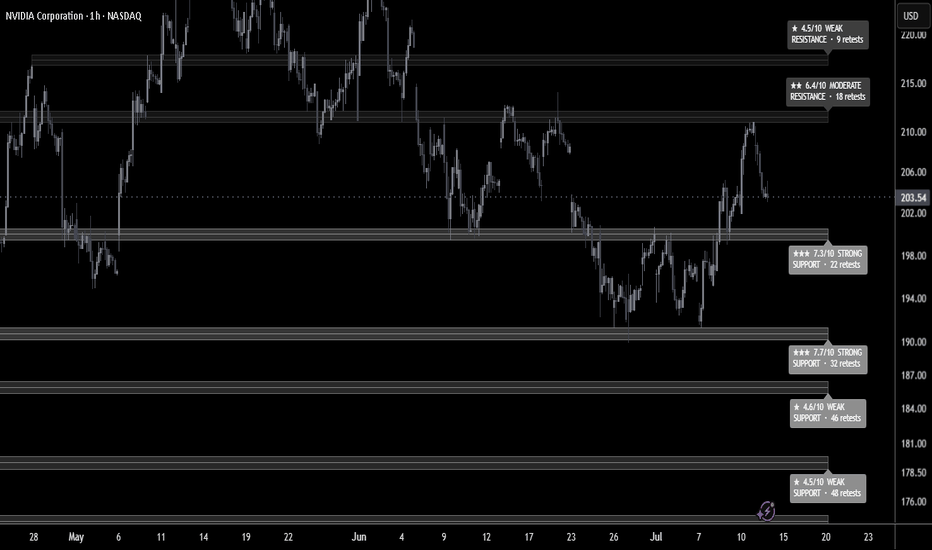
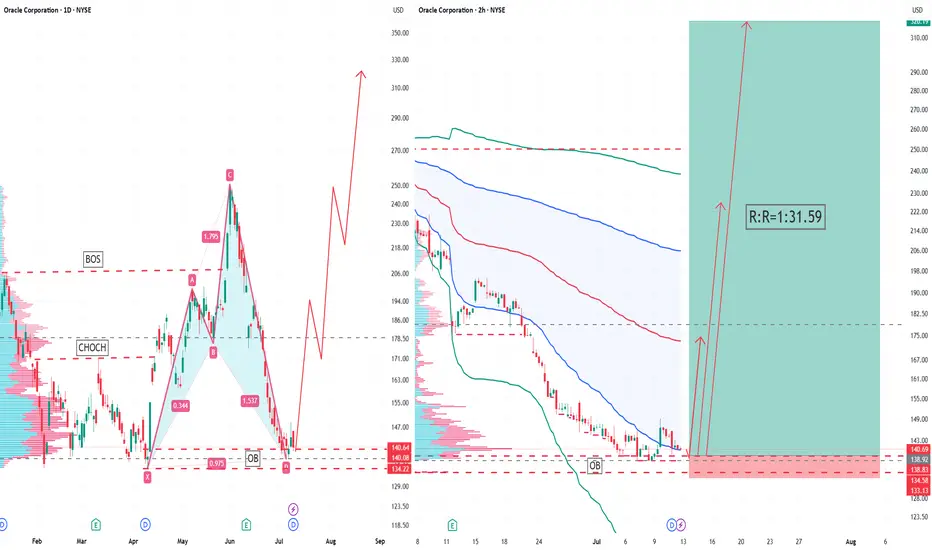
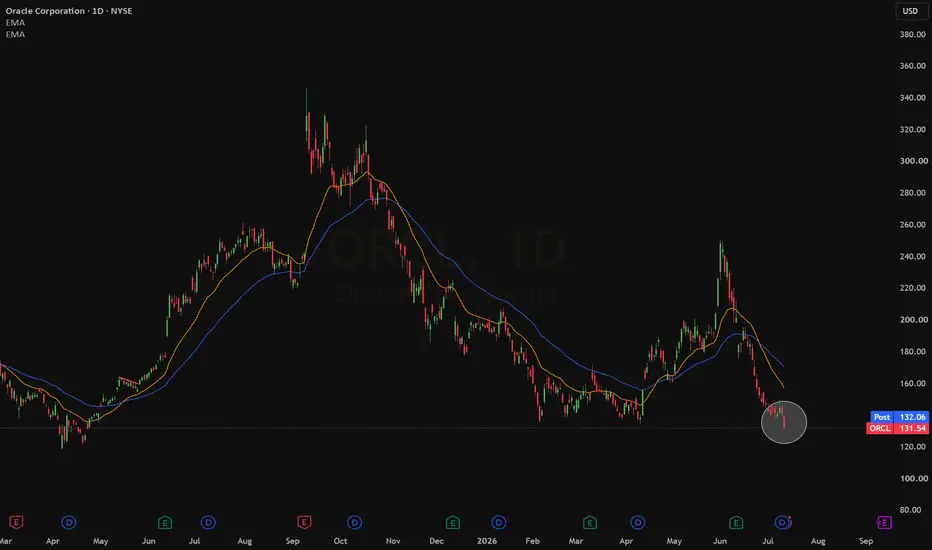
Oracle Plunges to 52-Week Low Amid Broad Sell-Off!Oracle Corporation has experienced a brutal and unrelenting sell-off over the past four weeks, with its stock price eroding by approximately 28% to settle at a daunting 52-week nadir near the $132 mark. This precipitous decline represents one of the most severe drawdowns for the legacy tech giant in recent memory, as the market continues to punish the stock amidst a confluence of internal financial anxieties and shifting sector-wide investment preferences. The magnitude of this drop has not only erased substantial shareholder wealth but has also placed Oracle firmly in the spotlight as a bellwether for the growing bifurcation within the broader artificial intelligence and cloud computing landscape.
The bearish sentiment currently gripping Oracle is fueled by several critical and interrelated headwinds that have rattled even the most steadfast institutional investors. Foremost among these are mounting anxieties regarding extreme customer concentration, which leaves the company's recurring revenue streams dangerously vulnerable to churn, pricing renegotiations, or sudden budget cuts from its largest enterprise clients. Should any of these major accounts scale back their commitments, Oracle's top-line growth could face immediate and substantial headwinds. Additionally, analysts have flagged significant projected free cash flow deficits, raising serious eyebrows about the sustainability of Oracle's aggressive and capital-intensive infrastructure build-out, which is necessary to compete in the generative AI arms race but comes at a staggering near-term cost. Compounding these financial strains is the looming threat of equity dilution, as the firm may be compelled to issue additional shares to finance its expansive data center upgrades and acquisition strategies, thereby eroding existing shareholder value and applying further downward pressure on earnings per share.
Interestingly, the market reaction to Oracle's cloudy outlook and subsequent downgrade has created a stark dichotomy within the broader AI-cloud ecosystem, effectively splitting the sector into two distinct narratives. On one hand, asset-light software names, exemplified by high-growth enterprises like Cloudflare and Snowflake, have managed to capture upward momentum and relative strength. Investors appear to be gravitating toward their scalable, high-margin, subscription-based business models, which require far less physical infrastructure investment to generate growth. Conversely, capital-expenditure-heavy enterprises—burdened by the substantial hardware, real estate, and data center costs required to deploy next-generation AI capabilities—have continued to languish in the wake of Oracle's struggles. This divergence underscores a market that is increasingly penalizing companies with hefty balance-sheet commitments while rewarding those with leaner, more agile operational structures.
Despite this grim near-term price action and the litany of operational risks on the horizon, the overarching sentiment among the sell-side analyst community remains remarkably resilient, constructive, and decidedly bullish. The consensus view continues to project a robust recovery trajectory for Oracle, anchored by a median price target that hovers impressively near $251.85. This optimistic long-term outlook is overwhelmingly supported by the current ratings distribution, which boasts an astonishing 37 buy recommendations standing in stark contrast to a mere solitary sell rating. This glaring disparity suggests that institutional analysts are intentionally looking past the current turbulence, choosing instead to bet on Oracle's fundamental positioning within the enterprise software market, its evolving cloud strategy, and the eventual monetization of its AI investments—provided the company can successfully navigate its current risk profile and restore investor confidence.
From a pure technical analysis perspective, traders and chartists are now closely monitoring key downside support levels to gauge potential stabilization points and possible entry opportunities. The primary psychological and technical floor rests at the $120 level, which historically has acted as a significant demand zone. Should selling pressure persist and breach that threshold, subsequent safety nets are identified at $100 and finally $80, representing deeper retracement levels that would signal severe capitulation. On the upside, a near-to-medium term recovery target has been outlined at $180.00, representing a significant percentage rebound from current depths and a critical resistance level that bulls must conquer to reverse the prevailing downtrend. Ultimately, while the data warrants a cautious stance given the identified operational and financial risks, the glaring chasm between Oracle's current distressed valuation and the lofty consensus analyst forecasts underscores a high-stakes battleground for bulls betting on a dramatic reversal versus bears anticipating further erosion in the months ahead.  Long
Long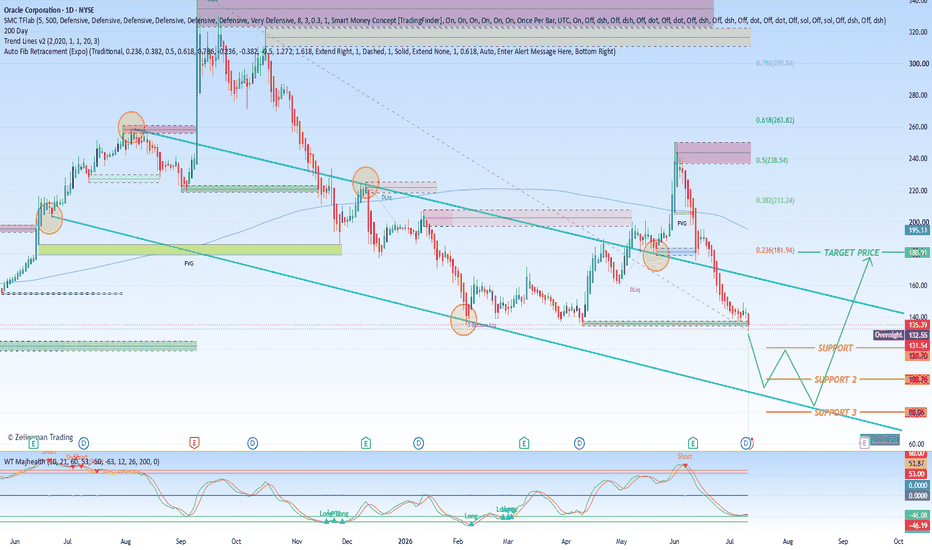
Long 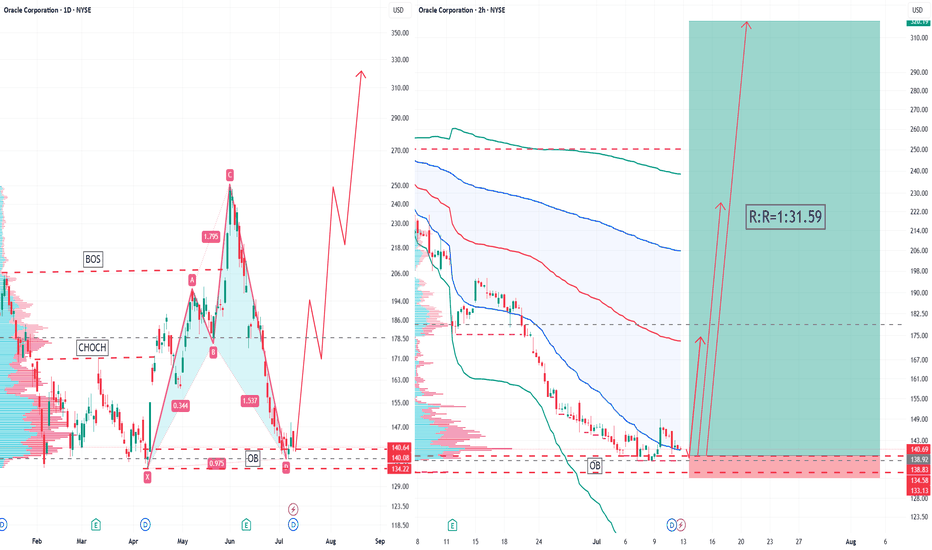
ONDS Stock Plunges to Seven-Month Low Amid Dilution Fears!Ondas Holdings has found itself entrenched in a prolonged and punishing slump, extending its losing streak to six consecutive weeks as the autonomous systems developer's share price cascaded to a seven-month nadir of $7.26 per share. This relentless downward trajectory, which has shaved considerable value off the company's market capitalization, arrives at a peculiar inflection point: while the stock chart paints a grim picture of sustained selling pressure, a closer examination of the underlying business reveals a flurry of strategic activity, transformative acquisitions, and burgeoning defense contracts that have convinced a vocal segment of retail investors to view this trough as a potential springboard rather than a sinking ship.
Market Pressures and Dilution Concerns Fuel the Selloff
The primary drivers behind this protracted slide appear to be rooted more in capital-market mechanics than in any fundamental deterioration of Ondas' operational performance. The sell-off intensified after the company executed several aggressive acquisition moves, which, while strategically sound in expanding its technological capabilities, necessitated a significant expansion of its outstanding share base. To finance its rapid growth ambitions, Ondas increased its authorized share count, triggering widespread investor trepidation over potential dilution. This concern over equity overhang has weighed heavily on sentiment, as existing shareholders brace for the possibility that future issuances could erode per-share earnings and dilute their current stakes. Consequently, even as the company posts encouraging operational milestones, the specter of supply-side pressure has overwhelmed bullish narratives, driving the stock to levels not witnessed since the closing months of 2025.
Transformative Acquisition Reshapes Ondas' Defense Footprint and Financial Trajectory
In a strategic masterstroke aimed at vaulting Ondas into the upper echelons of the defense-tech arena, the company recently finalized its monumental $875.8 million acquisition of DZYNE Technologies. This deal, which represents one of the most significant consolidations in the counter-drone and autonomous aerospace sector, brings under Ondas' umbrella a well-established defense enterprise specializing in long-endurance autonomous aircraft and advanced counter-unmanned aerial systems (counter-UAS). Structurally, the transaction was financed through a balanced mix of $200 million in cash and $675 million in equity, reflecting a blend of financial prudence and strategic leveraging of Ondas' stock currency. Critically, DZYNE arrives with a distinct competitive advantage that distinguishes it from many early-stage drone startups: the business boasts existing operational infrastructure, mature customer relationships, and, perhaps most importantly, positive EBITDA. This profitability profile stands in stark contrast to the cash-burning norms of the industry, providing Ondas with an immediate lift in financial health and operational credibility.
Elevated Revenue Guidance Signals a New Era of Growth
Buoyed by the integration of DZYNE's robust revenue streams and its expansive contract pipeline, Ondas has responded with a significantly upgraded financial outlook. Management has now raised its 2026 revenue expectations to a minimum of $525 million, representing a substantial 34% increase over the company's previous internal projections. This upward revision not only underscores the accretive nature of the acquisition but also signals a powerful acceleration in Ondas' top-line growth trajectory, positioning the combined entity as a formidable player capable of capturing a larger share of the rapidly expanding defense and security markets.
High-Profile Contracts and Strategic Alliances Bolster Long-Term Prospects
Beyond the acquisition-driven momentum, Ondas' wholly owned Sentrycs subsidiary is actively carving out a prominent niche in the global counter-drone landscape. The division recently secured pivotal contracts to provide comprehensive airspace protection and threat-detection capabilities during the highly anticipated 2026 FIFA World Cup, a marquee event that will thrust Sentrycs' technology onto an international stage, demonstrating its efficacy in securing large-scale public venues against emerging drone-based threats. Furthermore, Ondas has forged a strategic collaboration with defense prime contractor Lockheed Martin (LMT) to integrate Sentrycs' proprietary counter-drone technology into a broader, next-generation defense platform designed to detect, track, and neutralize hostile unmanned aircraft. This partnership not only validates the technical sophistication of Ondas' offerings but also opens the door to substantial future procurement opportunities across military and governmental channels.
Retail Sentiment Turns Bullish Amid the Volatility
Against this complex backdrop of short-term stock erosion and long-term transformational growth, retail traders congregating on the Stocktwits platform have largely shrugged off the prevailing market pessimism. Many vocal members of this community have branded the seven-month low as a "rare opportunity" to accumulate shares at what they perceive to be a deeply discounted valuation relative to the company's intrinsic potential. For these investors, the current sell-off represents a classic overreaction to transient dilution anxieties, obscuring the formidable value inherent in Ondas' expanding defense portfolio, its rising revenue guidance, and its strategic positioning at the forefront of the autonomous security revolution. Whether this contrarian bet pays off remains to be seen, but the fervent conviction among retail holders underscores a compelling narrative of high-risk, high-reward speculation at the intersection of defense technology and next-generation aviation.
 Long
Long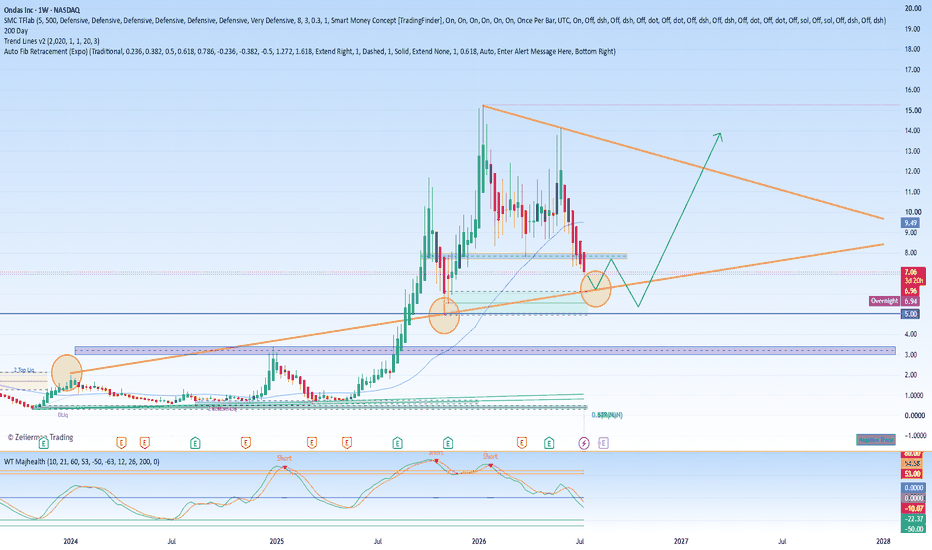
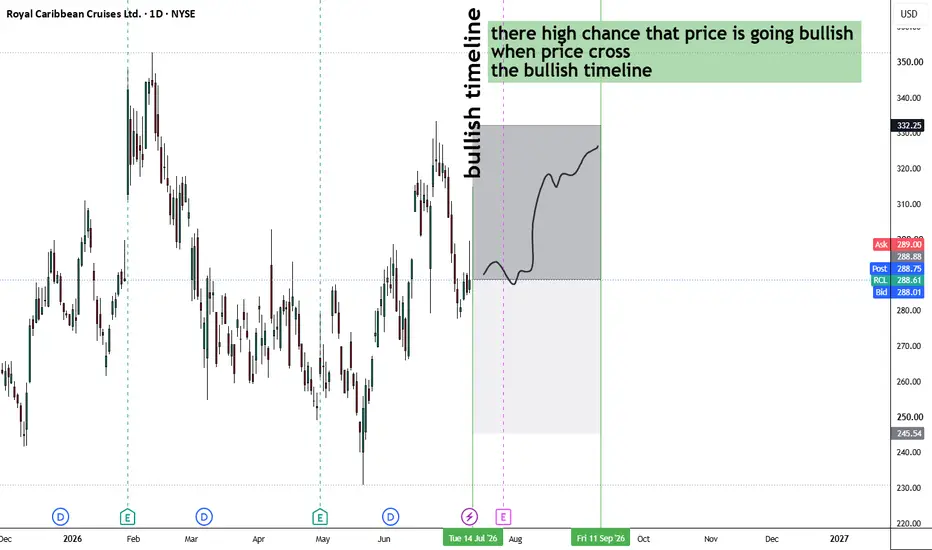
RCLBullish Analysis: Royal Caribbean Group (NYSE: RCL)
Royal Caribbean remains one of the strongest companies in the global travel and leisure sector. Despite macroeconomic concerns, the company continues to outperform peers thanks to exceptional demand, premium pricing, and industry-leading execution.
Why I'm Bullish
1. Record Booking Demand
Booking volumes remain at historically high levels.
Many 2026 sailings were booked well in advance at record prices.
Management has stated that demand recovered quickly even after temporary geopolitical disruptions.
2. Premium Pricing Power
Unlike many travel companies that compete on discounts, Royal Caribbean continues raising prices while maintaining strong occupancy.
This shows:
Strong brand loyalty
High consumer willingness to spend on experiences
Pricing power that supports expanding margins
3. Industry-Leading Fleet
Royal Caribbean's newest ships (Icon Class, Star of the Seas, Legend of the Seas) generate significantly higher onboard spending than older vessels.
New ships offer:
Higher ticket prices
Better fuel efficiency
More onboard revenue
Greater operating margins
This creates a long-term competitive advantage.
4. Strong Financial Momentum
Recent results showed:
Double-digit revenue growth
Earnings beating expectations
Management maintaining confidence in long-term growth despite higher fuel costs.
Continued shareholder returns through dividends and share repurchases.
5. Cruise Industry Tailwinds
Consumers continue prioritizing experiences over goods.
Key trends include:
Millennials becoming a larger share of cruise passengers
Growth in multigenerational family travel
Cruise vacations remaining attractive relative to land-based alternatives.
6. Growth Pipeline
Royal Caribbean continues expanding through:
New Icon-class ships
Exclusive beach clubs and private destinations
Expanded loyalty ecosystem
Additional ship orders extending growth into future years.
Risks
The bullish thesis isn't without risks:
Rising fuel prices can pressure margins.
Economic slowdowns may reduce discretionary travel spending.
Geopolitical events can temporarily affect itineraries and bookings.
The company still carries meaningful debt from the pandemic era, although leverage has been improving.
Investment Thesis
Royal Caribbean has evolved from a post-pandemic recovery story into a high-quality growth company. Strong demand, premium pricing, expanding onboard revenue, and continuous fleet innovation position it well for continued earnings growth. Analysts have also highlighted Royal Caribbean as one of the strongest operators in the cruise industry, expecting continued earnings expansion over the next several years.
Bullish Rating: 8.8/10
Long-term outlook: Bullish
Investment horizon: 12–36 months
The combination of resilient consumer demand, industry-leading execution, and a robust pipeline of new ships makes Royal Caribbean one of the more compelling growth opportunities in the travel sector.  Long
Long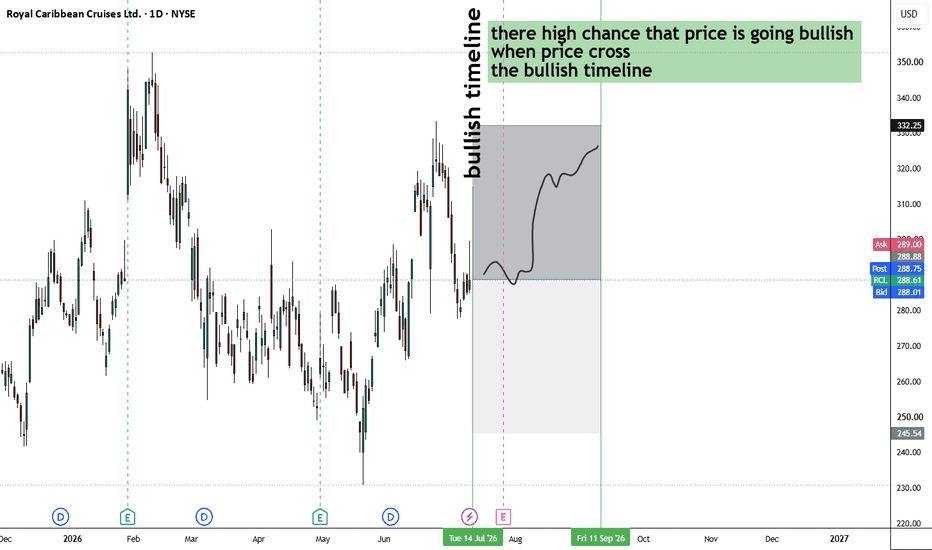
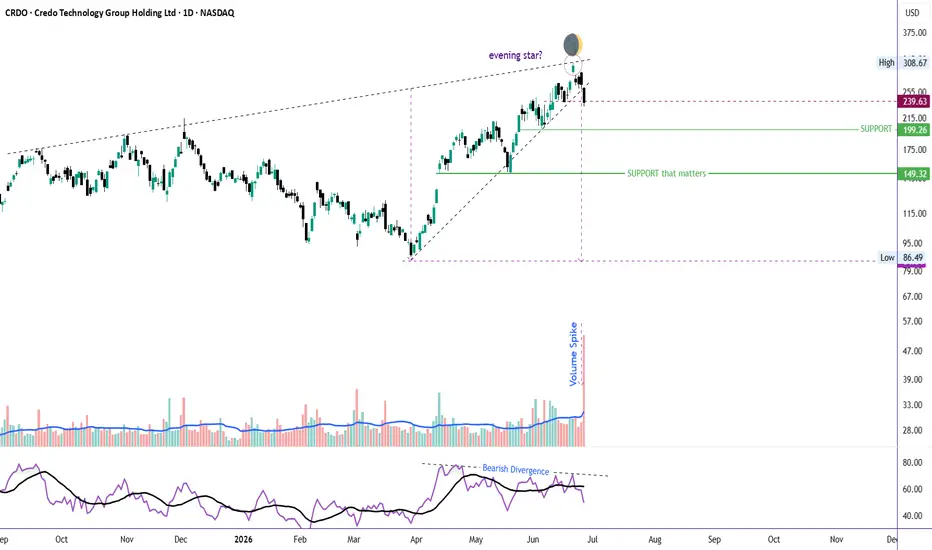
CRDO: Multi-TF Bearish Divergence Signals a Major CorrectionCRDO has hit the target shared previously (see attached post).
Now it appears to be entering a significant corrective phase after an extended bullish run.
The stock has developed bearish divergence on both the Daily and Weekly timeframes, indicating that bullish momentum has been fading despite price making new highs. It recently reached the upper boundary of a rising wedge near 308, where sellers stepped in aggressively.
Adding to the bearish case, price formed an Evening Star reversal pattern, followed by a gap-down session that confirmed the shift in momentum. The subsequent breakdown below the wedge occurred on nearly four times the average daily trading volume, suggesting strong institutional selling rather than routine profit-taking.
In the short term, CRDO could attempt a throwback to retest the breakdown area around 260. However, unless that level is reclaimed decisively, the path of least resistance remains to the downside.
Key support levels to watch are:
199 – First major support
149 – Secondary support
86–90 – Long-term measured target based on the wedge breakdown
Bearish thesis invalidation: A strong daily close above 310 would invalidate the current bearish setup and shift the outlook back in favor of the bulls.
While short-term bounces are always possible, the combination of multi-timeframe bearish divergence, a completed rising wedge breakdown, heavy distribution volume, and a confirmed reversal candlestick pattern suggests that the correction may have only just begun.  Short
Short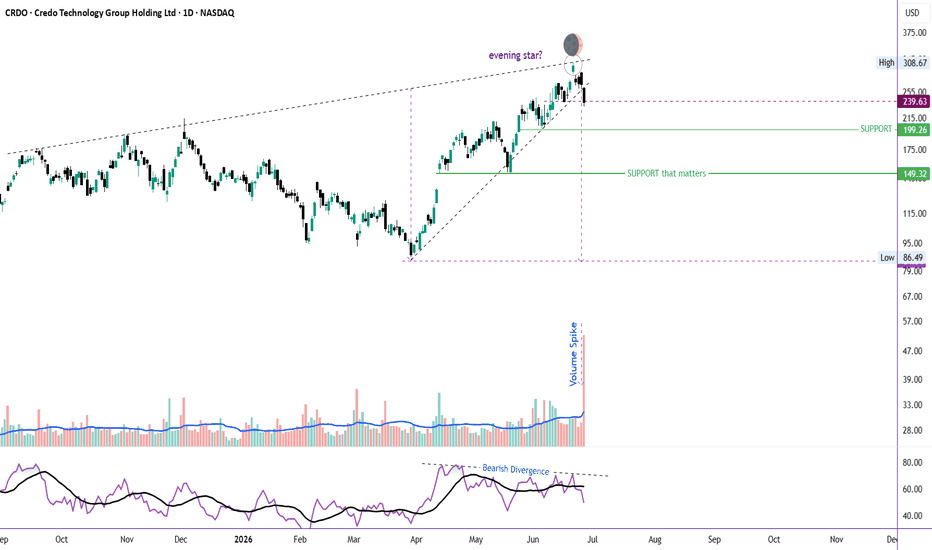
 Long
Long
Short 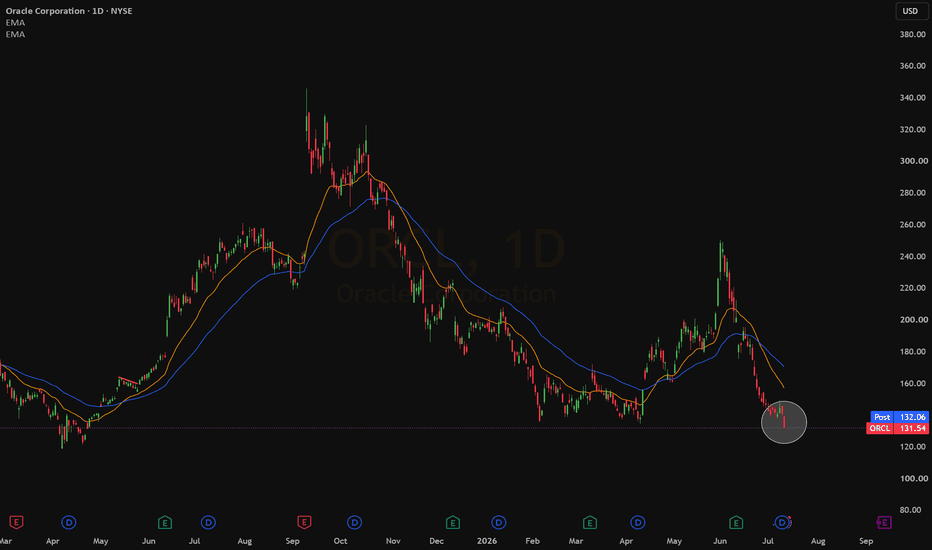
 Long
Long

 Short
Short
Long 
 Long
Long