Long
Long
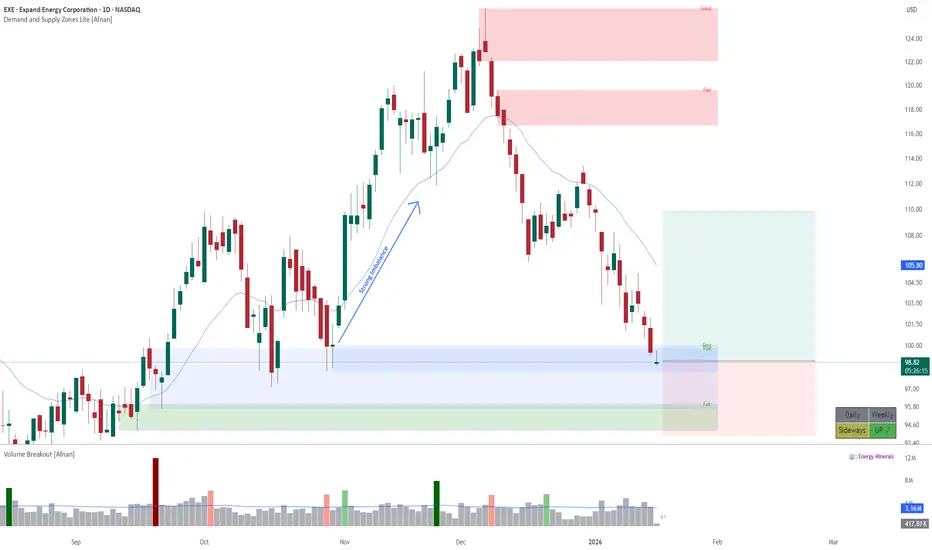
EXE - Institutional Demand at Work: High-Probability Trade Setup🧭 Overall Market Context 🧭
Price is currently trading inside an overlapping demand zone , and the quality of this zone is GOOD . What makes this setup stand out is the very strong follow-through seen when price previously left this area. Such impulsive exits are a clear footprint of institutional participation , where large players are unable to fill all their buy orders at once, leaving pending demand behind.
This return into the same zone gives the market a second chance to react — and these are often the areas where smart money steps in again.
🔍 Zone Quality & Structure 🔍
The structure of the current demand zone adds further confidence to the setup:
The demand zone is fresh and unviolated , meaning price has not yet consumed the pending buy orders.
The leg-out from the zone was impulsive , showing urgency and imbalance in favor of buyers.
Overlapping demand zones are present, which increases the probability of a strong reaction.
Price has now returned deep into the demand zone , which is an ideal location for planning long trades.
From a supply–demand perspective, this is exactly where we want price to be — low risk, high potential.
📈 Trend & Higher Timeframe Alignment 📈
Trend plays a crucial role in probability, and here the bigger picture is clearly supportive:
The weekly timeframe trend is UP , favoring buying opportunities from demand.
There is no higher-timeframe or daily supply zone overhead until the projected target area.
This creates clean upside space , reducing the risk of early rejection.
When demand aligns with the higher-timeframe trend and there is no nearby supply, the odds naturally tilt in favor of continuation.
🎯 Trade Plan & Risk Structure 🎯
A structured plan keeps emotions out of the equation:
Entry : From the current price area inside the demand zone.
Stop Loss : Below the distal line of the lower demand zone.
Target 1 : Minimum 1:2 risk–reward .
Risk here is clearly defined — a key characteristic of professional trade planning.
🧠 Market Logic Behind the Setup 🧠
Strong follow-through confirms institutional interest.
Higher-timeframe uptrend supports continuation.
Clean upside structure reduces friction for price movement.
This is a trend-aligned demand trade , not a counter-trend gamble.
When strong zones meet the right trend and location, probability quietly stacks in your favor.
🚀 Final Thoughts 🚀
This setup reflects the essence of demand and supply trading — clarity, structure, and patience . Trades like these don’t require prediction; they require discipline and alignment.
📉➡️📈 Trade with logic, manage risk with respect, and let probability do the heavy lifting. 💡🔥
Lastly, Thank you for your support, your likes & comments. Feel free to ask if you have questions.
This analysis is purely for educational purposes only and should not be considered as trading or investment advice..
 Long
Long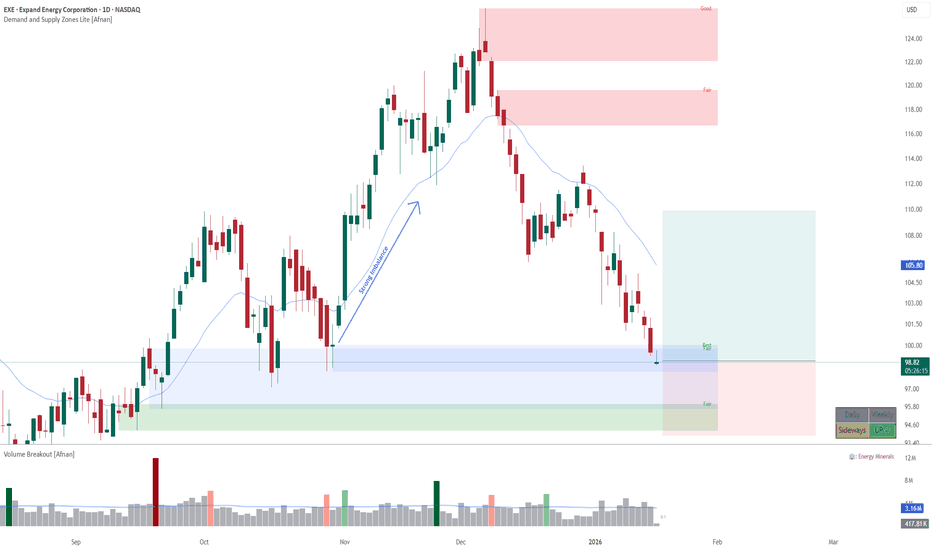
 Long
Long
 Education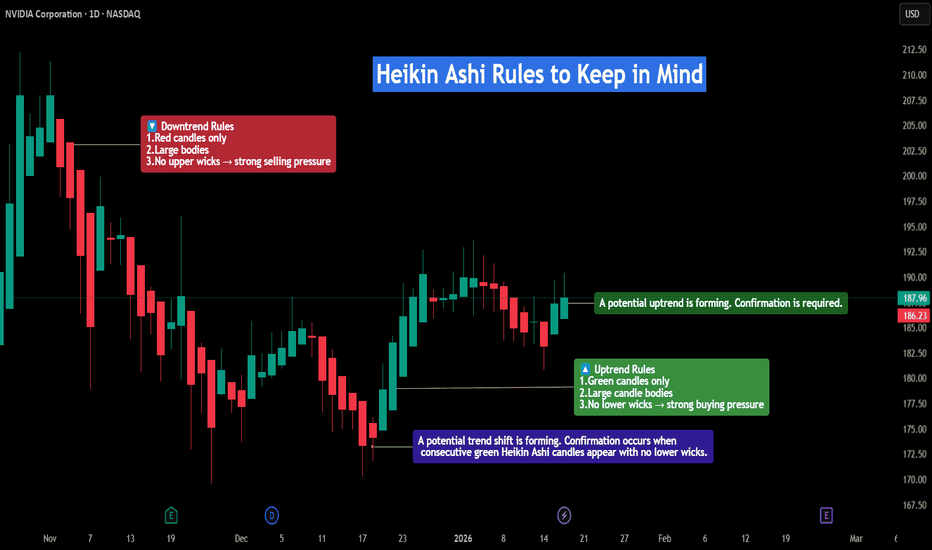
 Long
Long
 Long
Long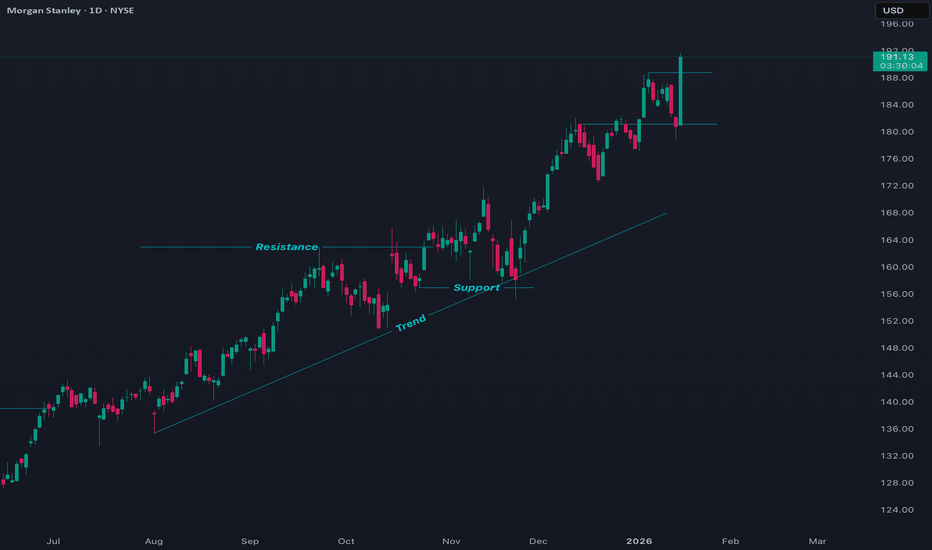
 Long
Long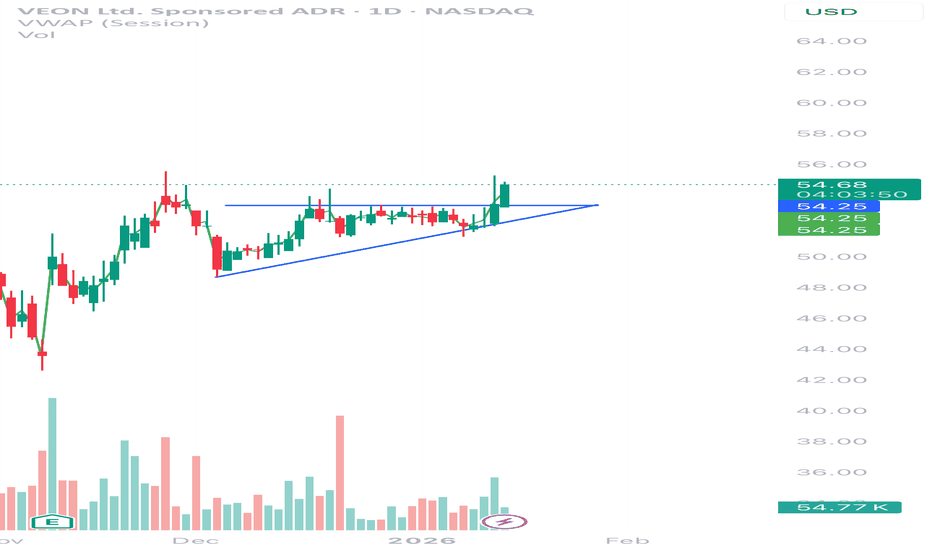
 Long
Long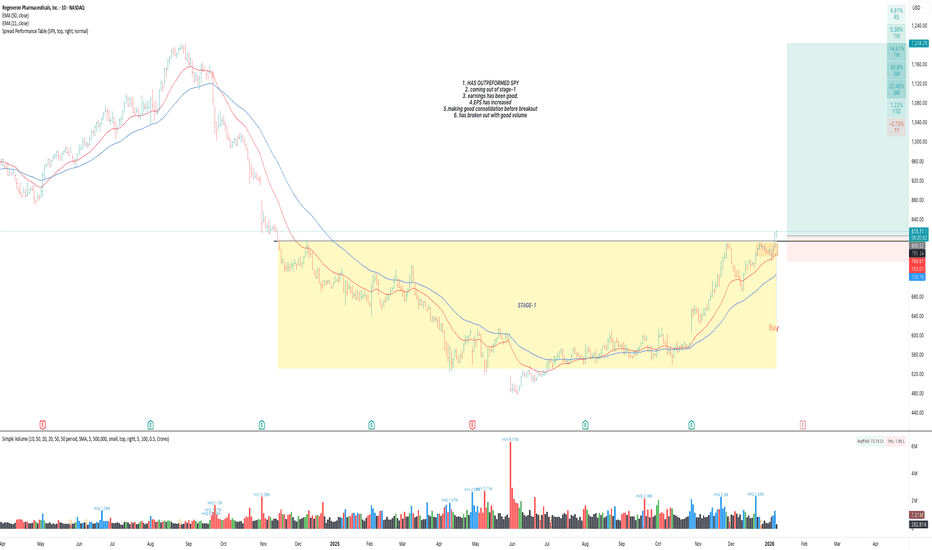
 Education

Tremendous FALL and RECOVERY of LMT on News & Sentiments1st News
- Donald Trump said that he would not permit dividends or stock buybacks for U.S. defense companies until they fix military equipment production and delivery issues.
- Now it is required to understand that dividends are payouts to shareholders out of profits
- Generally, when dividends are not paid, the company uses the retained fund in its development, research, investing, etc.
But what's the matter? Why is he not allowing defense companies to pay dividends to their shareholders??
- Basically, he is criticizing the defense industry for prioritizing shareholder payouts over investing in factories, R&D, and faster production of military equipment.
- He also suggested capping executive pay until those issues are resolved.
Impact: The stock prices of LMT fell 7% during the regular trading hours upon the ban on shareholders' payout
--------------------------------------------------------------------------------------------------------------
2nd News
President Trump announced that he is determined to increase the US Military budget to $1.5 trillion in 2027 due to “tremendous” tariff revenue.
This would be a near 70% increase from 2025 levels.
Impact: Later, in the extended trading hours, prices recovered substantially, rising ~8.30% on the announcement of a hike in the defense budget  Education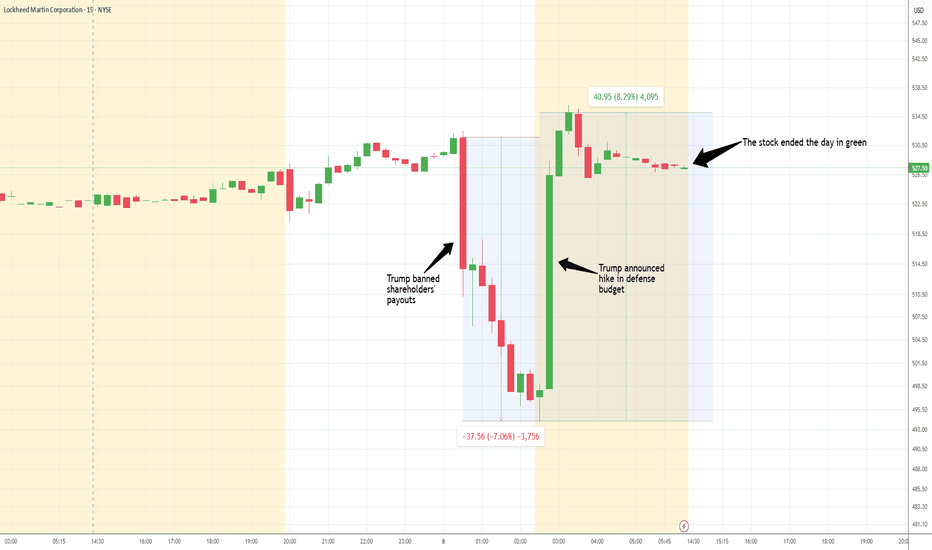
Fresh Food, Fresh EPS: FRPT Surprises Wall StreetThe Redoubling is my own research project on TradingView, which is designed to answer the following question: How long will it take me to double my capital? Each article will focus on a different company that I'll try to add to my model portfolio. I'll use the close price of the last daily candle on the day the article is published as the initial buy limit price. I'll make all my decisions based on fundamental analysis. Furthermore, I'm not going to use leverage in my calculations, but I'll reduce my capital by the amount of commissions (0.1% per trade) and taxes (20% capital gains and 25% dividend). To find out the current price of the company's shares, just click the Play button on the chart. But please use this stuff only for educational purposes. Just so you know, this isn't investment advice.
Here’s a detailed, structured company overview for NASDAQ:FRPT (Freshpet, Inc.) based on its financial state:
1. Main areas of activity Freshpet, Inc. is a U.S.–based pet food manufacturer focused on producing and marketing fresh, refrigerated meals and treats for dogs and cats. Its core business spans the development, manufacturing, and distribution of natural, minimally processed pet foods under its own brand names, leveraging a proprietary refrigerated distribution network in grocery, pet‑specialty, and other retail channels across North America and Europe.
2. Business model Freshpet generates revenue by selling pet food products directly to retail partners, including grocery chains, pet stores, mass merchants, club stores, and e‑commerce platforms. Its business model is B2B2C: it manufactures products and sells them through retailers who then sell to pet owners. The company emphasizes brand loyalty and repeat purchases via its high‑quality, fresh food offerings, which require refrigeration and are positioned at a premium compared to traditional dry or canned pet food.
3. Flagship products or services Freshpet’s principal offerings include refrigerated dog food, cat food, and pet treats. Products are marketed under the Freshpet brand, with additional treat lines like DogNation and Dog Joy. These items are designed around fresh meat, vegetables, and fruits without preservatives or artificial additives, and are sold in forms such as meals, rolls, and tubs.
4. Key countries for business The company is primarily active in the United States and Canada, where it has the largest retail presence. It also distributes products in Europe, expanding its footprint beyond North America. Retail availability spans multiple channels, including mass, club, grocery, and specialty pet outlets.
5. Main competitors Key competitors stem from both traditional pet food and fresh/natural brands:
Blue Buffalo (General Mills) and Hill’s Pet Nutrition (Colgate‑Palmolive) in premium pet food.
Smaller fresh/natural pet food brands like The Farmer’s Dog, Ollie, and Nom Nom, which often sell direct‑to‑consumer.
Broader food companies like Vital Farms, Utz Brands, Lamb Weston, etc., operate in the wider consumer food sector but overlap competitively in specific product categories.
6. External and internal factors contributing to profit growth External factors:
Strong consumer trend toward pet humanization and premium quality pet food, which supports demand for fresh, healthy options.
Expanding pet ownership and rising pet care spending, especially in North America.
These trends create opportunities for Freshpet to grow its market share and expand retail presence.
Internal factors: Unique refrigerated product positioning and brand loyalty, differentiating it from conventional pet food.
Strategic retailer partnerships and proprietary refrigerated distribution units, enhancing product visibility and repeat purchases.
Operational expansion and marketing focused on health‑conscious pet owners, enabling scalable growth in existing and new markets.
7. External and internal factors contributing to profit decline External factors: Economic pressures and shifts in consumer behavior, with tighter household budgets potentially reducing premium purchases.
Growing competition from major food companies entering the fresh pet food space, e.g., General Mills expanding Blue Buffalo into fresh offerings.
Internal factors:
Dependency on refrigerated logistics increases cost and complexity relative to shelf‑stable pet foods.
Slower growth in certain segments (e.g., cat food) might limit broader adoption as consumer preferences shift.
8. Stability of management Executive changes over past 5 years:
Freshpet’s executive leadership includes CEO Billy Cyr, with recent activity in board and senior management roles, reflecting focused leadership continuity in executing growth strategies.
Impact on corporate strategy and culture:
Management continuity has supported a consistent focus on premium product innovation, refrigerated distribution infrastructure, and brand expansion, contributing to long‑term strategic consistency and strengthening market positioning.
An analysis of business conditions indicates that earnings per share are currently growing above analysts' consensus forecasts amid steady long-term revenue growth, while performance and financial stability indicators such as accounts receivable turnover and debt-to-revenue ratio appear strong, confirming high-quality operational management and a healthy balance sheet structure. Cash flows from operating, investing, and financing activities are assessed as stable, indicating the company's balanced ability to generate and allocate capital. Among the indicators of medium priority, the steady long-term growth in return on capital and gross margin supports the picture of stable profitability, the achieved growth in the operating expense ratio reflects improved cost control, and strong values for supplier payment terms, inventory-to-revenue ratio, and current liquidity confirm reliable working capital management; at the same time, the lack of progress in interest coverage remains the only limiting factor that does not change the overall positive assessment. With a P/E ratio of 27, which is considered acceptable, the current valuation appears reasonable given the moderately stable growth profile. No critical news has been identified that could jeopardize the stability of the business or lead to a risk of insolvency. Considering a diversification coefficient of 20 and a deviation of the current share price from its average annual value of more than 4 EPS, a decision was made to invest 5% of capital in this company at the closing price of the last daily bar, reflecting a balanced and conservative approach to the position within a diversified portfolio.  Long
Long
McDonalds Elliott wave breakdown and double correction outlookMcDonald's Elliott Wave Breakdown & Double Correction Outlook
Dear Traders,
McDonald's stock has recently completed a textbook five-wave impulsive structure, followed by a complex double correction. Based on current wave dynamics and Fibonacci projections, the price may retrace toward the 287 or even 277 levels.
Let’s dissect the wave structure:
🔹 Impulse Wave Formation
- Wave 1: Initiated from $243 on July 9, 2024, and peaked at $262 on July 19, 2024.
- Wave 2: Retraced to $246.12 by July 24, 2024, correcting over 61.8% of Wave 1. Importantly, it respected the Elliott rule that Wave 2 must not breach the origin of Wave 1.
- Wave 3: Extended sharply to $317 by October 21, 2024, exceeding 3.618× the length of Wave 1, validating its role as the strongest and longest wave.
- Wave 4: Pulled back approximately 50% of Wave 3, without overlapping Wave 1 territory—compliant with Elliott guidelines.
- Wave 5: Formed a clear five-wave substructure and extended 2.618× Wave 1, completing the impulsive sequence.
🔸 Technical Confirmation
- RSI Divergence: Positive divergence observed between Waves 3 and 5, reinforcing the exhaustion of the bullish impulse.
🔻 Double Correction Structure
Following the impulse, price action transitioned into a complex flat correction, exhibiting a 3-3-5 structure:
it is in double flat pattern and it has completed X wave
📌 Conclusion: The completed impulse and confirmed double correction suggest further downside potential. Key Fibonacci support zones lie at $287 and $277, which may act as reversal zones.
Stay sharp and trade with discipline.  Short
Short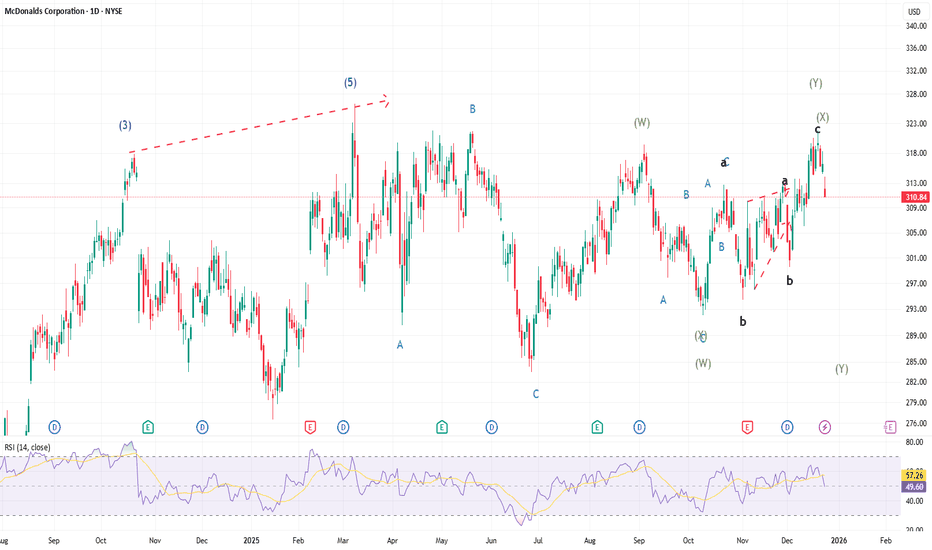
 Long
Long
 Long
Long
Short 
 Short
Short
Long 
 Long
Long
Derivatives Trading SecretsMastering Leverage, Risk, and Market Psychology
Derivatives trading is often seen as a complex and high-risk area of financial markets, reserved only for professionals. However, when understood correctly, derivatives can become powerful tools for profit generation, risk management, and strategic positioning. The real “secrets” of derivatives trading are not hidden formulas or insider tricks, but a deep understanding of leverage, disciplined risk control, market structure, and trader psychology. This article раскрыts the core principles that successful traders consistently apply to gain an edge in derivatives markets.
Understanding the True Nature of Derivatives
Derivatives are financial contracts whose value is derived from an underlying asset such as stocks, indices, commodities, currencies, or cryptocurrencies. Common derivatives include futures, options, and swaps. The first secret of derivatives trading is recognizing that these instruments amplify both opportunity and risk. Because derivatives often require only a margin instead of full capital, traders gain leverage. This leverage magnifies profits, but it also magnifies losses with equal force.
Many beginners focus only on potential returns and overlook how quickly losses can accumulate. Successful traders, on the other hand, treat derivatives as precision instruments. They understand that derivatives are not investments in the traditional sense but tactical tools designed for specific objectives such as hedging, speculation, or arbitrage.
Leverage Is a Double-Edged Sword
One of the most important derivatives trading secrets is knowing how to use leverage responsibly. High leverage is attractive because it allows traders to control large positions with relatively small capital. However, excessive leverage is the primary reason most derivative traders fail.
Professional traders rarely use maximum leverage. Instead, they calculate position size based on acceptable risk per trade, usually limiting losses to a small percentage of total capital. They understand that survival comes first. In derivatives trading, staying in the game long enough is more important than chasing extraordinary gains in a single trade.
The secret lies in controlled leverage—using just enough to enhance returns while maintaining enough margin to withstand normal market volatility.
Risk Management Is the Real Edge
If there is one universal truth in derivatives trading, it is that risk management matters more than strategy. Many traders spend years searching for the perfect setup while ignoring basic risk principles. Successful traders think in probabilities, not certainties.
They define risk before entering a trade by setting stop-loss levels, understanding margin requirements, and planning exit strategies. They also account for gap risk, volatility spikes, and event-driven movements such as earnings, economic data, or policy announcements.
Another key secret is consistency. Instead of risking large amounts on a few trades, disciplined traders risk small, repeatable amounts over many trades. This approach allows the law of large numbers to work in their favor.
Volatility Is a Friend, Not an Enemy
In derivatives markets, volatility is not something to fear—it is something to understand. Futures and options traders, in particular, thrive on volatility. The secret is not predicting direction alone but understanding how volatility impacts pricing.
Options traders focus heavily on implied volatility, time decay, and volatility cycles. They know when to buy options during low volatility and when to sell or structure spreads during high volatility. Futures traders adjust position sizes based on volatility to avoid being shaken out by normal price swings.
Rather than avoiding volatile markets, experienced traders adapt their strategies to changing volatility conditions.
Market Structure and Liquidity Matter
Another often-overlooked secret is the importance of market structure. Liquidity, bid-ask spreads, open interest, and contract specifications play a major role in derivatives trading success. Highly liquid contracts such as index futures or major stock options offer tighter spreads and smoother execution, reducing trading costs.
Professionals prefer liquid markets because they allow quick entry and exit without significant slippage. They also pay attention to rollover dates in futures contracts and changes in open interest to gauge market sentiment and participation.
Understanding how institutions operate within derivatives markets provides insight into price behavior that retail traders often miss.
Timing Is More Important Than Prediction
Many traders believe success depends on predicting market direction accurately. In reality, timing and execution matter far more. Even a correct market view can result in losses if entries and exits are poorly timed.
Derivatives trading secrets include waiting for confirmation, trading with the trend, and aligning multiple time frames. Traders often enter positions when momentum aligns with broader market structure, rather than trying to catch tops and bottoms.
Patience is a hidden advantage. The ability to wait for high-probability setups separates professionals from impulsive traders.
Psychology Determines Long-Term Success
The most powerful secret in derivatives trading lies in the trader’s mindset. Fear, greed, overconfidence, and revenge trading are responsible for most losses. Because derivatives move quickly, emotional mistakes are amplified.
Successful traders develop emotional discipline. They accept losses as part of the business and do not attach ego to individual trades. They follow predefined rules even after a series of losses or wins.
Keeping a trading journal, reviewing mistakes, and focusing on process rather than outcome are common habits among consistently profitable derivatives traders.
Adaptability Is Essential
Markets evolve, and strategies that work today may fail tomorrow. Another critical secret is adaptability. Professional traders continuously monitor market conditions and adjust their strategies accordingly. They know when to be aggressive and when to step back.
They also understand that no single strategy works in all market environments. Trend-following strategies perform well in strong directional markets, while range-bound strategies work better during consolidation phases.
Flexibility and continuous learning keep traders aligned with the market rather than fighting it.
Conclusion
Derivatives trading secrets are not about shortcuts or guaranteed profits. They are about mastering leverage, respecting risk, understanding volatility, and maintaining psychological discipline. Derivatives offer immense potential, but only to those who approach them with preparation, patience, and professionalism.
By focusing on risk management, controlled leverage, market structure, and mindset, traders can transform derivatives from dangerous instruments into powerful tools. In the end, the true secret of derivatives trading is not predicting the market—but managing yourself within it. Education