Short
Short
 Long
Long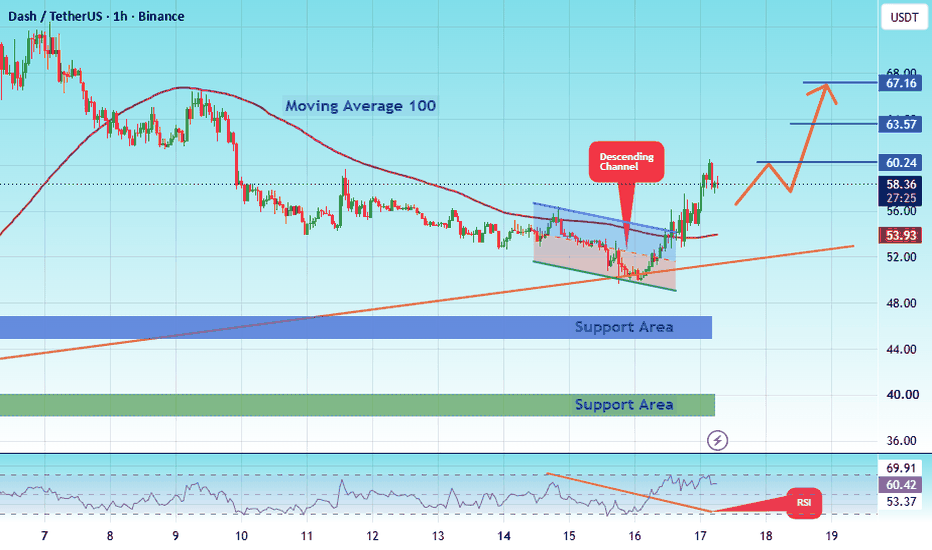
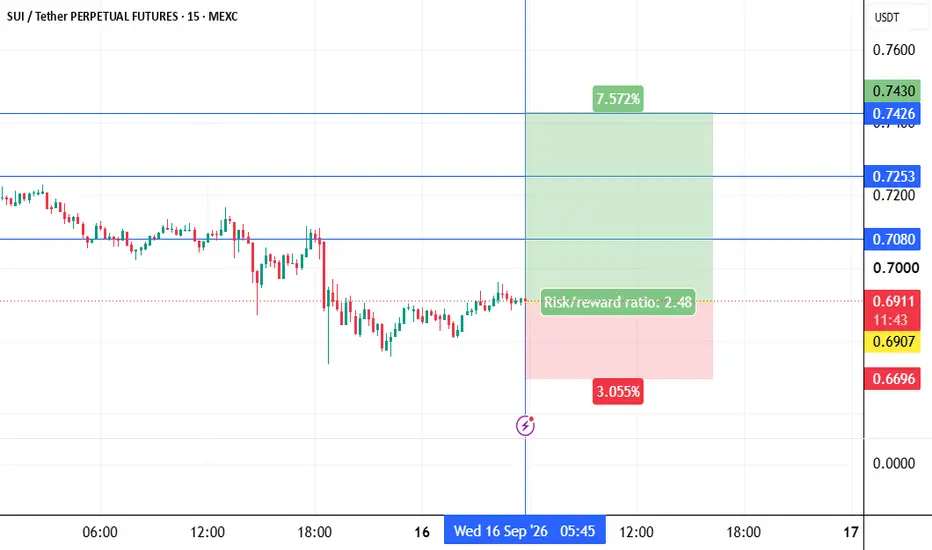
suiusdt longInstructions:
Entry point: yellow
Stop loss: red
Take profit: green or blue
👉Leverage x 5-10-20 for crypto
👉Leverage x 20-50-100 for commodities, stocks, indices, and forex
👉Margin 1-5% max.
Always practice risk and money management.
Invest a maximum of 5% on any trade or across all your trades.
Invest only what you can afford to lose, as no one is in control of the market.
👉Our analyses are primarily based on:
breakouts: two trend lines (ascending and descending) and a line indicating a horizontal breakout.
chart patterns: shoulders and head, triangle parttern, elliott impulse, etc etc.
We don't always have the time to track them at all times or to represent them visibly, given the numerous signals, the number of channels to manage, and especially because of the often rapid pace of market movements.
indicators: We associate at least two indicators with this technique.
👉Depending on the circumstances, we use specific indicators, often setting 3 or more take profit levels.
👉Indeed, there are good days in trading and also bad days. No one can promise to win every trade, and like all traders worldwide, we also experience stop-loss orders. However, we win more than we lose and remain positive.
👉You can close the position before or after the take profit orders indicated by the green lines if you are personally satisfied; the same applies to stop loss orders.
👉We must stay positive, clear-headed, and humble.
we cannot provide all instructions or all trades here on this channel.
Good luck to us all, and may God guide us. Amen.  Long
Long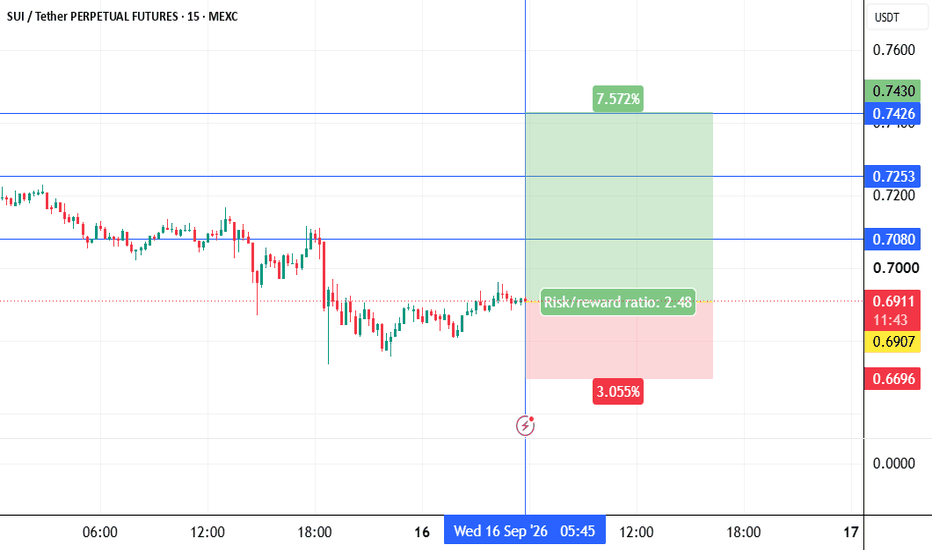
 Long
Long
 Long
Long
 Short
Short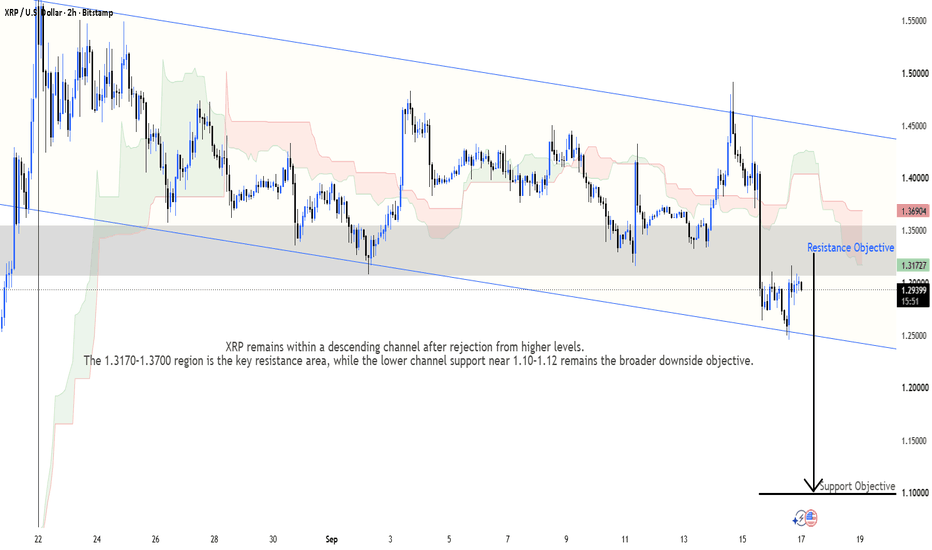
SOL/USD: Bearish BoS at 99.00 Caps Bounce Below EMA55SOL's trading at 99.66 after a modest 1% bounce, but the STC picture is still firmly in the sellers' hands. Trend bias reads Downtrend, EMA55 sits overhead at 100.53, and just 9 bars ago price printed a bearish BoS through the 99.00 swing pivot. The bounce has only carried price into the upper half of the volatility band, with band upper at 102.03 acting as the next natural cap.
Why it matters: on the 4H, that fresh bearish BoS is the dominant structural event, and the last swing high at 104.82 is still open and untested. Sellers defended EMA55 on the last leg down — until price reclaims that line on a closing basis, every push higher is a supply test, not a trend change. The compressed 1.75 ATR means moves are tight; the band edges frame the next reaction zones cleanly.
Trigger to watch: a 4H close back above EMA55 at 100.53 with follow-through toward the band upper — that flips the near-term tone and puts the 104.82 swing high back in play. Failing that, a rejection in the 100.50-102.00 supply pocket keeps the bearish BoS alive and points price back toward the recent low.
Invalidation: a clean 4H close above 104.82 takes the bearish structure off the table entirely.
Targets: 96.77 — band lower and first magnet on a rejection. 95.82 — last swing low, the line that must hold. 102.03 — band upper on the reclaim scenario.
Setup: Watching reaction at EMA55 (100.53) after the fresh bearish BoS through 99.00 — reclaim reopens 104.82, rejection points back to 95.82.
Invalidation: A 4H close above the 104.82 swing high invalidates the bearish structure.
Targets: 96.77 — band lower, first magnet on rejection · 95.82 — last swing low, structural line in the sand · 102.03 — band upper on an EMA55 reclaim BTCUSD is currently showing a bearish market viewBTCUSD — BEARISH MARKET ANALYSIS
Timeframe: 1H
Market: BTCUSD
Bias: Bearish / Sell
MARKET VIEW
BTCUSD is currently showing a bearish market view, with price reacting around the 76,300 resistance/breakdown area.
The key level at 76,300 is being treated as an important resistance zone. After the breakdown, selling pressure has increased, suggesting the possibility of further downside movement if sellers continue to maintain control.
The current setup focuses on bearish continuation from the 76,300 area, with the next potential downside levels identified as 75,400 and 74,400.
🔴 KEY RESISTANCE / BREAKDOWN AREA
Resistance & Breakdown Zone: 76,300
This level is important for the current setup. A continued rejection below this area may support the bearish scenario, while a strong reclaim and sustained move above it could weaken the setup.
TECHNICAL TARGETS
TP1: 75,400
TP2: 74,400
These levels are potential downside areas where price may react. Traders should manage positions according to their individual risk-management strategy.
TECHNICAL REASONING
• Bearish trend developing on the 1H timeframe
• Breakdown observed around 76,300
• 76,300 acting as a key resistance area
• Selling pressure remains the main focus
• Potential downside targets at 75,400 and 74,400
RISK MANAGEMENT
BTCUSD can move quickly and experience high volatility. Technical setups are not guaranteed to reach their targets. Always use proper position sizing, define your risk before entering, and avoid overleveraging.
FINAL MARKET VIEW
BTCUSD remains under bearish pressure below the 76,300 breakdown/resistance area. If sellers maintain control, the next technical levels to watch are 75,400 and 74,400.
Understand the market view. Follow the structure. Manage your risk.
#BTCUSD #Bitcoin #BTC #CryptoTrading #TechnicalAnalysis #PriceAction #MarketStructure #BearishTrend #SellSetup #TradingView #CryptoAnalysis #RiskManagement #ReubenMiles  Short
Short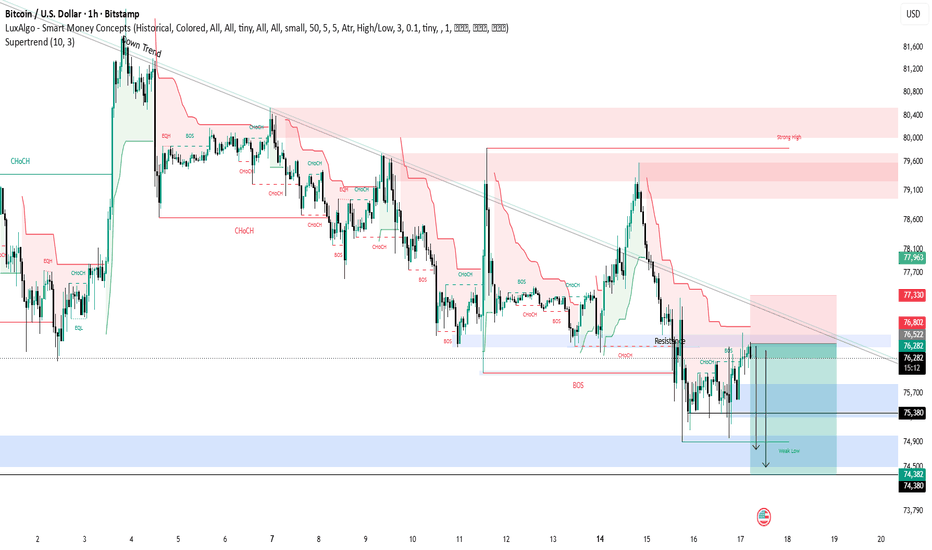
 Long
Long
ZEC/BTC opportunity of a lifetimeHave shared this mostly among close friends. But after reading path and zoomerjd's posts, i felt inspired to share my own thoughts with tv. While my writeup lacks the fractal geometrical genius and metaphorical poeticness present in theirs, the general overarching idea is the same.
Fairly simple thesis - privacy coins haven't been hyped for 3-4 years. They will probably get hyped at some point as an alternative storage of value to BTC. The two largest privacy coins currently have a combined 0.6% of BTC's market cap. What is fair market value? currently that is 0.6%. What could it be in the future? who knows. ZEC/BTC hit all time lows in December, while XMR/BTC hasn't done much better, not seeing ratio this low since prior to the 2016 alphabay pump.
1) Good privacy crypto coins have never been in the spotlight. They were outshined by smart contract platforms, dental rewards program coins, etc, in the 2017-18 cycle and currently by Defi coins in the 2020-21 cycle. Holding a privacy coin is only for masochists at this moment in time in most people's eyes. A small part of every single Xmr/Zec holder secretly wishes they had bought another coin like Aave or Kusama.
2) At some point, the privacy narrative will catch fire with tremendous hype when people realize how transparent everything is on existing blockchains. Sure, it is annoying for some whales to have their addresses revealed if they're yield mining $500k per week, but for those profits, they will tolerate that intrusion of privacy. Everyone knows long term these yields are not sustainable and there will be a point where some of these whales that have millions of dollars probably don't want to have their every single move on the blockchain be tracked by a 3rd party website.
3) The 2 best known privacy coins- Monero and Zcash. Each have had their controversies. XMR with its initial (perhaps intentionally) crippled miner release in 2014 and pre-RingCT issues. ZEC with its trusted setup process, the founder's reward, difficulty in counting actual supply, etc. Both coins have been going through 3-4 years of downwards price action and taken a lot of punishment price-wise. I believe the final capitulation we've been dreading and hoping to avoid finally happened after the December Bittrex delisting announcements.
4) XMR has only had one pump ever in its lifecycle, during the alphabay/oasis pnd in fall 2016 (and then the bithumb listing pump in 2017 which did about a measly 3x). Zec had its only notable one during June 2017 when it still had a low circulating supply, and has been weak ever since. Any mention of these two coins generally get a lot of laughs and ridicule on CT (pertains probably more to ZEC than XMR). There is no doubt that if/when these two coins finally have their moment in the spotlight, they will go hard af. There is a lot of regulation uncertainty around privacy in general, which probably plays a role in the general hesitancy and lack of strength for these two coins.
Which to choose - Xmr is better from a purist point of a view, where Zec offers better pure privacy at the cost of several tradeoffs and has more centralization in its development and roadmap. Given Zec's availability on Coinbase and Gemini and its regulatory standing with the NYDFS, I chose Zcash to get the slightly larger allocation in my portfolio, but both coins are great. Having a small privacy allocation in your portfolio with a a 50/50 or 70/30 split for XMR/ZEC or vice versa is potentially a smart hedge for the scenario in my thesis.
Concluding thoughts - personally, I think buying privacy coins at this moment in time are a win-win. Either it's the trade of a generation and you look like a genius, or you become a member of a tight-knit cooperative and fun community for years to come
thoughts 2: should be obvious but to be claer- its a long shot to ever hit 0.10 plus again on the ratio, but something like .02 to .05 is certainly well within the range of outcomes
Disclaimer: This is not trading/investment advice  Long
Long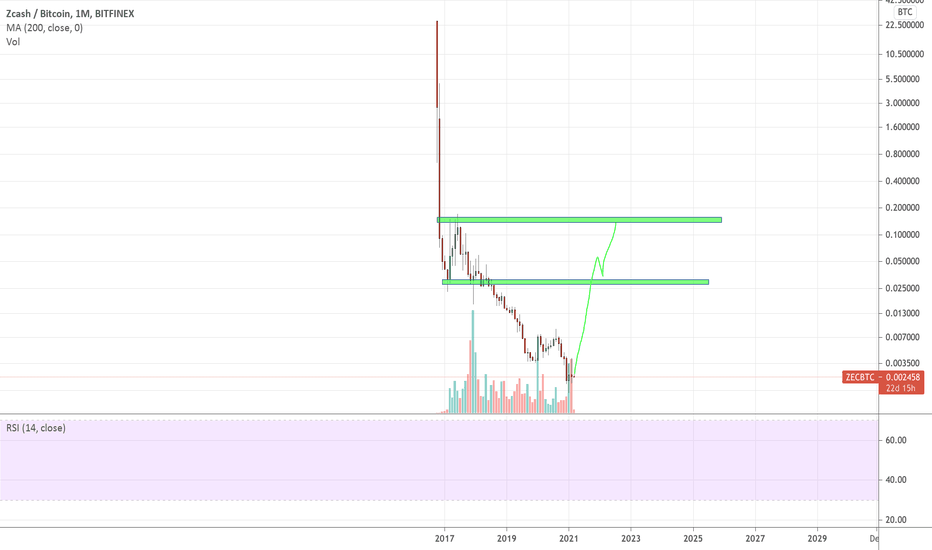
CATE at a Turning Point — Breakout or Another Rejection?💵 Coin: OMXSTO:CATE
⏱️ Time Frame: 8H
🏦 Exchange: MEXC
📍 Current Price: around $0.07449
🔴 Major Resistance: $0.08100
📈 Previous High: around $0.09377
🔍 Chart Structure
📌 The chart shows that OMXSTO:CATE is currently trading near a key horizontal resistance around $0.08100.
🔄 Interestingly, the price has repeatedly returned to test this resistance after recovering from lower levels. These repeated tests indicate that buyers are putting increasing pressure on the resistance, although a breakout has not yet been confirmed.
📈 The price structure from mid-August through September also shows a recovery phase with gradually forming higher lows, as price continues to approach the major resistance.
⚠️ However, $0.08100 remains an important confirmation level. Until a valid breakout occurs, this resistance could still trigger another rejection.
---
📐 Pattern Formation
🔹 Horizontal Resistance / Repeated Resistance Test
The chart is better interpreted as a consolidation phase with repeated tests of resistance, rather than a confirmed breakout pattern.
📊 The more frequently resistance is tested, the more important that level becomes. However, a valid breakout still requires an 8H candle close above the resistance, ideally accompanied by increased volume.
🎯 If a breakout occurs, the $0.09377 area becomes an important previous high and potential resistance before price moves toward higher levels.
---
🟢 Bullish Scenario
🚀 Breakout Above $0.08100
If OMXSTO:CATE successfully breaks above and produces a strong 8H candle close above $0.08100, the bullish structure could receive stronger confirmation.
📈 Potential upside levels:
$0.08100 → $0.09377 → $0.120 → $0.150 → $0.210
🔥 The $0.09377 area is particularly important because it represents the previous high visible on the chart.
🎯 The chart shows a potential extended target around $0.21000.
📊 From approximately $0.07449 → $0.21000, this would represent roughly +182% if that target were reached.
⚠️ This target represents a potential technical objective, not a guarantee that price will reach it.
---
🔴 Bearish Scenario
📉 If OMXSTO:CATE experiences another strong rejection around $0.08100, the breakout thesis remains unconfirmed.
🔻 Failure to maintain bullish momentum could cause the price to move back into the previous consolidation range.
📍 The following levels should be monitored:
$0.074 → $0.070 → $0.055 → $0.040
⚠️ If price loses its higher-low structure and experiences a significant breakdown, the bullish breakout setup could weaken and the market may return to another consolidation phase.
---
🎯 Key Levels to Watch
🔴 $0.08100 — Major Resistance / Breakout Level
🟠 $0.09377 — Previous High
🟡 $0.12000 — Potential Psychological Resistance
🟡 $0.15000 — Higher Resistance Area
🟢 $0.21000 — Chart's Potential Upside Target
🔻 $0.05500–$0.04000 — Important Lower Support Zone
---
🧠 Market Conclusion
📊 OMXSTO:CATE is currently trading just below the important $0.08100 resistance.
🔥 The chart structure shows recovery + repeated resistance testing, making $0.08100 a critical level to watch.
🚀 Bullish confirmation: breakout and 8H candle close above $0.08100.
📉 Bearish confirmation: repeated rejection followed by a breakdown below the support/higher-low structure.
⏳ For now, the breakout has not yet been confirmed, so traders should closely monitor how price reacts when it retests $0.08100.
#CATE #Catecoin #CATEUSDT #Crypto  Long
Long
Strategy vs Edge: What Most Traders ConfuseWelcome
Good morning everyone, welcome back to another article.
Most traders use the words strategy and edge interchangeably, and that single mix up causes more damage than people realise. but They are not the same thing, and confusing them is one of the biggest reasons traders backtest something that looks perfect, take it live, and still lose money. This article breaks down exactly what separates strategy from edge, why both are needed together, and where traders commonly get the two confused.
A strategy tells you what to do. An edge is what actually gives you a reason to expect it to work over time.
Definitions of Strategy
Strategy: the systematic, mechanical approach a trader uses to find and execute trades, including fundamental review, technical analysis, entry crjteria, and risk management.
In simple terms: strategy is the process. It's the checklist. It's the part you could write down step by step and hand to someone else to follow.
Definitions of Edge
Edge: the underlying reason a strategy has a genuine statistical advantage over time, made up of psychology, discipline, timing, and the conditions the strategy is actually applied in.
In simple terms: edge is why the strategy works, not just what the strategy says to do. Two traders can run the exact same strategy and get completely different results, because one of them has edge and the other doesn't.
Part 1
Strategy lives entirely in the mechanics. It's built from fundamentals such as macro conditions, news events, and asset specific catalysts, combined with technical analysis such as market structure, key levels, and price action signals. Risk management sits inside strategy too, position sizing, stop loss placement, and risk to reward ratios are all part of the systematic process. If you can write it out as a rule, "enter on a bullish engulfing candle at a key support level with stop loss below the wick, risking one percent," that's strategy. It's replicable, mechanical, and doesn't require any feel or intuition to follow. This is the part most traders spend all their time studying, because it's the part that can be backtested, screenshotted, and taught.
Part 2
Edge is everything strategy doesn't cover, and it's the reason two people using the same rules end up with different results. Edge includes the discipline to actually follow the strategy without hesitation or second guessing. It includes timing, trading during your strongest session and avoiding sessions where your setups historically underperform, such as low volume periods or major news windows outside your ruleset. It includes emotional control, not skipping the stop loss "just this once," and not increasing size after a win because you feel confident. It includes consistency across hundreds of trades rather than judging performance off the last five. None of this shows up on a backtest, but all of it decides whether the backtest's numbers are ever actually achieved in real trading.
Common Issues and Confusions
The biggest confusion is assuming a good strategy automatically means you have an edge. A trader can find a genuinely profitable set of rules, backtest it with strong results, and still lose money live, because the edge, the discipline to execute it exactly the same way every time, was never actually there. Another common issue is traders constantly changing strategy when the real problem is a lack of edge. They'll switch from price action to indicators to smart money concepts, blaming the strategy each time, when the actual issue is inconsistent execution, poor timing, or emotional interference that would sabotage any strategy they chose. The reverse also happens. Some traders have strong discipline and self control, a real edge in terms of psychology, but they're applying it to a strategy with no real statistical advantage, so their consistency simply produces consistent losses. Strategy without edge fails because the process is never followed properly. Edge without strategy fails because there's nothing solid actually being executed. You need both, and they need to be evaluated separately when something isn't working, not lumped together as one problem.
Example
Two traders backtest the same breakout strategy and both find a strong edge on paper. Trader A trades it only during their planned session, follows the stop loss on every single trade, and risks a fixed one percent regardless of recent results. Trader B trades the same setup at random hours around their day job, moves the stop loss when a trade goes against them "because it'll probably come back," and increases risk after a winning streak. Six months later, Trader A's results resemble the backtest closely. Trader B's results look nothing like it, despite using the identical strategy. The strategy was never the variable. The edge was.
Conclusion
Strategy is the map. Edge is the discipline, timing, and psychology required to actually follow the map the same way every single time. A trader can have a great strategy and zero edge, and a trader can have real discipline applied to a strategy with no genuine advantage, both fail for different reasons. Real, sustainable results only show up when both are built properly and evaluated separately. Before blaming your strategy, ask whether the problem was actually the rules, or whether it was you.
If you guys did enjoy this please let me know.
I will be posting more in the future. Education 
Bitcoin Pullback Ahead? Why I’m Watching the $67K Buy ZoneTo identify potential Bitcoin price scenarios, I conduct a comprehensive analysis across multiple timeframes, moving from the higher timeframes to the lower ones. This approach allows me to establish the broader market context first and then identify more precise areas for potential entries.
www.tradingview.com
Monthly timeframe
I always begin my analysis with the monthly chart.
At this stage, the key area is the $82,000–83,000 zone. It is important to treat it as a range rather than one exact price level.
Historically, this area has influenced the market on several occasions. In 2025, it acted as support, from which Bitcoin subsequently rallied towards its previous all-time high. The market is now retesting the same area from below, which means it is currently functioning as resistance.
Therefore, the long-term timeframe is not yet providing a sufficiently strong or convincing buy signal.
In my analysis, I use different colours for levels and chart objects originating from different timeframes. Monthly levels are always marked in red, weekly levels in pink, and lower-timeframe structures in other colours.
This allows me to move to a lower timeframe and immediately understand where a particular level originated and how much weight its signal should carry.
The underlying principle is straightforward: the higher the timeframe, the stronger the signal. For example, if a four-hour support zone produces a potential buy signal while the price is simultaneously approaching monthly resistance and generating a sell signal, I will generally prioritise the higher-timeframe signal.
www.tradingview.com
Weekly timeframe
The weekly chart continues to show a long-term uptrend, marked in pink.
The third point of contact with the lower trend boundary performed exceptionally well in July. The strong upward impulse we observed originated directly from this trend support.
This is another example of technical analysis working effectively when it is applied comprehensively and supported by disciplined risk management.
The price is currently positioned between several important technical areas. The moving averages around $74,000–76,000 are still providing a degree of support. However, this support appears weaker than the monthly resistance located around $82,000–83,000.
Consequently, buying Bitcoin at the current levels has some technical justification, but there is also a meaningful risk of a deeper decline.
If I begin building a position at the current price, I need to allocate my capital accordingly and retain sufficient capacity to increase the position at lower levels.
www.tradingview.com
Daily timeframe
The daily chart clearly shows the monthly resistance around $82,000–83,000. Because this level originates from the higher timeframe, it carries greater significance.
At the same time, a local uptrend has formed on the daily chart. Its first point was established in July, the second around the middle of August, and a potential third point may form within the $67,000–68,000 area.
This zone also coincides with horizontal support around $67,000, providing additional technical confluence.
For that reason, the $67,000–68,000 area represents a potentially attractive buying opportunity. A buy-limit order could already be considered within this zone.
The stop-loss should be placed below $67,000, with sufficient room for normal price volatility — potentially around $64,000–65,000.
Under this scenario, the initial target and minimum upside objective would be a return towards $82,000.
4-hour timeframe
I use the four-hour chart to assess the current market structure and identify potential swing-trading opportunities within the week.
Following the previous sharp upward impulse, the area around $76,000 repeatedly acted as support.
The impulse itself had the characteristics of a short squeeze. As sellers’ stop-loss orders were triggered, the resulting forced buying added further momentum and accelerated the move higher.
Compared with traditional financial markets, Bitcoin remains a relatively low-liquidity instrument. At certain moments, insufficient market liquidity can therefore produce especially sharp and volatile price movements. In general, the relationship is inverse: the greater the liquidity, the lower the volatility — and vice versa.
Applying a Fibonacci retracement to the initial upward impulse shows that the subsequent pullback almost perfectly reached the 78.6% retracement level, located around $76,000.
This support zone then produced three noticeable rebounds. However, the price is now beginning to break through it.
To me, this suggests that support around $76,000 is becoming exhausted.
The latest local high was also lower than the previous one. Bitcoin initially reached approximately $82,000, while the following rally extended only towards $80,000. The subsequent highs and lows are also beginning to move lower.
This structure reduces the probability of an immediate continuation of the previous strong upward move.
The fundamental backdrop is not currently providing a sufficient catalyst for further growth either. The CLARITY Act did not pass in the United States, meaning that the market did not receive the positive development it had been anticipating.
This provides additional confirmation for my scenario in which Bitcoin retains the potential to move lower.
Overall scenario
Opening a short position from the current levels is theoretically possible. However, such a trade would be taken against the broader long-term trend and would therefore carry elevated risk.
I prefer to look for opportunities in the direction of the prevailing trend. For this reason, my preferred scenario remains a potential Bitcoin purchase within the $67,000–68,000 zone, with a stop-loss below the level — potentially around $64,000–65,000.
The first upside target would be the $82,000 area. Any position should nevertheless be structured with appropriate risk management and sufficient capital reserved for gradual accumulation at lower prices. SOLUSDT 8H — Rangebreaker CHoCH, Watching the RetestSOL's correction off the 110 high did more than pull back into support, it swept it. C dropped to 96, undercutting the A low at 97.38, then reclaimed back above the range within the same sequence. That's a rangebreaker CHoCH, and it printed with the larger trend, this whole ABC is corrective inside the bigger move up from the ~80 low in August, not a standalone bearish structure.
Gate one, structure, still needs the descending trendline from the 110 high broken to fully confirm reversal, that line sits near 102 and hasn't been touched yet. But the character of the correction just shifted. A sweep below range lows followed by a reclaim is exhaustion behavior, not continuation behavior, sellers pushed through the obvious level and couldn't hold it.
Gate two, the zone, is the reclaimed range itself, 96-98. This is now the level that needs to hold, not the level being tested for the first time.
Gate three, the trigger, already printed on this timeframe, the reclaim above 97.38 after the C sweep is the CHoCH. But the entry isn't this candle. The way this pattern pays is on the retest, once the larger timeframe has shown the tell, weight goes on where a smaller timeframe comes back down to test the reclaimed range and holds it. That's the trade, not the reclaim itself.
What makes the R:R on this kind of setup worth taking seriously is the stop sits tight against the range low that just got swept and reclaimed, while the room above runs back to the B high at 107 and the range top near 110. What invalidates it is a retest that fails, price closing back below 96, which would mean the sweep wasn't exhaustion, it was just the range breaking for real.
The sweep already did the hard part of showing who was left to sell. The retest just confirms nobody meaningful was. Long 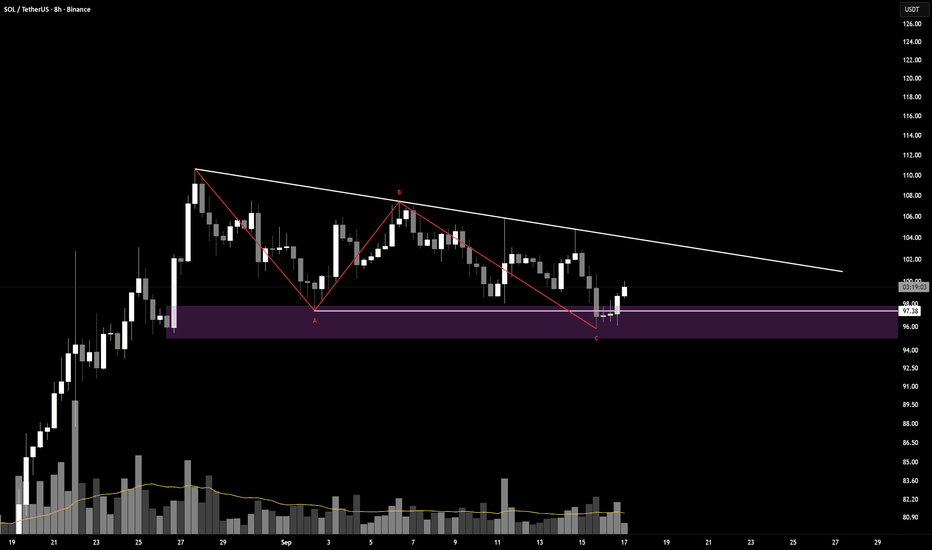
BTCUSD Struggles to Break Above Local Resistance on 30MBitcoin Faces Rejection From Key Resistance After Multiple Liquidity Reactions
Bitcoin has been building a series of higher reactions from the 75,300–75,600 region, showing repeated buyer activity around the lower structure. However, the recovery has now reached the highlighted 76,250–76,400 resistance zone, where price is struggling to sustain bullish continuation.
The recent push above the local highs was quickly rejected, suggesting that liquidity above the short-term structure has already been tested. Despite the curved recovery structure underneath price, buyers still need a convincing break and acceptance above 76,400–76,500 to strengthen the bullish structure.
Speculative Outlook
I’m watching for Bitcoin to remain volatile around 76,000–76,500, potentially producing several short-term swings and liquidity sweeps before establishing direction.
If price repeatedly fails to hold above the highlighted resistance, the structure could gradually weaken toward 75,800, followed by another test of 75,200–75,400.
A decisive breakdown of that lower support would strengthen the bearish scenario and could expose the broader 74,800–75,000 region.
Alternatively, sustained acceptance above 76,500 would weaken this bearish outlook and suggest the recovery structure is gaining strength. Short 
Bitcoin is currently show sell structure with descending channelBTCUSD — 1H BEARISH MARKET ANALYSIS
Bitcoin is currently showing a bearish structure inside a descending channel, with sellers maintaining pressure below the recent breakdown area.
Price is now approaching the 77,900 previous breakdown zone, which could act as a potential resistance area. If BTCUSD retests this level and shows bearish rejection, a sell entry may be considered from the 77,900 area with proper confirmation.
MARKET VIEW
• Descending channel structure
• Previous breakdown area: 77,900
• Potential sell entry: 77,900 on bearish confirmation
• Watch for rejection and continuation toward lower support levels
TECHNICAL TARGETS
TP1: 77,000
TP2: 76,500
TP3: 76,200
TIMEFRAME: 1H
Understand the market structure, wait for confirmation, and manage risk properly. Avoid chasing the move and always protect your capital. Short 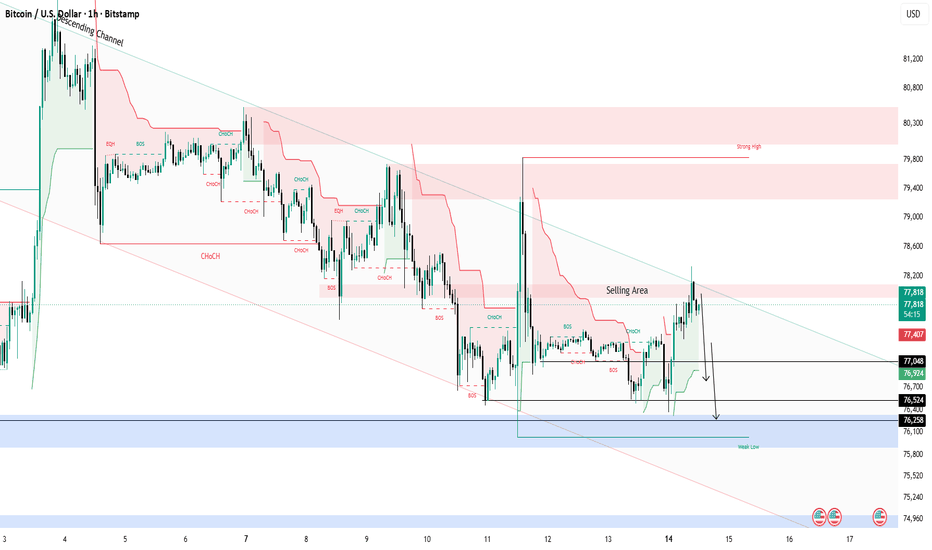
BTCUSDT 3H — Channel Break Confirmed, CVD Says Not YetPrice broke the descending channel from the Sep 4 high and reclaimed the 75,550 shelf, with a genuine RSI bullish divergence backing it, lower low in price on Sep 16 against a higher low in RSI off the Sep 11 print. That's not a coincidence pairing, momentum was actually contracting into the second low while price kept pushing.
Gate one, structure, gets a real trigger here. The channel break plus the reclaim of the shelf that held twice is a legitimate shift, not a wick through a line that means nothing.
Gate two, the zone, was the 75,250-75,550 double test. Two touches, two defenses, the kind of level that earns the right to be called support rather than just getting labeled one after the fact.
Gate three, the trigger, is where this stops being clean. Spot CVD has fully round-tripped back to where it sat at the 65,000 level despite price sitting over 11,000 points higher. That's an effort versus result mismatch on the macro leg, the move up was not backed by proportional net spot buying, which means either spot has been quietly distributing into this strength or whatever pushed price here wasn't conviction-driven demand. A structural trigger without order flow behind it is a signal from one gate contradicting a signal from another, and when that happens the honest move is to say so, not average it into a soft bullish take.
What confirms this bounce as more than tactical is CVD turning up from here, actual net spot buying showing up rather than price grinding higher in isolation. What invalidates it is a close back below 75,550 and the divergence low, which would mean the channel resumes and this was just a relief move inside a larger downtrend.
Right now this is a valid technical trigger sitting on top of an unconfirmed order flow read. Both things are true at once, and the setup doesn't get to pick which one matters more just because one of them is easier to draw an arrow on. Long 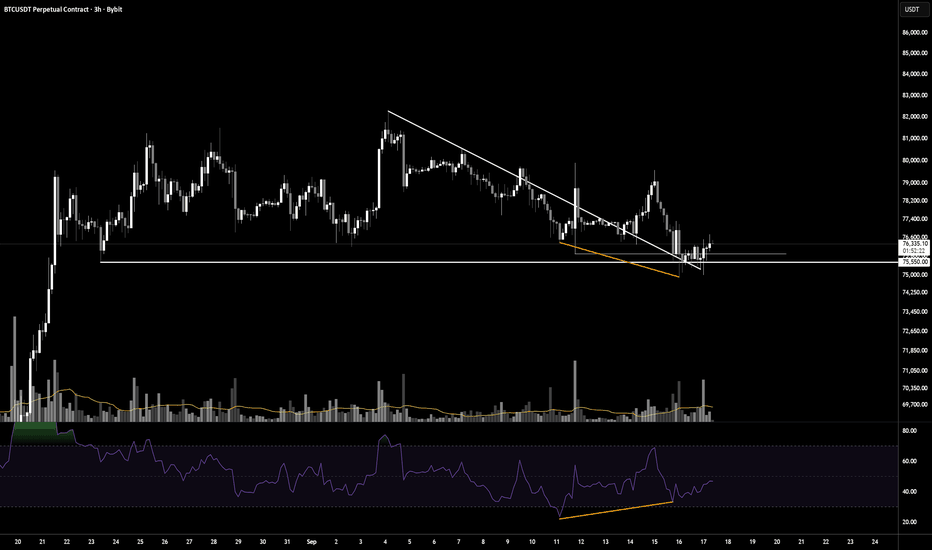
NEAR — Inverse Head & Shoulders Formation!💵 Coin: CRYPTOCAP:NEAR / USDT
⏳ Time Frame: 6D
📉 Pattern: Inverse Head & Shoulders (H&S)
📍 Current Price on Chart: approximately $2.66
🎯 Neckline: approximately $3.10
🟨 Key Support Zone: approximately $1.75 – $2.00
The NEAR/USDT chart shows a potential Inverse Head & Shoulders structure following a prolonged downtrend. The pattern consists of three main components: the Left Shoulder, Head, and Right Shoulder, with the neckline positioned around $3.10.
At the moment, price remains below the neckline, meaning the pattern has not yet received full breakout confirmation. The $1.75–$2.00 area is an important support zone because it also represents the potential formation area of the Right Shoulder.
---
🧩 Pattern Breakdown — Inverse Head & Shoulders
🔹 Left Shoulder:
Formed after a decline, followed by a rebound from the approximately $1.70–$2.00 area.
🔻 Head:
Price then experienced stronger selling pressure and formed a low around $0.84, creating the lowest point of the structure.
🔹 Right Shoulder:
After rebounding from the Head, price retraced toward the $1.75–$2.00 zone, but has not formed a new low below the Head. This structure resembles the formation of a Right Shoulder.
📏 Neckline:
The main resistance is located around $3.10. A strong breakout and candle close above this level would provide an important confirmation that the Inverse H&S structure is beginning to validate.
---
🟢 Bullish Scenario
🚀 Main bullish confirmation:
NEAR needs to break above and hold $3.10.
📈 If the neckline breakout is confirmed with strong momentum, the Inverse Head & Shoulders structure could develop into a bullish reversal pattern.
🎯 Key resistance levels shown on the chart:
$3.76 → $4.60 → $6.00 → $8.00 → $9.00
🔥 $3.76 becomes the first resistance area after the neckline.
🚀 If price successfully breaks above $3.76, the next area to watch would be around $4.60.
📈 A breakout above $4.60 could open the way toward $6.00.
💥 Next, the $8.00 area represents an important psychological resistance level.
🏆 The area around $9.00 represents the highest target/projection displayed on the chart and is also close to the previous high around $9.004.
⚠️ However, these levels are technical resistance/target zones shown on the chart, not a guarantee that price will reach them.
---
🔴 Bearish Scenario
⚠️ The bullish scenario becomes weaker if NEAR fails to hold the $1.75–$2.00 support zone.
📉 If price breaks down below this zone, the Right Shoulder structure could become invalidated.
🔻 Further downside could increase the possibility of price revisiting lower support areas.
💀 The most critical level within this structure is the Head low around $0.84.
🚨 If price eventually breaks below and forms a lower low beneath the Head, the Inverse Head & Shoulders structure shown on the chart would experience significant invalidation.
---
🔑 Key NEAR/USDT Levels
🟨 $1.75 – $2.00 → Support / Right Shoulder Zone
🔴 $3.10 → Neckline & Major Resistance
🟡 $3.76 → First Resistance
🟡 $4.60 → Next Resistance
🟡 $6.00 → Major Resistance
🟡 $8.00 → Psychological Resistance
🟢 $9.00 → Previous High / Chart Target Area
🔻 $0.84 → Head / Critical Invalidation Area
---
📌 Conclusion
🧠 Structurally, NEAR/USDT is forming a potential Inverse Head & Shoulders pattern on the 6D timeframe.
🟢 Bullish: A breakout and confirmation above $3.10 could provide stronger validation of the reversal structure and shift attention toward $3.76, $4.60, $6.00, $8.00, and potentially $9.00.
🔴 Bearish: Failure to hold $1.75–$2.00 could weaken the Right Shoulder structure. A move back toward the Head, particularly below $0.84, would represent an important invalidation of the Inverse H&S structure.
⏳ For now, the $3.10 neckline is one of the most important levels to watch.
⚠️ DYOR — Technical analysis does not guarantee future price movements.
#NEAR #NEARProtocol #NEARUSDT #Crypto  Long
Long