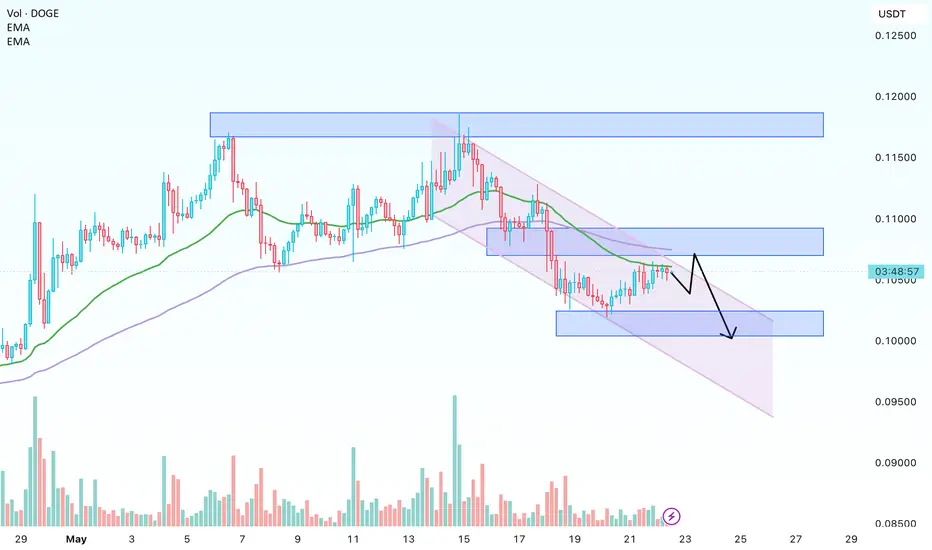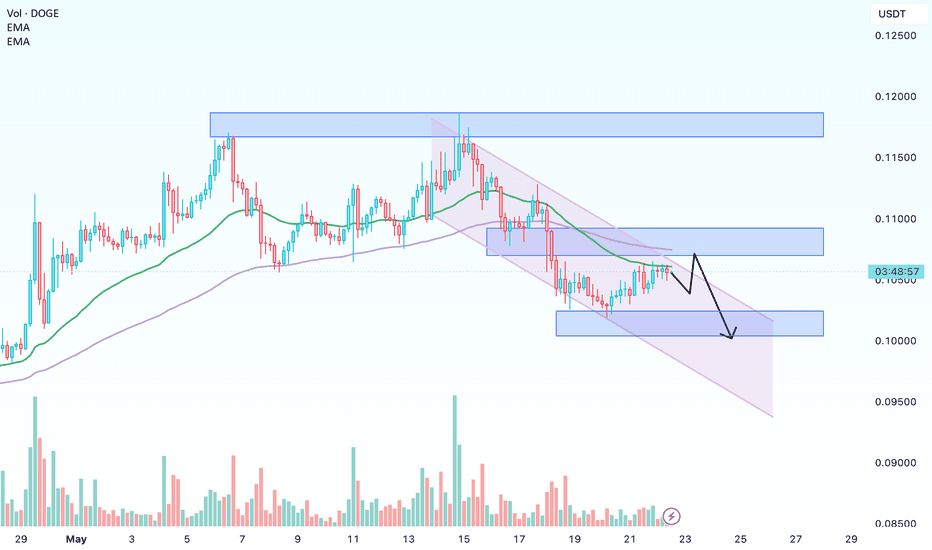
DOGE Enters a Quiet Compression PhaseDOGE is currently trading in a tight range around 0.105 – 0.106 after the sharp decline from 0.115 earlier this month.
Volume continues fading, candle ranges are shrinking, and volatility remains low — a structure often seen before larger breakout moves in speculative assets like meme coins.
Importantly, DOGE is no longer experiencing heavy panic selling, suggesting short-term bearish pressure has weakened significantly.
However, speculative capital still appears focused on BTC and larger crypto assets, limiting DOGE’s ability to build strong momentum for now.
Technically, EMA34 remains short-term resistance near 0.106 – 0.107, while EMA89 still trends slightly downward, showing the broader recovery remains fragile.
Crypto market
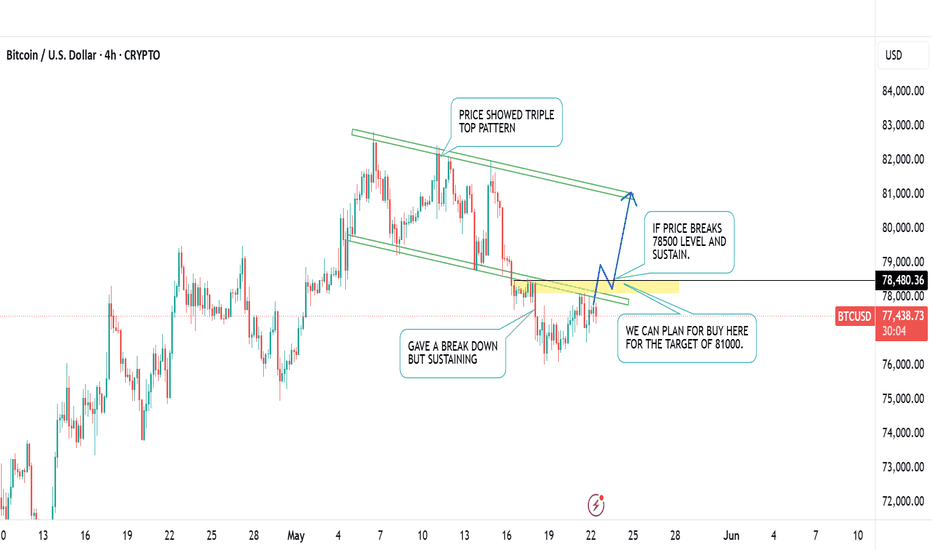
BTC 81000 COMING ?BTC is trading in a tight range. Showed a triple top pattern break down but after the break down price is sustaining and inviting fresh sellers. which could be a trap. if price breaks 78500 level and gives a pull back we can plan long for the target of 81000.
key levels to watch :
1.78500
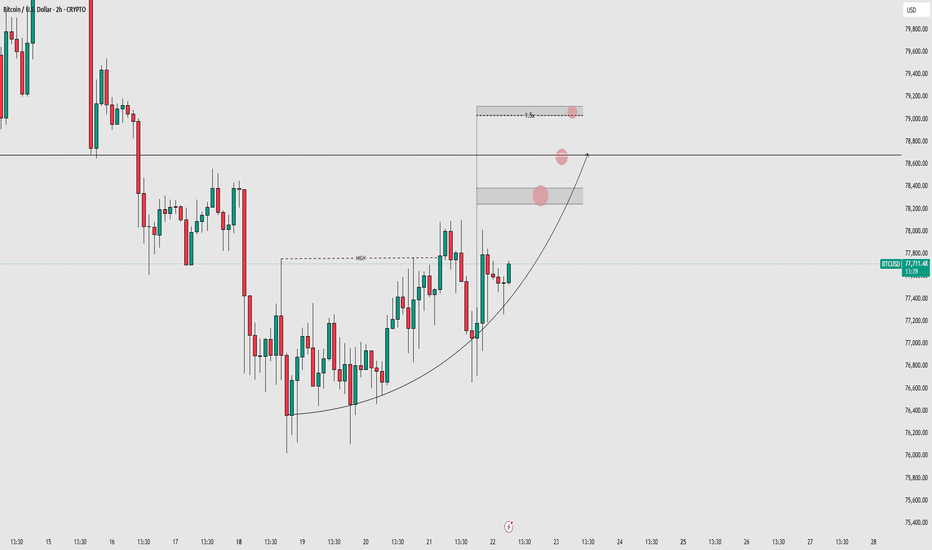
BTCUSD 2H Bearish Reversal SetupThis is my 2-hour Bitcoin analysis, where I have marked three different reversal zones on the chart. Among all of them, the middle zone is the most important area for me.
If the market forms any rejection candle along with a bearish engulfing pattern around this middle line, then the probability of a downside move increases significantly.
At the same time, if the market pushes slightly higher before reversing, there is also a possibility of a 1.5X liquidity-style move before the real bearish continuation begins.
Overall, my market bias remains bearish in this setup because demand is reacting very slowly while supply pressure is entering the market much faster and more aggressively. That is why I prefer to trade with the main trend direction instead of fighting against it.
For now, my main focus is simple:
* Bearish engulfing or rejection confirmation around the middle reversal zone
* Or bearish confirmation around the 1.5X area if price moves slightly higher first
If either confirmation appears, the market could continue moving toward the downside.
Lower timeframes are currently showing too much confusion and fake movement, which is why I prefer using higher timeframes like the 2H chart. Higher timeframes help me understand supply and demand structures much more clearly and make the overall analysis cleaner.
You can also try analyzing on bigger timeframes first — it often helps remove unnecessary confusion and improves market clarity.
This analysis is based on the MMC concepts designed by Candle King. A huge amount of credit goes to him — his concepts have helped improve the clarity and accuracy of my market analysis significantly.
ARBUSD - Breakout Setup Eyes Fresh Upside MoveARB on the 4H chart still looks strong even after spending weeks in consolidation. After the sharp move from 0.089 to 0.136 , the price started correcting instead of fully reversing.
The pullback has been moving inside a descending channel, which usually acts as a temporary cooldown after a strong rally. Price recently defended the 0.113 area and bounced cleanly from it.
RSI is also back above the 60 level, showing momentum is slowly shifting back toward the bulls. That usually supports continuation if the price keeps holding higher lows.
Now ARB is pushing back toward the top of the channel and starting to test resistance again. Price action looks much healthier compared to the earlier part of the correction.
The key level to watch is 0.1327. If ARB breaks and holds above it, the next upside targets come in at 0.1376, 0.1400, and 0.1441.
We will update further information soon.
By @BrightRally_Research
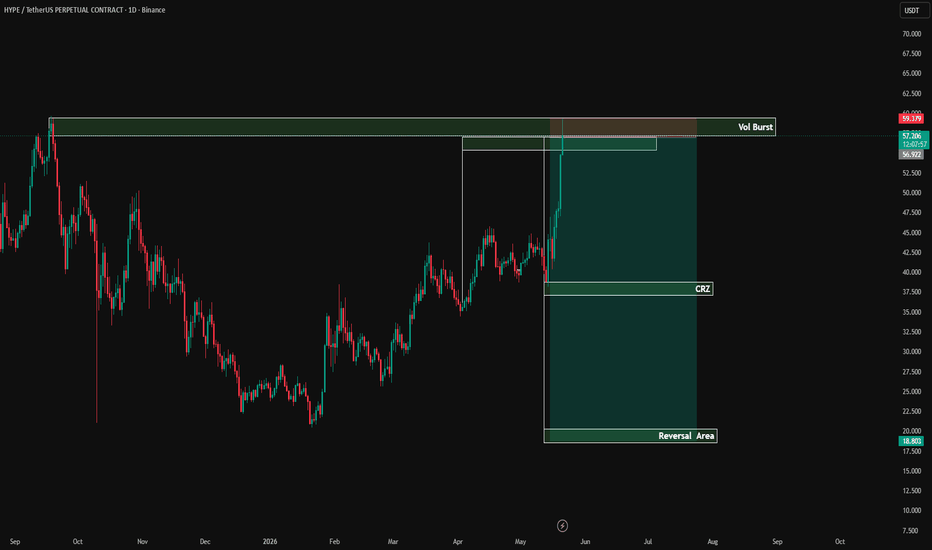
$HYPE IdeaGETTEX:HYPE Reached Its Major Resistance Zone Or You Can Say Near To Its ATH, We Can See A Massive Green Candle (Not Likely IMO), Or A Reversal Till CRZ Or At Reversal Area.
This Is An Idea And Its Should Not Be Taken As An Investment Advice, DYOR Because Its Not A Financial Advice.
GETTEX:HYPE
Bitcoin chart analysis May 20Hello
It's a Bitcoin Guide.
My analysis is optimized for TradingView.
If you press the Replay button, you can check real-time movements.
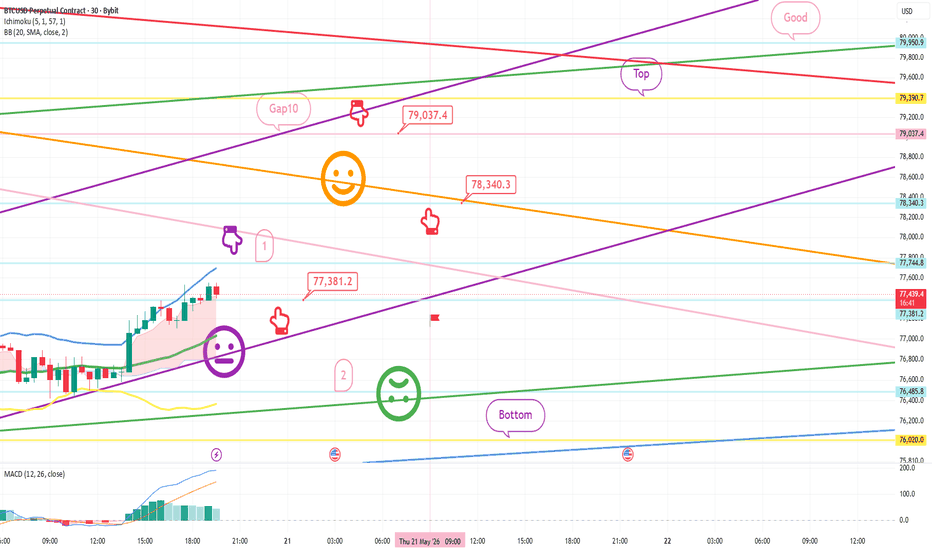
This is the Bitcoin 30-minute chart.
It is consolidating near the center line of the 6-hour Bollinger Bands.
The strategy is a long position before and after touching the purple finger zone #1 at the top.
1) After confirming the purple finger touch #1, the red finger indicates the entry point for a long position at $77,381.2 / Stop loss if the purple support line is broken.
2) $79,037.4 is the target price for a long position.
If the strategy is successful, this is the zone to re-enter a long position at $78.3K.
(The purple finger zone #1 is the center line of the 6-hour chart, and an additional candle is generated at 9 o'clock.)
If it fails to touch zone #1 and falls immediately, the entry point for a long position is zone #2 at the bottom at $76,485.8.
This is the stop loss if the green support line is broken, and the Bottom zone is today's major rebound zone.
Please use my analysis post merely as a reference and for practical application.
I hope you operate safely by strictly adhering to trading principles and using stop loss measures.
Thank you.
HYPE Technical Analysis Next Leg Up Loading HYPE/USDT Daily Timeframe Analysis
HYPE has officially broken above a major resistance zone and is now showing strong bullish continuation momentum. The structure remained bullish for weeks with higher lows forming along the ascending trendline, and buyers finally pushed price into expansion territory.
The recent breakout candle confirms strong market participation and aggressive momentum continuation from bulls.
Key Technical Observations
Clean breakout above resistance zone
Strong ascending trendline support respected
Bullish continuation structure intact
Momentum expansion after consolidation
Higher timeframe breakout confirmed
Important Levels
Breakout Zone: $41 – $42
Trendline Support Area: $37 – $39
Current Momentum Area: $58+
Bullish Projection Target: $72+
If price continues holding above the breakout region, HYPE could attempt another strong expansion phase toward higher liquidity levels.
The overall structure currently favors buyers unless major support zones are lost.
Trading Perspective
Bullish momentum remains strong above breakout support
Pullbacks into previous resistance may act as continuation entries
Risk management remains essential during strong expansion phases
⚠️ This analysis is for educational purposes only and not financial advice.
Zcash Could Shock The Market Again | Technical AnalysisZEC/USDT Daily Timeframe Analysis
ZEC is currently showing a very interesting market structure that closely resembles its previous bullish expansion phase. The chart highlights a strong accumulation zone followed by an impulsive breakout and continuation structure.
After holding the major support region successfully, price started building momentum step by step. The recent breakout move suggests that buyers are gaining control again, and market structure is shifting bullish on the higher timeframe.
One of the most important observations here is the similarity between the previous cycle behavior and the current price action. Historically, ZEC showed explosive expansion after long consolidation periods — and current structure appears to be developing in a similar way.
Key Technical Observations
Strong higher timeframe support reaction
Successful accumulation phase completion
Bullish continuation structure forming
Momentum expansion after liquidity absorption
Historical pattern similarity visible on chart
Important Price Zones
Major Support Zone: $200 – $220
Current Momentum Area: $600 – $680
Bullish Expansion Projection: 200%+ Potential
Long-Term Resistance Zone: Higher breakout continuation possible if momentum sustains
The highlighted projection area represents a possible continuation scenario if bullish momentum remains strong and buyers continue defending higher lows.
Market Perspective
This setup becomes more interesting because ZEC is not only reacting technically from support, but also showing historical cycle behavior that traders often monitor during major trend reversals.
As always, confirmation and risk management remain extremely important because crypto markets can stay volatile even during strong trends.
⚠️ This analysis is for educational purposes only and not financial advice. Always do your own research before trading or investing.
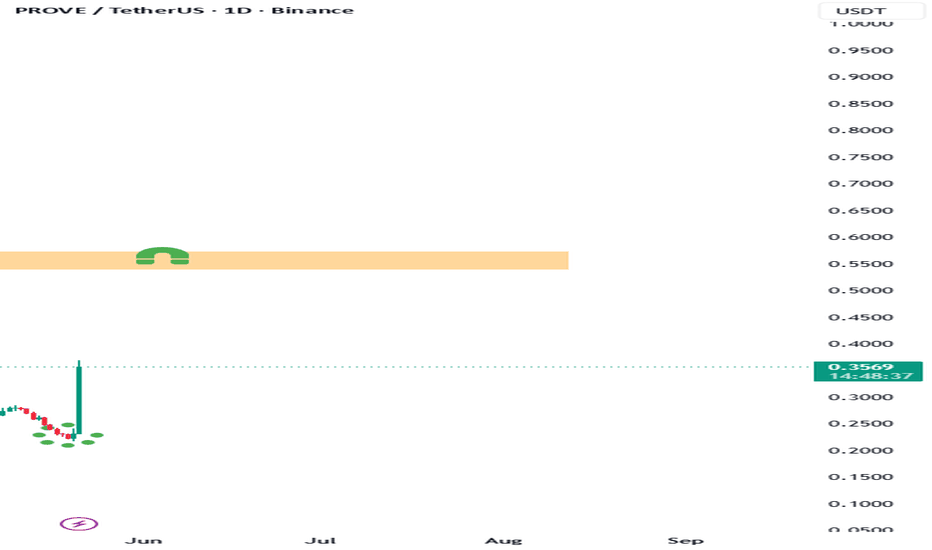
PROVE is preparing for a huge Move PROVE/USDT Daily Timeframe Analysis
After months of heavy bearish pressure, PROVE is finally showing signs of recovery from the lower accumulation region. The recent impulsive candle and strong reaction from local support indicate that buyers are becoming active again.
Price is currently attempting to build momentum after reclaiming short-term structure. If this strength continues, PROVE could start targeting higher liquidity zones and major resistance areas in the coming sessions.
What Makes This Setup Interesting?
Strong impulsive reaction from the lows
Possible accumulation phase after extended downtrend
Buyers defending local support aggressively
Early bullish structure shift forming
Liquidity attraction toward higher resistance zone
Important Levels To Watch
Current Support Area: $0.21 – $0.24
Mid Range Resistance: $0.36 – $0.40
Major Resistance Zone: $0.54 – $0.57
Bullish Continuation Target: Above $0.60
The marked resistance area remains the key zone for bulls. A successful breakout and sustained hold above resistance could trigger a much larger expansion move.
Until then, patience and confirmation remain important because volatility is still elevated.
Trading Perspective
Aggressive traders may monitor continuation from current momentum
Conservative traders may wait for breakout confirmation above resistance
Risk management remains essential in volatile altcoin markets
⚠️ This analysis is for educational purposes only and not financial advice. Always do your own research before investing or trading.
#PROVE #PROVEUSDT #Crypto #Altcoins #TradingView #CryptoTrading #TechnicalAnalysis #PriceAction #SmartMoney #Binance #ChartAnalysis #Bullish #SupportAndResistance #CryptoAnalysis #AltcoinSeason #Bitcoin #Ethereum #Breakout #DeFi #Trading
ONDO BULLISH SETUP FORMING ONDO/USDT Daily Timeframe Analysis
After a long bearish phase and deep correction, ONDO is finally showing signs of strength from a major demand zone. Price reacted aggressively after sweeping liquidity and is now attempting to build bullish momentum from support.
The current structure suggests that accumulation may already be underway. Buyers defended the key demand area successfully, and the recent impulsive reaction indicates growing interest from market participants.
What Makes This Setup Interesting?
Strong bounce from higher timeframe demand zone
Liquidity sweep followed by recovery
Early signs of bullish market structure shift
Potential reversal after extended downtrend
Momentum building near accumulation region
Key Zones To Watch
Major Support Zone: $0.32 – $0.34
Mid Resistance Area: $0.68 – $0.70
Main Breakout Level: $0.95+
Bullish Expansion Target: $1.14
If bulls maintain control above the current support region, ONDO could attempt a strong continuation move toward higher resistance zones in the coming weeks.
Patience and confirmation remain important because volatility around these levels can still be high.
Trade Management Idea
Conservative traders may wait for confirmation above local resistance
Aggressive traders may look for continuation from the demand zone reaction
Proper risk management is essential in volatile crypto markets
⚠️ This analysis is for educational purposes only and not financial advice. Always do your own research before trading.
#ONDO #ONDOUSDT #Crypto #Altcoins #CryptoTrading #TradingView #TechnicalAnalysis #PriceAction #Binance #SmartMoney #CryptoAnalysis #Bullish #SupportAndResistance #ChartAnalysis #AltcoinSeason #Bitcoin #Ethereum #DeFi #RWA #OndoFinance
sui demand zone bounce SUI/USDT Daily Timeframe Analysis
SUI Demand Zone Bounce Could Trigger Big Rally 🚀
SUI is currently reacting from a strong demand/support zone after a sharp impulsive move to the upside. Price successfully reclaimed the key structure area around the previous accumulation range, showing signs of buyer strength and possible continuation.
What I’m Watching:
Strong reaction from demand zone
Higher low formation possibility
Momentum building after liquidity sweep
If buyers maintain control above support, price may attempt another expansion toward higher resistance levels
Key Levels:
Support Zone: $1.02 – $1.08
Mid Resistance: $1.30 – $1.38
Bullish Expansion Target: $1.60+
Current structure suggests accumulation rather than weakness, but confirmation will come only after sustained bullish continuation and breakout strength.
This is not financial advice. Always manage risk properly.
#SUI #SUIUSDT #Crypto #TradingView #TechnicalAnalysis #Altcoins #Binance #CryptoTrading #PriceAction #SupportAndResistance
Ethereum Price Structure Analysis [21/05/2026: Thursday]Probable Scenario Analysis for the 21st of May 2026. The day is Thursday.
(1) Bullish Scenario:
Firstly, the price needs to give a breakout above the level of 2150. If the price sustains above the level 2150, then the probable bullish targets would be - 2175, 2200, 2225, and 2250. Keep an eye on the level 2150.
(2) Bearish Scenario:
Ethereum is not set up to short unless it starts to trade below the level of 2100. Level 2100 is a strong support. It looks like Ethereum bulls are defending. However, if the price decisively breaks down below the level 2100, then the probable bearish targets would be - 2075, 2050, 2025, and 2000. Additionally, if level 2100 is broken, then there will be a sharp sell-off, and all the bulls will be out. New bears will activate to make level 2100 a strong resistance level. Keep an eye on the level 2100.
(3) No Trading Zone (NTZ): (2150 - 2100).
(4) Range of Consolidation (ROC): (2150 - 2100).
Price has been in a range-bound sideways consolidation for the past 4 days . We have to wait for a decisive breakout or breakdown from the ROC. Trading within the ROC will be very difficult as well as speculative. Patience is the key here.
(5) Establish intraday bias with respect to the opening price. Today, Ethereum is trading above the opening price. Thus, unless the price decisively starts to trade below the opening price, do not think of executing bearish trades.
(6) Event: No major high-impact event.
NOTE:
(i) All the analyses would fail in the case of a price structure anomaly. Thus, practice PRAGMATISM in the live session.
(ii) Trade only if there is a setup. Remember, not trading is an extension of the trading activity. Always PRACTICE RISK MANAGEMENT. Always PROTECT your CAPITAL . Be RESPONSIBLE.
(iii) Mark your points. Trade your points. Price is GOD . Plan your trade, trade your plan. Anything can happen in the markets. Therefore, trade what you see, not what you believe.
(iv) Be Strategic. Be Courageous. Be Patient. Be Wise.
(v) Every day is a new day. Thus, do not carry the baggage of past successes or failures. Always trade from a new perspective. The joy of trading should drive effectiveness . Believe in Possibilities.
Happy Trading!
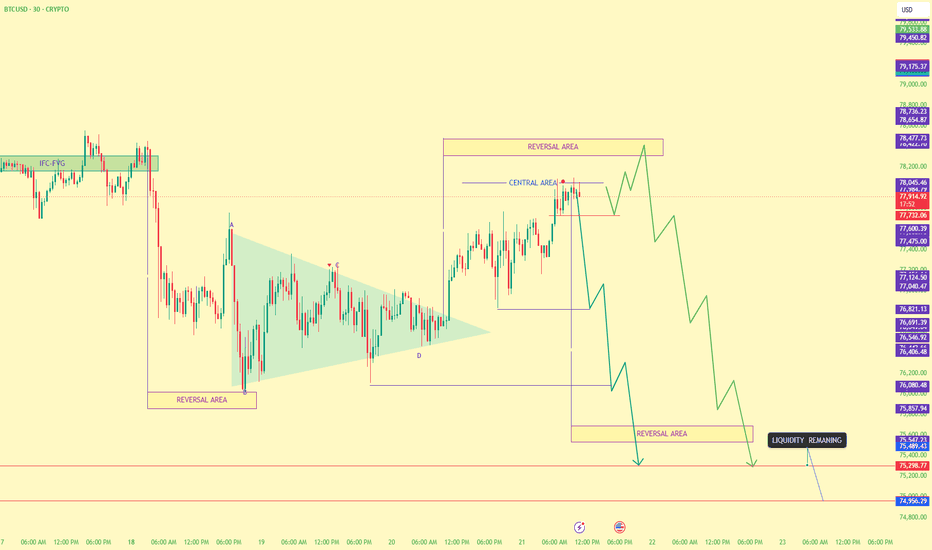
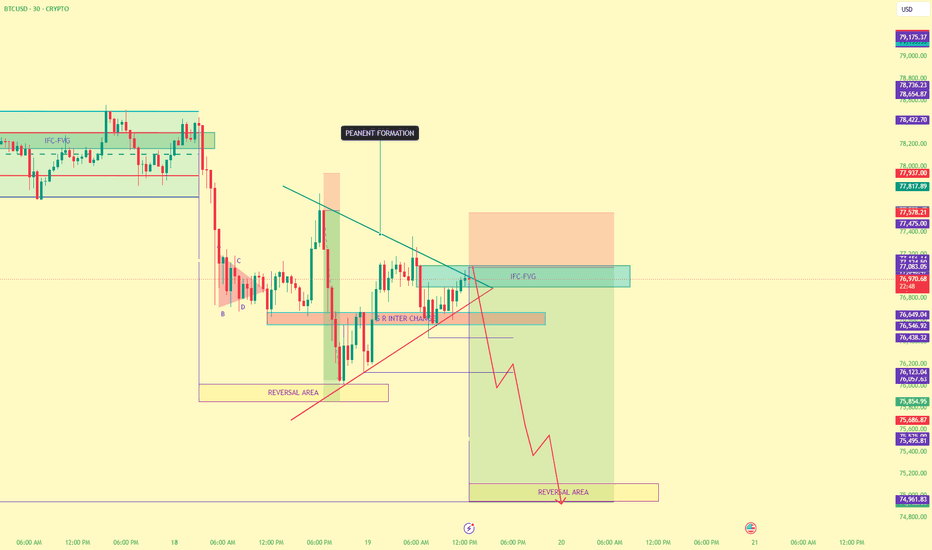
PREDICTION BTCUSD 30 MIN TFCRYPTO:BTCUSD is showing the formation of a bearish pennant, which is generally considered a continuation pattern favoring downside momentum. After the breakout, the market appears to be giving a fake upside move to trap buyers before the actual bearish move begins.
The price is trading inside the central area of the reversal zone, creating two possible scenarios.
1. The First possibility is that since price is already inside the central reversal region, the market may reject directly from current levels and begin the downside move without another major push upward.
2. The Second possibility is that BTCUSD pushes higher into the marked reversal area to complete the liquidity grab and trap late buyers before initiating a strong bearish decline.
Liquidity is still resting below the current market structure, which increases the probability of a sharp bearish expansion toward the lower reversal area.
As long as the pennant structure remains valid, The overall expectation remains bearish with downside liquidity acting as the primary target.
BTCUSD Bearish Structure Finally Looking ClearAfter almost three days, BTC is finally showing a much cleaner structure, and according to my current analysis, the market now looks more prepared for a downside move.
Let me explain the full reasoning step by step.
First, the market successfully broke the previous high, which immediately caught my attention. After that, I noticed an eclipse-type structure forming in the market, which increased the possibility of an FMFR setup — *First Move Fake Than Reversal*.
To build the setup, I copied the previous demand zone and projected it forward, which created a strong reversal zone. My main focus now is simple: if the market forms any strong negative candlestick pattern inside this reversal zone, then the downside continuation becomes highly possible.
The third confirmation comes from the CRAV line structure. There is a strong possibility that the market may break this line and continue moving toward the area where the move originally started.
So currently, I have three major bearish confirmations supporting the downside view:
1. Previous High Breakout
2. Eclipse FMFR Structure
3. CRAV Line Formation
With these confirmations combined, the bearish setup now looks much clearer than before. The next key step is waiting for proper bearish confirmation inside the reversal zone.
Now let’s see how the market reacts from here.
This entire analysis concept is based on the MMC methodology designed by Candle King. A huge amount of credit goes to him — his concepts have helped me improve the accuracy and clarity of my market analysis significantly.
Intraday With Advance Option TradingIntraday option trading focuses on capturing short-term price movements within the same trading session. Advanced option trading combines price action, option chain analysis, Greeks, volatility, and institutional activity to improve trade accuracy and risk management.
1. Understanding Intraday Option Trading
In intraday trading:
Positions are opened and closed on the same day.
Traders mainly trade Index Options like:
NIFTY
BANKNIFTY
FINNIFTY
The goal is to capture momentum, breakout, reversal, or premium expansion moves.
2. Core Elements of Advanced Option Trading
A) Option Chain Analysis
Option chain helps identify:
Support zones
Resistance zones
Institutional positioning
Market sentiment
Important Observations
Heavy Put Writing = Support
Heavy Call Writing = Resistance
Call Unwinding = Bullish
Put Unwinding = Bearish
BTCUSD 30M Short Setup – Rejection at Resistance
TradingView_Screenshot_1779292811959.jpg
Provide me description for tradingview idea
BTCUSD 30M Short Setup – Rejection at Resistance
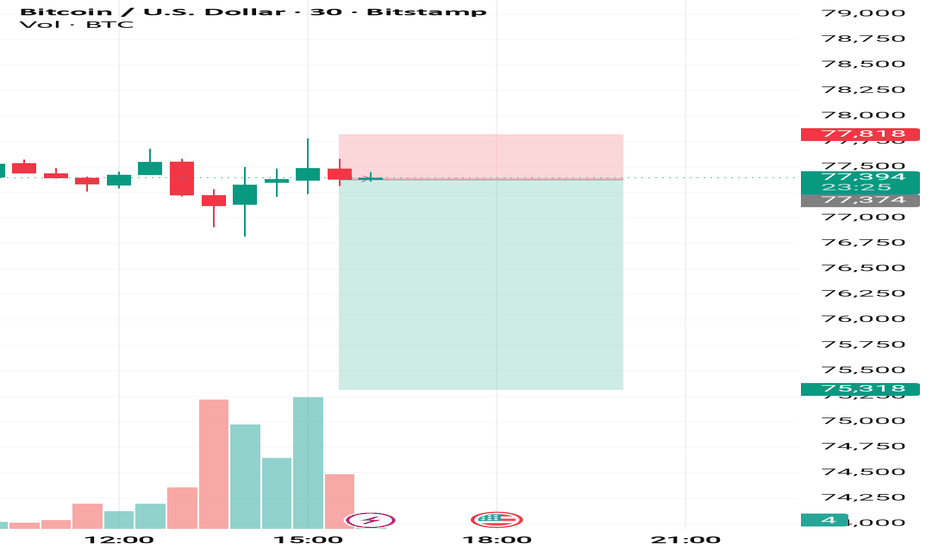
Watching Bitcoin reject the 77.5K resistance zone after multiple failed attempts to break higher. Price formed a bearish reaction candle with declining momentum, while volume suggests sellers are stepping in near local highs.
📍 Entry: 77,394
🎯 Target: 75,318
🛑 Stop Loss: 77,818
This setup offers a strong risk-to-reward ratio as long as price remains below the intraday resistance area. A breakdown below short-term support could accelerate bearish momentum toward the 75.3K region.
Key observations:
Rejection wick near resistance
Weak bullish continuation
Short-term bearish structure forming
Favorable RR setup
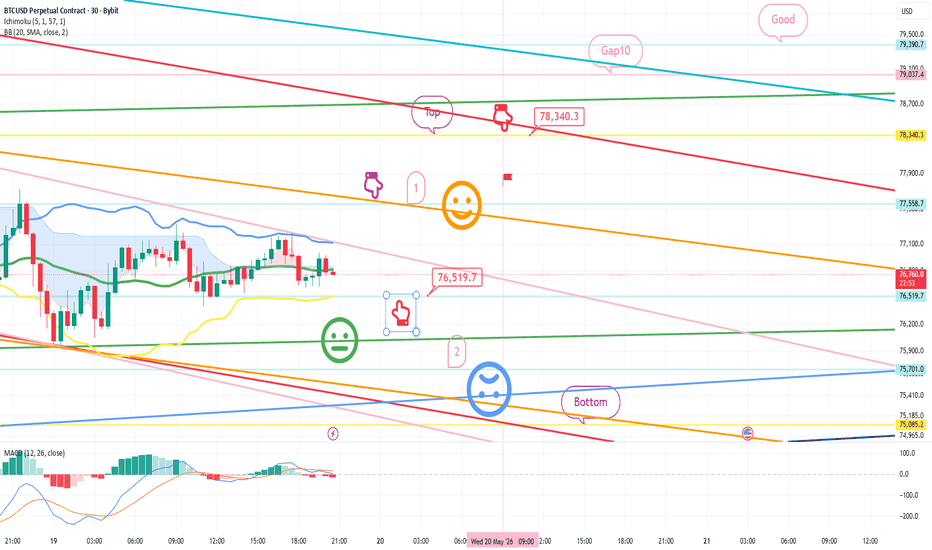
Bitcoin chart analysis May 19Hello
It's a Bitcoin Guide.
My analysis is optimized for TradingView.
If you press the Replay button, you can check real-time movements.
This is the Bitcoin 30-minute chart.
A correction is currently underway, following the movements of the Nasdaq.
*The strategy is a long position before and after touching the purple finger zone #1 at the top.
1) After confirming the touch of the purple finger zone 1
(optional short):
Red finger at $76,519.7 is the entry point for the long position / Stop loss if broken below the green support line.
2) $78,340.3 is the 1st target for the long position -> Gap 10 is the 2nd target price.
If it drops immediately without touching the purple finger:
Wait for a long position at zone #2 at the bottom (75.7K) / Stop loss if broken below the light blue support line.
If broken below the light blue support line, it could fall to the Bottom.
Today, the range from zone #2 to the Bottom becomes a major rebound zone based on the Bollinger Band support lines on the daily chart.
Please use my analysis merely as a reference and for practical purposes.
I hope you operate safely by strictly adhering to trading principles and stop-loss orders.
Thank you.
Ethereum Price Structure Analysis [20/05/2026: Wednesday]Probable Scenario Analysis for the 20th of May 2026. The day is Wednesday.
(1) Bullish Scenario:
Ethereum has been trading in a tight range of (2150 - 2100) for the past 3 days. For a confident bullish trade, the price needs to break out above the level of 2150 and form a higher highs and lower lows structure. If the price decisively trades above the level 2150, then the probable bullish targets would be - 2175, 2200, and above.
(2) Bearish Scenario:
Level 2100 seems to be very strong support. Take no bearish trade unless the price decisively breaks down below the level 2100. If the price decisively breaks down below the level 2100, then the probable bearish targets would be - 2075, 2050, 2025, and below.
(3) No Trading Zone (NTZ): (2150 - 2100).
(4) Range of Consolidation (ROC): (2200 - 2100).
Here, the 2100 level is the center of the range. Presently, the price is trading in the lower region of the ROC. A breakdown or breakout from the range would offer a good trend opportunity.
(5) Establish intraday bias with respect to the opening price.
(6) Event: FOMC Minutes. It's a high-impact event.
Top-Down Analysis:
(1) Monthly TF:
A red spinning top candle inside a green spinning top candle of the previous month. The view is indecision to bearish.
(2) Weekly TF:
A long-legged doji candle formed at the base of the previous week's red marubozu. A confident bullish trade is only possible after the price decisively starts to trade above the level 2200. Level 2100 is a weak support. If level 2100 is broken, then the price would show more bearishness. The view is indecision to bearish.
(3) Daily TF:
A small green marubozu inside the previous day's red spinning top. Maybe it is the pause of the bearish phase. Strong resistance 2150. Strong support 2100. The view is indecision to bearish.
(4) 30-minute TF:
Price is trading in a tight range of (2150 - 2100). A breakout or breakdown would ensure trend recognition. Price needs to come out of the range-bound compression. The view is indecision to bearish.
NOTE:
(i) Trade only if there is a setup. Remember, not trading is an extension of the trading activity. Always practice RISK MANAGEMENT . Always PROTECT your CAPITAL . Be RESPONSIBLE .
(ii) Mark your points. Trade your points. Price is GOD . Plan your trade, trade your plan. Anything can happen in the markets. Therefore, trade what you see, not what you believe.
(iii) Be Strategic. Be Courageous. Be Patient. Be Wise.
(iv) Every day is a new day. Therefore, do not carry the baggage of past successes or failures. Always trade from a new perspective. Believe in Possibilities.
(v) Always PRACTICE PRAGMATISM in the live session.
Happy Trading!
PREDICTION ON BTCUSD 30 MIN TFCRYPTO:BTCUSD chart is showing signs of a potential bearish continuation setup, mainly due to the formation of a pennant pattern after a strong impulsive downside move. A pennant generally represents a temporary consolidation before the market continues in the direction of the previous trend — in this case, bearish momentum.
One of the most important aspects visible on this chart is the presence of resting liquidity below the current price.
If the pennant breaks downward:
- BTC could initiate a fast impulsive move lower.
- The projected path suggests price may sweep the liquidity resting below intermediate
- The market could then continue falling toward the marked reversal area, where stronger
buying interest may finally appear.
- Bearish trigger zone: Breakdown below the pennant support and internal structure.
- Liquidity targets: The lows beneath the current consolidation.
- Major reversal area: Around the highlighted bottom demand zone near the lower boundary of the chart.
Overall structure currently favors the bears. The pennant formation, combined with downside liquidity attraction and rejection from the IFC-FVG area, suggests that BTCUSD may be preparing for another significant leg down. Until buyers reclaim higher structure levels convincingly, the probability of a liquidity sweep toward the reversal area remains elevated.
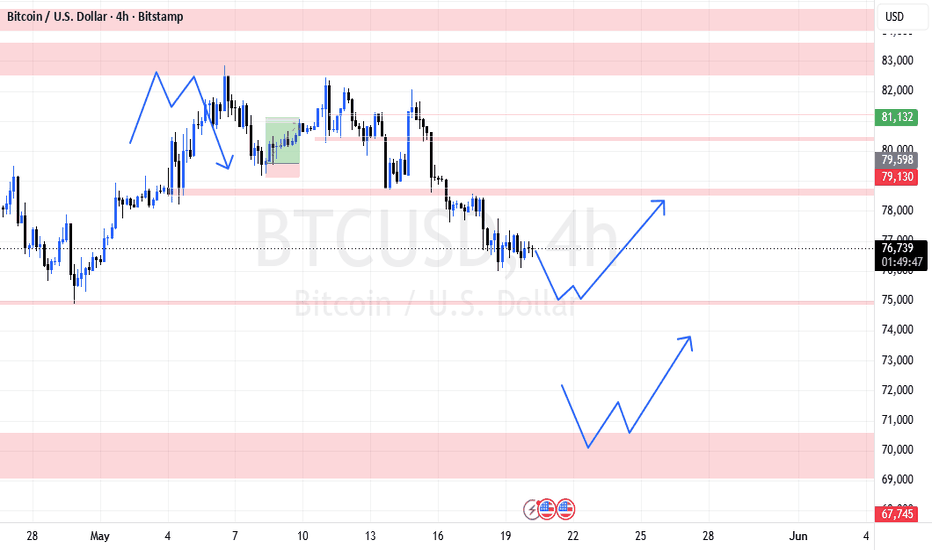
BTCUSD 4H Analysis: Navigating Discount Arrays & Liquidity PoolsMarket Context & Structure
Bitcoin (BTCUSD) recently faced heavy distribution near the $82,000+ region, leading to an aggressive bearish displacement that broke local market structure to the downside. Currently trading around $76,750, price action is consolidating in a transitional zone. Rather than forcing trades in the middle of this range, the most strategic approach is to wait for price to deliver into high-probability discount Points of Interest (POIs) to hunt for accumulation.
Technical Breakdown & Anticipated Scenarios
Based on the mapped demand blocks (red zones), we are tracking two primary paths for a potential bullish reversal, as indicated by the projections:
Scenario 1: The $75,000 Liquidity Sweep & Mitigation
The immediate downside target is the demand zone resting at the $75,000 psychological level. The projected path anticipates a sweep of sell-side liquidity (SSL) just below current consolidation, tapping into this block. If buyers step in to defend this level, we are looking for a structural shift to target the $78,000 - $79,000 supply zone (previous support turned resistance).
Scenario 2: Extreme Discount & Deep Accumulation ($70,000 Zone)
If bearish momentum sustains and slices through the $75k POI, the draw on liquidity will point heavily toward the extreme demand zone near $70,000. This level represents a massive structural floor. A deep plunge into this extreme discount area offers a high-reward macro setup. Accumulation here would provide the fuel needed for a strong rally back toward the $73,000 - $74,000+ fair value levels.
Trading Plan & Execution
Patience is critical. The middle of the range is for observation, the extremes are for execution.
Directional Bias: Macro Bullish, but heavily reliant on finding strong support in discount zones.
Entry Criteria: Set alerts for the $75,000 and $70,000 zones. Do not use blind limit orders. Once price taps these POIs, drop down to the 15m or 1H timeframes. Wait for the algorithm to show its hand via a clear Change of Character (CHoCH), a sweep of lower timeframe liquidity, and energetic displacement to the upside leaving a Fair Value Gap (FVG).
Invalidation: If the extreme $70,000 zone fails to hold and closes aggressively lower on the daily, the macro bullish bias must be reassessed.
Trade the reaction, not the prediction. Manage your risk closely!
(Disclaimer: This analysis is for educational purposes only and does not constitute financial advice. Always wait for your own confirmations before entering the market.)
Trading Oversold MarketsWhat is overbought?
When the market goes up too much, too fast — like it got overexcited. RSI crosses above 70. This means most people who wanted to buy have already bought. Not many buyers left. So the market will likely slow down or fall a bit.
What you do: don't buy now. If you're already in profit, book some of it. Keep your stop loss tight.
What is oversold?
When the market falls too much, too fast — like everyone panicked and sold everything. RSI drops below 30. Most of the panic selling is already done. So a bounce or recovery is likely coming.
What you do: don't rush in all at once. Wait for one green candle or a volume pickup as confirmation. Then buy in small parts.
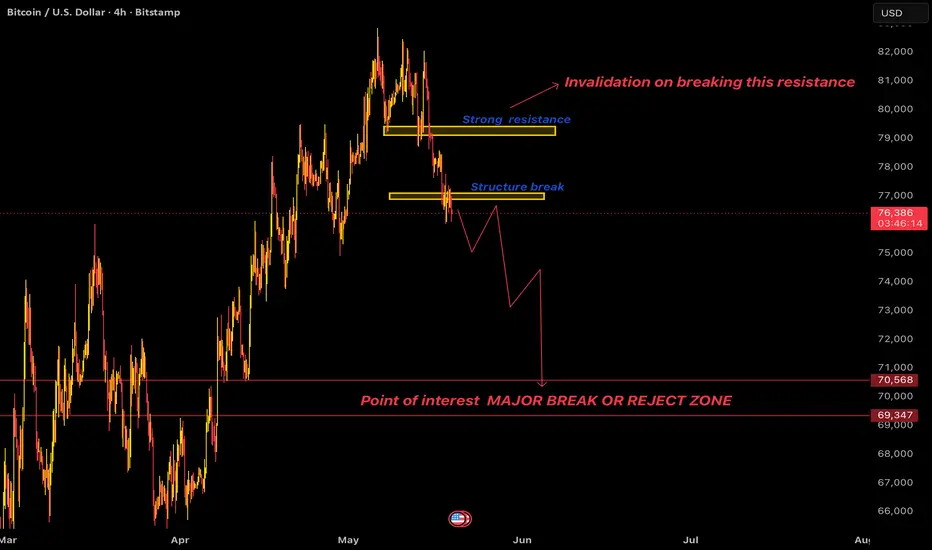
Bitcoin Structure Cracking …Breakdown Pressure Building Weekly .Bitcoin is starting to look weak after multiple failed attempts near the 79K–80K resistance zone. Every bounce is getting sold fast, and buyers are no longer showing the same strength we saw during the rally. The market tried several times to reclaim higher levels, but there’s still no clean acceptance above resistance.
Now the important part is the structure around 76–77K. Price is slowly slipping below support, and the reactions are getting weaker on every bounce. This usually happens before a larger move expands. Instead of continuation, Bitcoin is starting to shift into a corrective phase with lower highs forming across the chart.
As long as price stays below the resistance zone, the downside pressure remains active. The next major area to watch is around 70.5K–69k, which looks like the real make-or-break zone for the next big move. If sellers stay in control, Bitcoin can easily slide toward that region faster than most expect.
Right now this doesn’t look like strong accumulation. It looks more like distribution at highs before a deeper move. Bulls only regain control if Bitcoin reclaims and holds above the resistance zone with strength. Until then, rallies may continue getting faded. Trade safe.
Bias: Bearish below 79K
Invalidation: Strong breakout above 80K
Major Support: 70.5K – 69k
Watch Zone: 76.5K structure area …
BTCUSDT:Testing Key Downward Trendline at Critical Reversal ZoneIf the 2H trendline breaks, then the market direction goes upside.
Bitcoin is trading inside a key reversal zone after a prolonged corrective phase, currently testing a major descending trendline for a potential bullish breakout.
Market Structure: Bearish market structure on the 2H chart characterized by a sequence of lower highs and lower lows.
Trendline Resistance: Price action is tightly hugging a well-defined descending trendline, compressing just under the diagonal resistance.
Support & Demand: The asset has entered a crucial "Reversal Area" / demand zone between $75,650 and $76,250, showing initial signs of price absorption.
Supply References: A clear historical "Supply 2x" zone remains unmitigated above, acting as a secondary magnet if structural shifts occur.
Trading Scenarios
Bullish Trigger: A clean 2H candle close above the descending trendline confirms a market structure shift to the upside.
Bearish Continuation: Failure to break the trendline may lead to a deeper liquidity sweep below the current reversal area.