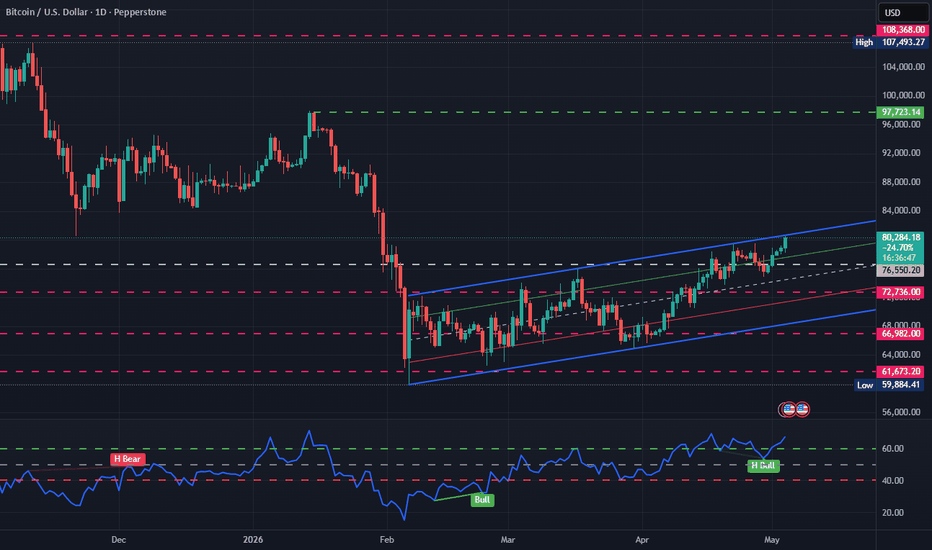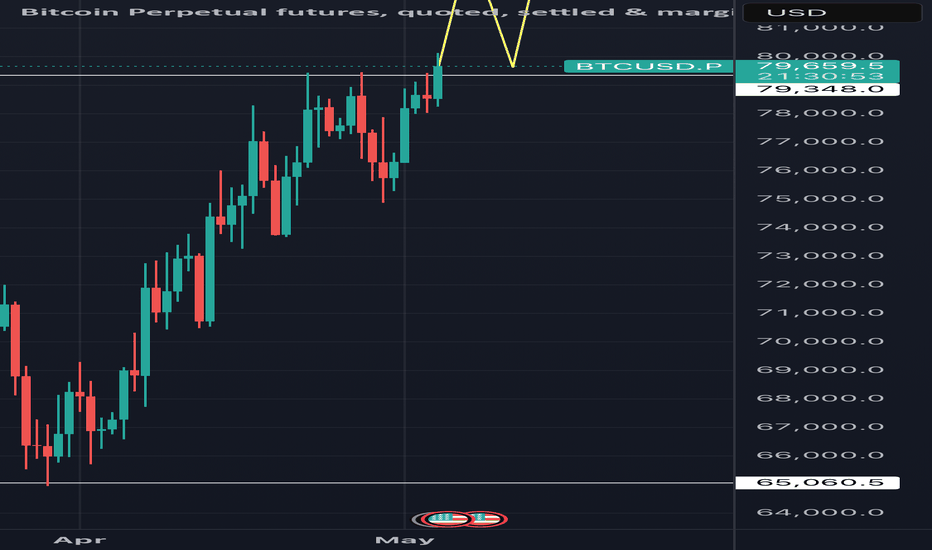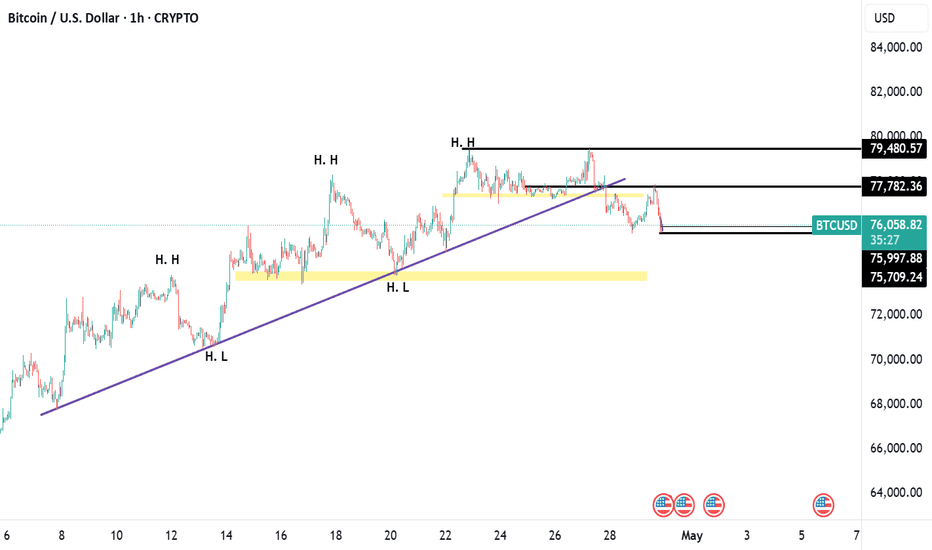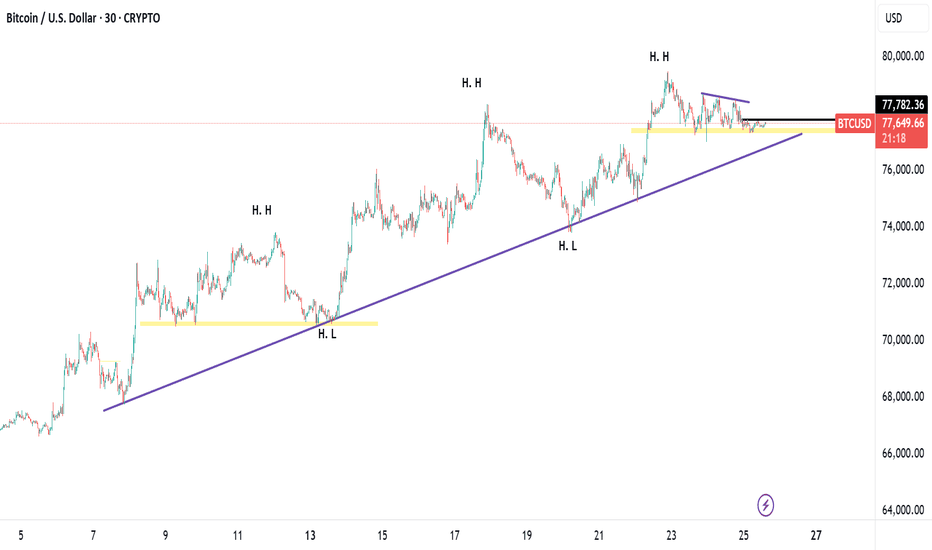
BTC 80,000 SOON ?Currently BTC is range bound and respecting 77000 level. But on a longer times frame it is making a bullish structure of higher highs and higher lows. It is also taking good support from the trendline. so, if BTC break downs the 77000 level to take liquidity of buyers at support.
we can expect a bounce back from 76700 level.
or we can wait and let the price give change of character at current level of 77800, we can plan long.
Two key levels to watch for :
1: 77800
2: 76700
Crypto market
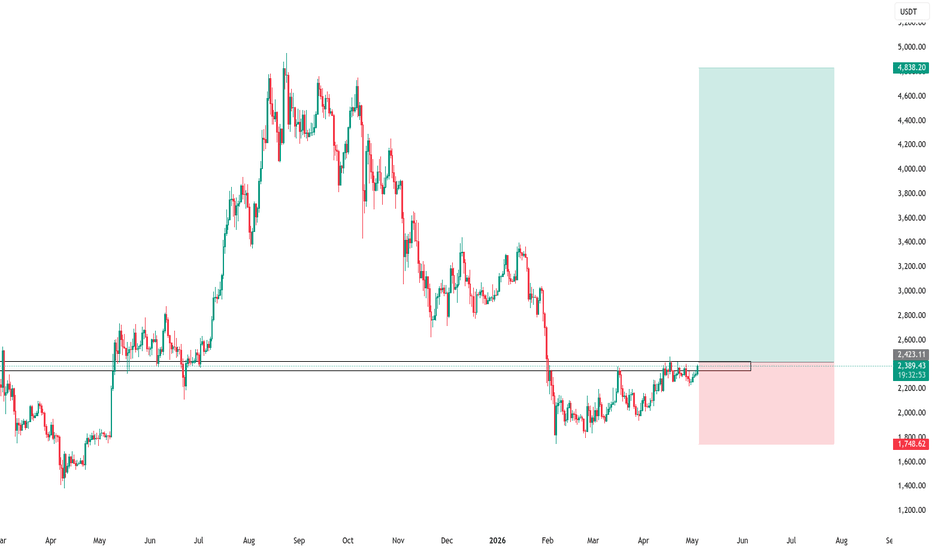
ETH Positional Idea :)What do you think? I am looking for a bullish upside momentum in crypto main coins. I believe there is a cycle going on with the markets, the movement of money was first into gold, while cryptos were falling, oil now has made its move as well. Now its time for the money to come in crypto.
BTC/USDT: Strong Parallel Channel Breakout | Direct Entry Swing Hello Traders,
Let's do a quick technical breakdown of Bitcoin (BTC). We are currently witnessing a massive setup on the charts with high momentum, presenting a great swing trading opportunity.
Market Structure & Price Action:
BTC has been consolidating inside a well-defined parallel channel, but we have just seen a high-volume breakout. This move has created a clear Break of Structure (BOS), indicating that the buyers are in full control and the momentum is shifting aggressively.
The Trade Plan (Aggressive Entry):
Given the sheer strength of this breakout candle, I am NOT waiting for a pullback or retest. Often in these high-momentum crypto moves, waiting for a retest means missing the entire rally. I am taking a direct market entry right here to catch the impulse wave.
Entry Setup: Direct entry at the Current Market Price (CMP) following the channel breakout and BOS confirmation.
Stop Loss: Placed just below the breakout candle or the immediate structure low to protect capital from sudden fakeouts.
Take Profit: As a swing trade, I am targeting a strict 1:3 Risk-Reward (RR) ratio to maximize gains while keeping risk in check.
Note: Direct entries are aggressive, so manage your position sizing accordingly. Never risk more than 1-2% of your account.
Drop a 👍 if you are riding this breakout too, and let me know your targets in the comments below!
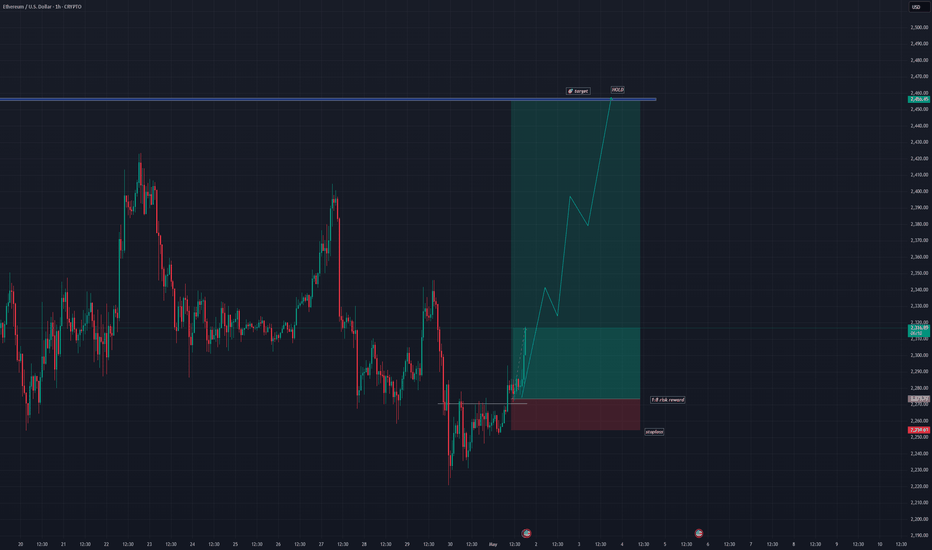
ETHUSD SHOWING A GOOD UP MOVE WITH 1:8 RISK REWARD ETHUSD SHOWING A GOOD
UP MOVE WITH 1:8 RISK REWARD
DUE TO THESE REASON
A. its following a rectangle pattern that stocked the market
which preventing the market to move any one direction now it trying to break the strong resistant lable
B. after the break of this rectangle it will boost the market potential for break
C. also its resisting from a strong neckline the neckline also got weaker hald the price is ready to break in the outer region
all of these reason are indicating the same thing its ready for breakout BREAKOUT trading are follws good risk reward
please dont use more than one percentage of your capitalfollow risk reward and tradeing rules
that will help you to to become a bettertrader
thank you
96,000 coming in BTC!? Bitcoin has officially confirmed a bullish breakout on the daily timeframe, signaling a shift in momentum. The chart reveals a textbook double bottom formation, providing the foundation for this latest move.
Key Technical Observations
Double Bottom Setup: The structure has successfully validated a support zone, setting the stage for a trend reversal.
Breakoute & Retest: We are currently witnessing the initial breakout; a healthy retest of this level will likely serve as the final confirmation before the next leg up.
Price Target: With the current structure in play, I am looking toward the $96,000 level as the primary target for this impulsive move.
The market is showing resilience, and the current price action aligns with a high-conviction setup. Always manage your risk accordingly as we watch for that retest to confirm the path to $96k.
XAUUSD GOLD ANALYSIS ON NEXT MOVE (04 MAY 2025)#XAUUSD UPDATE...!!!
BUY LIMITED = 4610-4600
If price stay above 4580 then next target 4635,4650 and 4668 and below that 4540
Plan1;If price break 4610-4600 area,and stay above 4610 we will placed buy order in gold with target of 4635,4650 and 4668 & stop loss should be placed at 4580
BTC 1H: Stop Hunt Complete — Bears Ready to Send It LowerThis is not bullish continuation — this is a textbook liquidity trap.
Bitcoin engineered a clean BOS to bait breakout traders, swept the buy-side liquidity ($$), and immediately printed a CHoCH, flipping the short-term order flow. The move into the premium FVG is a classic smart money distribution zone, not strength.
That last push up? Pure manipulation. Late buyers are now trapped at the highs while smart money offloads positions into them.
We’re now seeing rejection inside the FVG, with price failing to sustain above the imbalance — a strong sign that sellers are in control. As long as this zone holds, the path of least resistance is down.
What’s next?
Expect a breakdown targeting:
Internal liquidity (equal lows)
Full fill of the lower FVG
Expansion toward the 76.8k region
Execution Plan:
No chasing. Wait for lower timeframe confirmation inside the FVG (weak highs / bearish engulfing / micro CHoCH) — then ride the move.
Bottom Line:
Liquidity taken. Buyers trapped.
Now it’s time for delivery to the downside.
BTC/USD 45M – 🔍 Market Structure
On the 45-minute timeframe, BTC/USD is currently transitioning from a bullish recovery phase into a potential distribution zone. After forming a clear higher low around the 75,000–76,000 region (green demand zones), price impulsively moved upward, creating a short-term bullish structure (higher highs and higher lows).
However, this bullish momentum is now stalling near a strong supply (order block) zone around 78,800–79,500, where previous selling pressure has already been established.
📉 Key Observations
Supply Zone (Bearish Order Block):
The red zone above current price represents a high-probability resistance area, where institutions previously entered sell positions. Price has tapped into this zone again and is showing signs of rejection.
Liquidity & Structure:
The recent push upward appears to have swept buy-side liquidity (equal highs), which often precedes a reversal or pullback.
Momentum Shift:
Internal structure is weakening, with minor lower highs forming inside the resistance zone, suggesting buyer exhaustion.
⚠️ Bearish Scenario (Preferred)
If price fails to break and hold above the supply zone, expect:
A rejection move downward
First target near 78,000 (intra-range support)
Further continuation toward 76,500 – 75,500 demand zones
The marked “Take Profit” area aligns with a logical liquidity draw and previous structure support.
🔄 Bullish Invalidation
A strong breakout and consolidation above 79,500 would invalidate the bearish bias.
This would signal continuation toward 80,000+ levels, confirming renewed bullish strength.
🧠 Conclusion
The chart presents a classic smart money concept setup: price rallies into a supply zone, sweeps liquidity, and begins to lose momentum. Unless buyers reclaim higher ground decisively, the probability favors a short-term bearish retracement.
Patience is key here—confirmation (rejection candles, structure break) will strengthen the setup before execution.
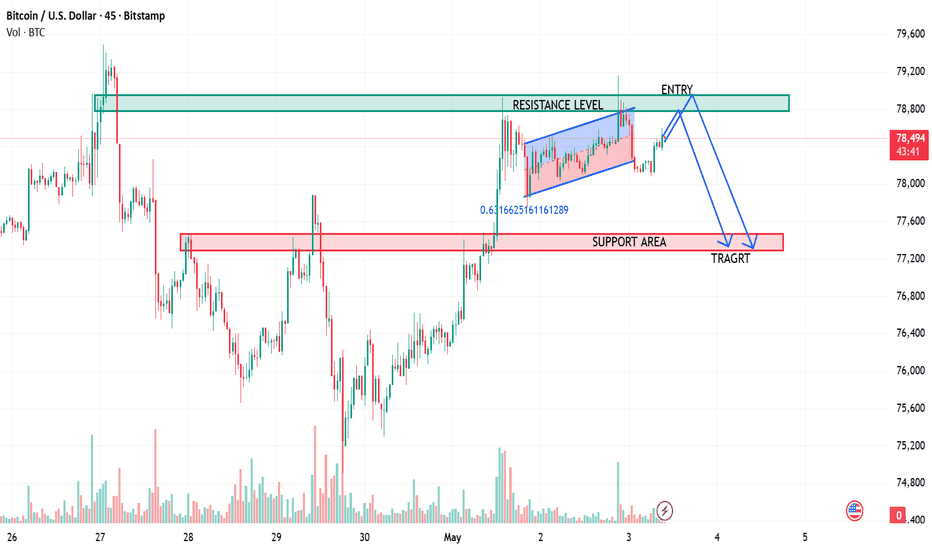
(BTC/USD) – Resistance Rejection SetupBitcoin is currently trading near a major resistance zone around 78.7K – 78.9K on the 45-minute timeframe. Price has formed an ascending channel after a strong bullish impulse, showing weakening momentum as it approaches resistance.
The chart suggests a potential bearish rejection scenario if BTC fails to break and hold above the highlighted resistance area.
Key Observations:
Strong resistance zone near 78,800
Ascending channel indicates slowing bullish momentum
Multiple rejections visible near resistance
Support zone positioned around 77,300 – 77,500
Bearish Scenario:
If price rejects from the resistance zone, BTC could decline toward the marked support area near 77.3K – 77.5K.
Bullish Scenario:
A clean breakout and candle close above 78.9K may invalidate the bearish setup and open the path toward higher levels.
Trading Idea:
Entry: Near resistance rejection
Target: 77.3K – 77.5K
Stop Loss: Above 78.9K
BTC 4H – At Daily Supply, Pullback or Breakout?Bitcoin is currently trading into a strong daily supply zone (~78.5K–79K) after a solid impulsive move up. Price is reacting right at resistance, making this a key decision area.
🔍 Current Structure
Price has reclaimed the 0.5–0.618 zone (76.5K–77.1K) → bullish strength
Now testing higher timeframe supply
Below, multiple sell-side liquidity levels ($$$) remain untouched
🧠 Scenarios
🔴 Bearish Rejection (Preferred Short-Term)
Rejection from daily supply
Sweep internal liquidity → move lower
Targets:
75K liquidity
73K FVG
71–72K FVG (deeper pullback)
🟢 Bullish Continuation
Clean break and acceptance above 79K
Turns supply into support
Continuation toward new highs
⚠️ Key Levels
Resistance: 78.5K–79K (daily supply)
Support: 76.5K–77K (0.5–0.618 zone)
Major downside targets: 73K / 71K
💡 Summary
Price is at a high-timeframe resistance, with liquidity resting below. Short-term pullback is likely unless bulls show strong acceptance above supply.
Wait for confirmation — this is a reaction zone, not a blind entry.
BTC Demand Reclaim – Early Bullish Reversal Structure FormingPrice has delivered a strong reaction from the key demand zone after an extended bearish move, indicating that liquidity below has been absorbed and buyers are stepping in with strength. The sharp rejection from lows suggests this is not just a minor bounce but a meaningful response from institutional demand.
Market structure on the lower timeframe is beginning to shift, with price attempting to form a higher low after breaking the sequence of lower highs. This is an early sign of a potential trend transition from bearish to bullish. However, confirmation is still dependent on price sustaining above this reclaimed support and continuing to print higher highs.
The descending trendline overhead remains a critical dynamic resistance. As long as price trades below it, upside remains cautious. A decisive breakout with strong momentum would signal a change of character (CHOCH) and validate bullish continuation, potentially driving price toward higher liquidity zones.
Volume and momentum behavior also support the bullish case, as the recent move up appears more impulsive compared to the prior decline. This suggests buyers are becoming more aggressive, while sellers are losing control near the bottom range.
BTC/USD Continues Its Uptrend with Caution✅ Market Structure
Overall, the market structure on the H4 timeframe exhibits a complex character — a mix of an uptrend that is starting to lose momentum and a distribution/consolidation phase.
Starting from a low of around $65,500–$66,000 in late March 2026, the price moved impulsively upward following a clearly defined ascending trendline on the chart.
This trendline acted as dynamic support, successfully holding the price down several times before the price action entered a more volatile phase in mid-April.
The Higher High (HH) and Higher Low (HL) structure formed well, leading the price to peak around $79,500–$80,000 around April 17–18.
However, after that, the price failed to maintain its bullish momentum and began forming lower highs in the $79,000 area, which signaled an early weakening of the uptrend structure.
Currently, the price is around $78,243, which means it remains above several key support zones, but has not yet managed to make a convincing breakout above the main resistance.
--------------------------------------------------------
✅ Resistance Zone:
- The first most relevant resistance is located in the $79,000–$79,500 area, which is the previous HH area and has repeatedly served as a price reversal point.
- Above this, strong resistance is located at $80,000–$80,500, which coincides with the upper boundary of the ascending trendline and is psychologically a very significant round level.
✅ Support Zone:
- The first support is clearly visible in the $74,000–$74,500 zone, marked by the shaded gray zone on the chart — this area has been tested twice (around April 17 and April 27) and successfully bounced strongly, confirming it as a solid demand zone.
- The next support is at $71,000–$71,500 (a deeper shaded zone), and major support is at $70,000, which is an important psychological level.
--------------------------------------------------------
✅ Primary Wave Count (from the low of $65,500):
Wave 1 formed from the bottom around $65,500 (late March) and rose to around $73,000–$73,500 in early April — this was a fairly strong first impulse wave following the ascending trendline.
Wave 2 then corrected to around $70,500–$71,000, which is a 50–61.8% retracement of Wave 1, entering the shaded support zone shown on the chart.
Wave 3 was the longest and strongest wave, starting at $71,000 and moving impulsively to a high around $79,500–$80,000 in mid-April — this is consistent with the characteristics of Wave 3, which is the most powerful wave in a cycle.
Wave 4 then occurred as a correction from $80,000 down to the $74,000–$74,500 zone (the demand zone), forming a complex corrective pattern (possibly a zigzag or flat) — note that Wave 4 did not overlap the top of Wave 1, so this wave count remains valid.
--------------------------------------------------------
✅ Conclusion & Trading Plan
Overall Bias: BULLISH with High Caution (Conditional Bullish)
Overall, BTCUSD remains bullish on the H4 chart as long as the $74,000–$74,500 demand zone remains unbroken.
The current price position is likely part of the ongoing Wave 5, with potential targets at $81,000–$83,000.
However, the failure to maintain $76,000 and signs of weakening RSI require traders to avoid being blindly bullish and to always have a clear risk management plan.
$BTC Upcoming Plan And Crash UpdateCRYPTOCAP:BTC To $40K
Analysis For Upcoming Weeks And Months
We Have A Pennant Breakout On Weekly TF, Which Trigger A Movement In CRYPTOCAP:BTC , Technically Its Under Downtrend And It Will Go Eventually Till $40K
I Have Marked A Level To Watch, Its Only For Educational Purpose Only, NFA DYOR
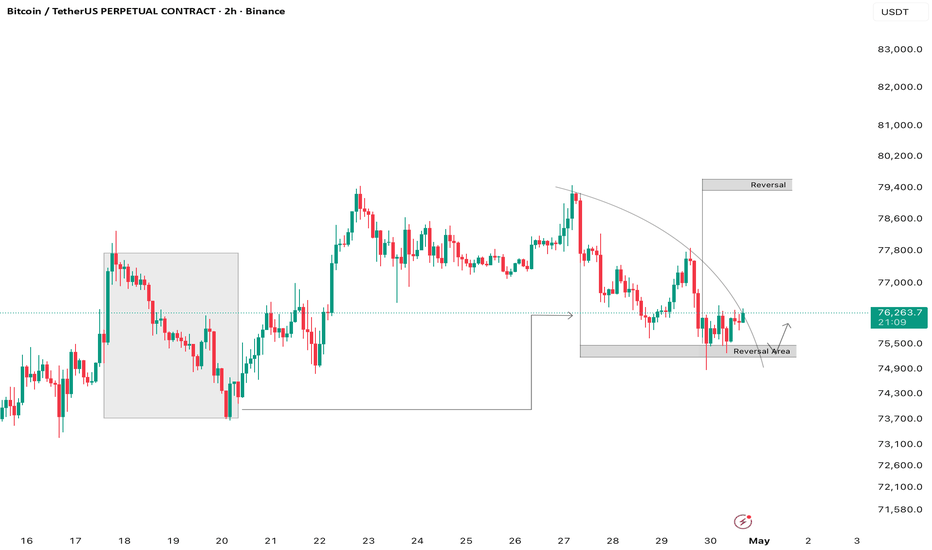
BTC Analysis: Bullish Breakout from "Reversal Area"Bitcoin / TetherUS Perpetual Contract (BTCUSDT.P) on a 2-hour timeframe shows a potential trend reversal from a bearish to a bullish bias as it interacts with a key "Reversal Area".
Breakout Potential: For an upside move to occur, the price must decisively break above the curved resistance line with strong volume. A successful "market break" above this curve would signal a shift in momentum back toward the bulls.
If the Market Breaks the Curve Line Supports Then Market Goes UpTrend Direction, & The Target was 79,324 to 79,608 was Expected.
XAUUSD GOLD ANALYSIS ON (30 APR 2026)#XAUUSD UPDATEDE
Current price - 4580
If price stay below 4610, then next target 4540,4500 and 4470 and above that 4660
Plan;If price break 4580-4590 area,and stay below 4580 ,we will place sell order in gold with target of 4540,4500 and 4470 & stop loss should be placed at 4610
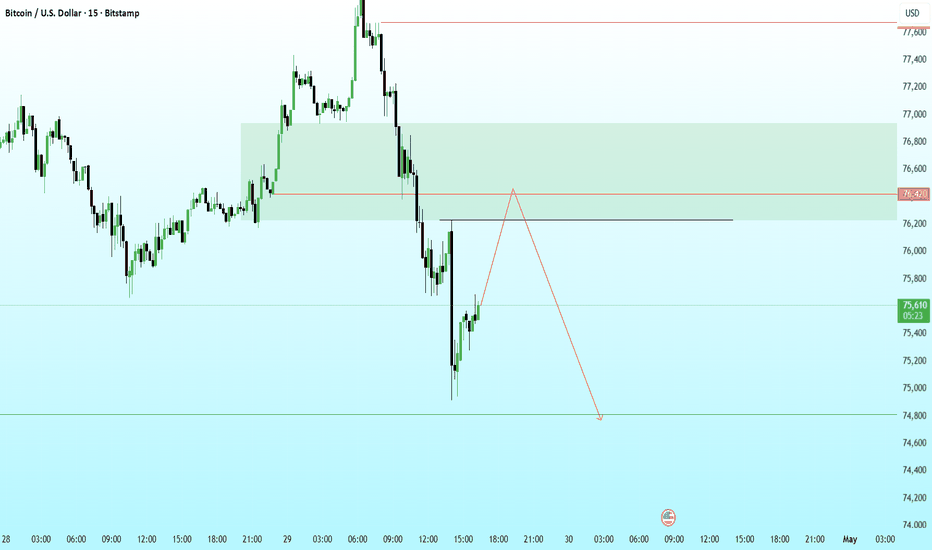
BTC: Premium Rebalance Before the DropImpulse down. Reaction up. Trap set.
BTC has already shown its hand with a strong bearish displacement, slicing through structure and leaving behind a clean inefficiency. What we’re seeing now isn’t strength… it’s a rebalance into premium.
Price is retracing into a key supply zone where liquidity rests above. This is where late buyers step in… and where smart money starts unloading.
Narrative stays simple:
Retracement into premium / imbalance
Liquidity grab above short-term highs
Failure to continue higher
Expansion targeting sell-side liquidity below
That bounce you see forming?
It’s not a reversal… it’s an invitation.
The real move begins once price shows rejection from this zone and shifts structure back to the downside.
Target remains clear: draw on liquidity below the range.
Most traders will chase this upside.
Professionals wait for the trap to close… then execute.
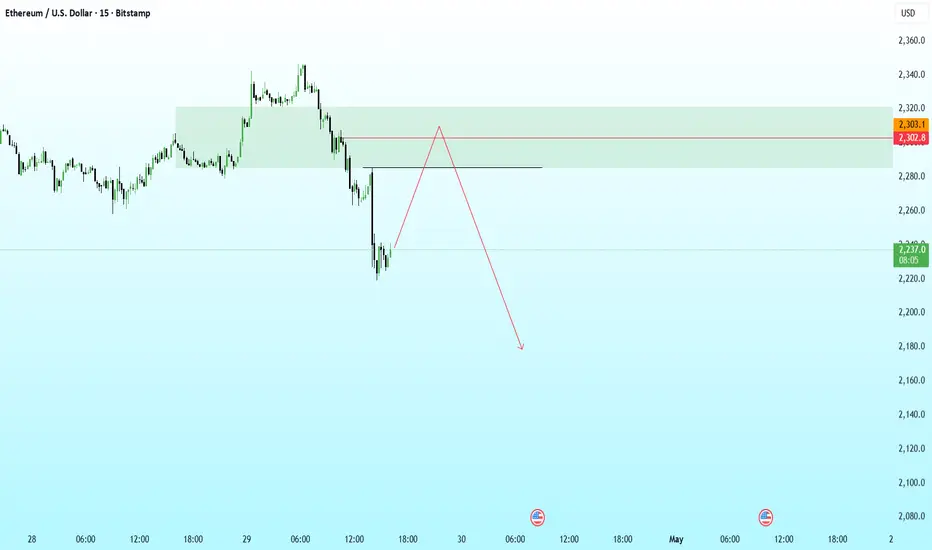
Ethereum: Premium Trap Before Expansion LowerThis isn’t a reversal… it’s a setup.
ETH delivered a clean bearish displacement, leaving behind a clear inefficiency and breaking short-term structure. Now price is retracing into a premium zone where most traders will start getting optimistic again.
That’s the trap.
What we have here:
Bearish impulse = strong intent
Current pullback = rebalancing, not strength
Price approaching a key supply / imbalance zone
My narrative is straightforward:
Price trades into the premium array → taps liquidity resting above → fails to continue → then expands aggressively to the downside.
That red path isn’t prediction… it’s delivery logic.
Key idea:
The market doesn’t reward late sellers or early buyers.
It rewards those who understand where liquidity is engineered.
If ETH respects this zone, the next move should target the inefficiency below and continue the bearish leg.
Most will try to catch the bounce.
Smart money waits for confirmation… then presses.