Bitcoin at a Crucial Zone: Major Rejection or Breakout Next?📊 BTCUSD Daily Analysis
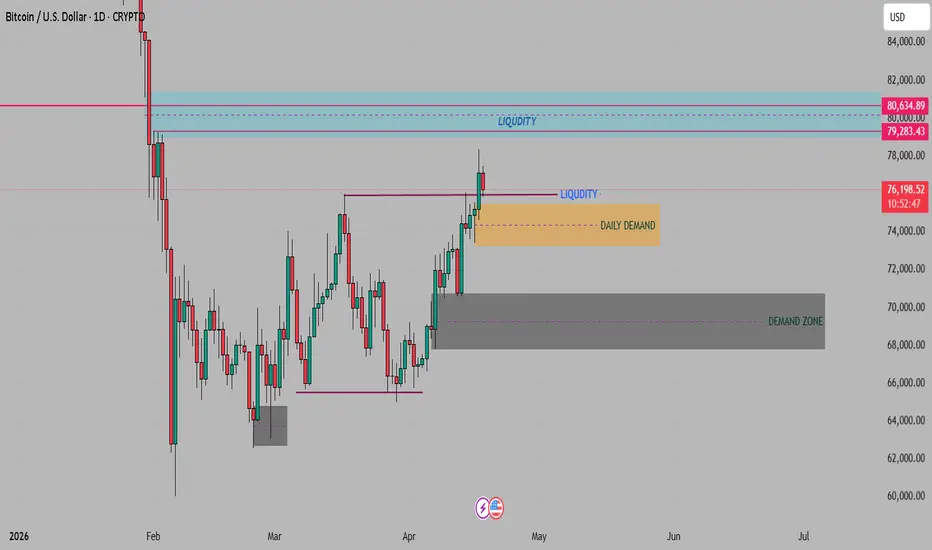
BTC has respected the weekly demand zone and delivered a strong bullish displacement from the 64,434 – 58,901 range, showing a solid reversal structure. After that, price maintained a positive trend for nearly two months, confirming a bullish bias in the market.
In the recent move, BTC tapped the 75,988 high and took liquidity there. The next important liquidity level remains at 79,229, and until that area reacts, the upside bias can remain intact.
On the daily timeframe, there is still one important lower level left, where a weekly FVG and daily order block are forming. So far, the market has not shown any strong reversal signal, which means immediate bearish confirmation is still missing.
🔻 Trade Scenario
If price rejects from 79,229, a short-term correction may occur. However, the monthly selling area + FVG range at 80,977 – 79,283 is still a major resistance zone and can act as a key area to push BTC lower.
At the same time, the 74,500 zone has formed as a demand area and can work as short-term support. If price retraces into this area and shows a reaction, a strong bounce can be expected.
🎯 Key Levels
Monthly selling area / FVG: 80,977 – 79,283
Next liquidity level: 79,229
Recent high / liquidity taken: 75,988
Demand zone: 74,500
Weekly POI / Demand zone: 70,382 – 67,736
Major higher demand zone: 64,434 – 58,901
🔴 Bias and Outlook
For now, the bullish bias remains intact unless price cleanly rejects from the monthly selling area.
If BTC shows a strong rejection from 80,977 – 79,283, downside correction may begin. In that case, the 74,500 demand zone will be the first reaction area, and if that breaks, the 70,382 – 67,736 zone becomes the next major support.
If price sustains above the monthly zone, then bullish continuation remains possible.
🌍 Fundamental Outlook
From a fundamental perspective, Bitcoin is still highly sensitive to macro liquidity and overall risk sentiment. Tight financial conditions, rate expectations, and institutional flows continue to have a direct impact on BTC price action.
So, the current rally should still be viewed as a liquidity-driven move, and a rejection from the major selling zone could increase the probability of a broader correction.
Disclaimer
The information and publications are not meant to be, and do not constitute, financial, investment, trading, or other types of advice or recommendations supplied or endorsed by TradingView.  Short
Short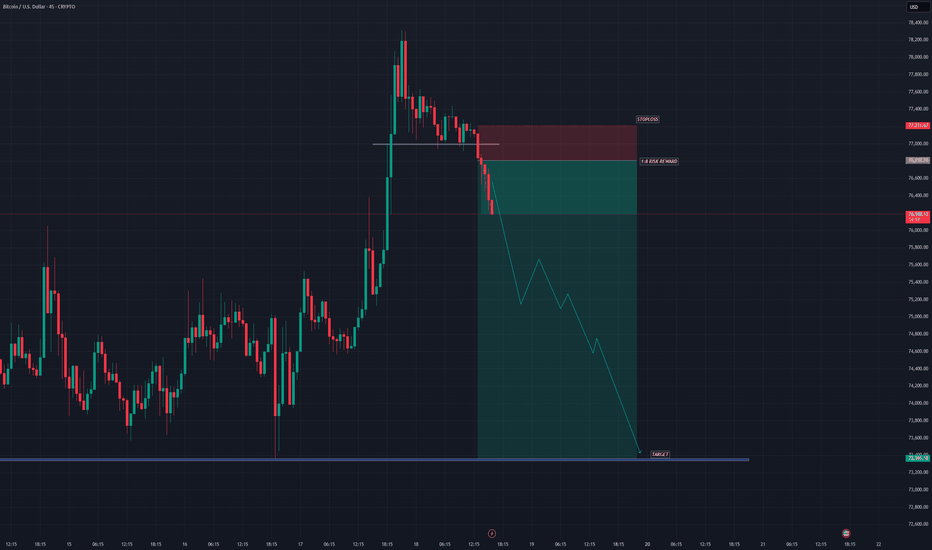
BTC/USD Facing Bearish Rejection from Key Resistance ZoneThe BTC/USD 45-minute chart shows a strong bullish impulse followed by a clear rejection from a major resistance zone, signaling a potential short-term bearish correction.
After the sharp rally from the 74,000 support region, Bitcoin surged aggressively into the 77,100 – 77,600 resistance zone, where sellers stepped in decisively. This area aligns with previous market resistance and has now acted as a supply zone, preventing further upside continuation.
Following the rejection, price started printing lower highs and weaker bullish candles, indicating that buying momentum is fading. The current retracement suggests that the market may be preparing for a downward move toward the 74,000 support level, which is highlighted as the target zone.
The marked entry area near resistance offers a favorable bearish setup, especially as price failed to break and hold above the resistance band. If sellers maintain control below 77,600, the bearish pressure is likely to continue, with the 74,000 region acting as the next major liquidity target.
Traders should watch for continued weakness below the resistance zone, as this would confirm the bearish continuation scenario, while a breakout above resistance would invalidate the setup.
Key Levels:
Resistance Zone: 77,100 – 77,600
Target Zone: 74,000
Bias: Bearish below resistance Short 
Short 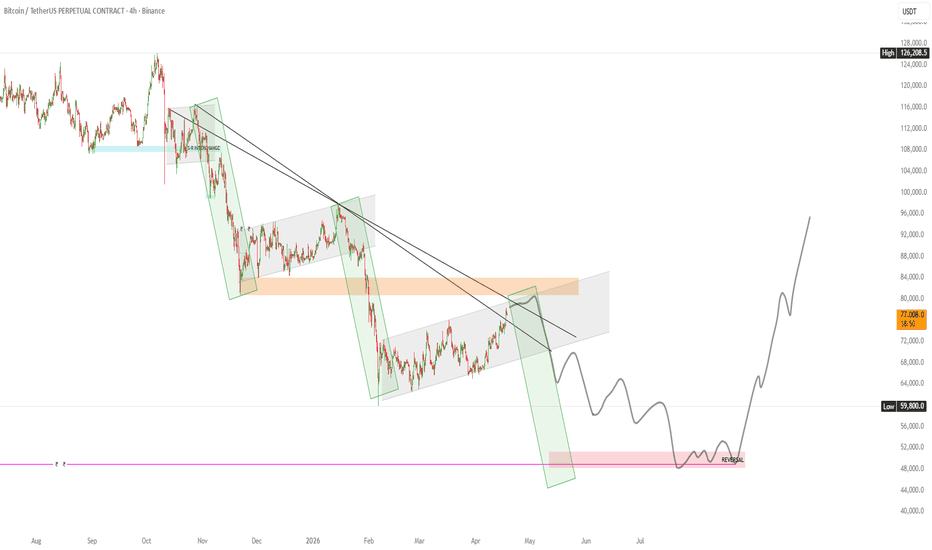
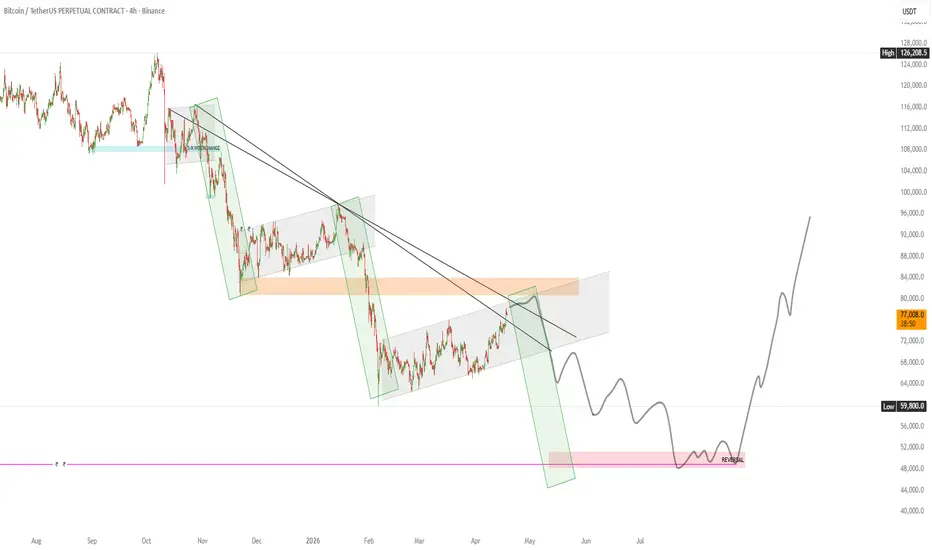
(BTC/USD) Weekly — Liquidity Sweep Setup & Expansion Path Overview
The market printed a strong bullish leg, then formed a distribution/top range.
After that, we see a sharp bearish displacement, breaking structure to the downside.
Current price (~77K) is in a retracement phase after the drop.
📦 Key Zones Marked on Chart
1. Supply Area (120K–123K)
This is the major macro resistance.
Marked as the ultimate target where buy-side liquidity (BSL) rests.
Institutions likely aim for this zone after accumulating lower.
2. Intermediate Supply ($90K–100K)
Highlighted blue zone labeled “$$”.
Acts as short-term resistance.
Price may tap this area, grab liquidity, and reject.
3. FVG (Fair Value Gap)
Around ~78K zone.
Price is currently reacting near this imbalance.
Indicates inefficiency from the previous drop → often revisited.
4. Current Demand Zone (~65K–75K)
Blue box near current price.
This is where short-term accumulation may occur.
Expect choppy price action here.
5. SSL (Sell-Side Liquidity ~60K)
Equal lows / liquidity pool.
Likely target before a larger move up.
Markets tend to sweep liquidity before reversing.
6. Demand Gap (40K–50K)
Strong macro demand zone.
If price drops this deep, it becomes a high-probability accumulation region.
🔄 Projected Scenario (Based on Arrows)
Step 1: Short-Term Bounce
Price may push up into FVG / minor supply (~80K–90K).
Step 2: Rejection
From that zone, expect a pullback.
Step 3: Liquidity Sweep
Price likely dips to SSL (~60K) or even Demand Gap (~45K).
This is where smart money accumulates heavily.
Step 4: Expansion
After the sweep, a strong bullish move toward:
First: 90K–100K
Then: 120K+ (BSL / macro highs)
⚠️ Key Insight
This is a classic ICT-style liquidity model:
Displacement → Retracement → Liquidity Sweep → Expansion
Right now, the market is in the “retracement / distribution before sweep” phase, not yet ready for a clean breakout.
📊 Bias
Short-term: Neutral / Slightly bearish (possible pullback first)
Mid-term: Bearish to sweep liquidity
Long-term: Bullish (targeting new highs) Long 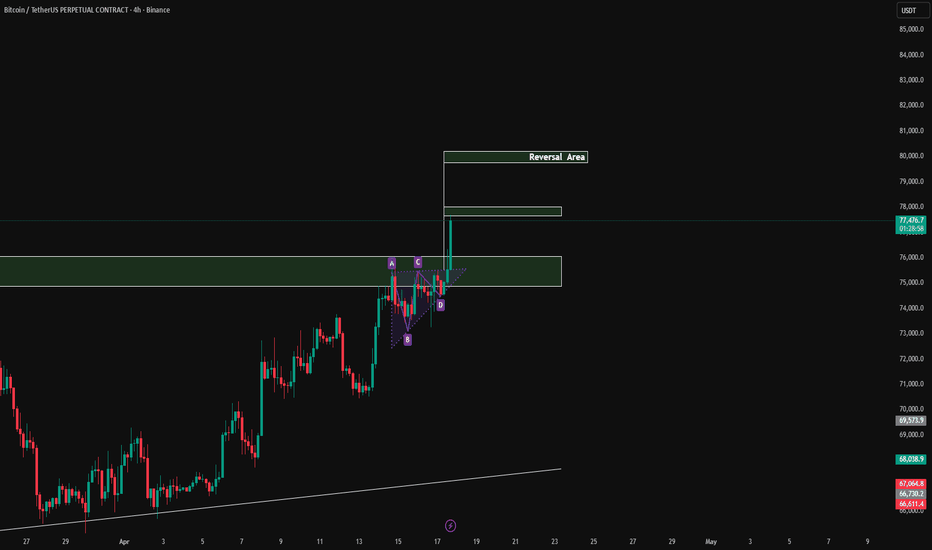
 Long
Long
Short 
BTCUSD_D📊 BTCUSD Daily Analysis
Following the recent strong bearish move, price is currently trading within a channel and forming a flag pattern, which typically signals a continuation structure.
From an Elliott Wave Theory perspective, the market is developing within a larger structure, and price is currently moving inside Wave E of a larger degree.
In the short term, a bullish move is expected toward the 78,970 – 79,332 zone, which is likely to complete the larger Wave E.
After the completion of this wave, the market is expected to reverse and begin a bearish move to form the larger Wave A.
🔻 Trade Scenario
A confirmed breakdown below 70,661 could provide a valid short (short) opportunity for Bitcoin.
🎯 Key Levels
Upside Target (Wave E completion): 78,970 – 79,332
Downside Outlook: Bearish continuation after Wave E completion
🔴 Invalidation Level:
If price breaks above 98,035, this analysis will be invalidated.
🌍 Fundamental Outlook (Aligned with the Analysis)
From a fundamental perspective, Bitcoin remains highly sensitive to macroeconomic conditions, particularly liquidity and monetary policy.
The Federal Reserve continues to maintain relatively tight financial conditions, which tends to pressure risk assets like Bitcoin in the medium term.
Higher interest rates and reduced liquidity generally limit upside momentum in crypto markets.
Additionally:
Institutional demand has shown periods of fluctuation, leading to temporary rallies within broader corrective structures.
Market sentiment remains mixed, with traders reacting strongly to macro data and regulatory developments.
This supports the scenario of:
A short-term bullish correction (flag completion and Wave E)
Followed by a renewed bearish phase, as liquidity conditions and macro pressure weigh on price Short 
Long 
 Long
Long
 Long
Long
BTCUSD_WBTCUSD Weekly Analysis (Elliott Wave Perspective)
On the monthly timeframe, Bitcoin is currently moving within a larger corrective structure. Based on Elliott Wave theory, price is داخل Wave 4 of a larger Wave A.
Considering the presence of hidden bullish divergence, the market is expected to continue its corrective move downward toward the key support zone between 48,290 and 42,922.
After reaching this area, a bullish recovery is anticipated, forming Wave B, pushing price toward the specified resistance zone. Following the completion of Wave B, another decline is expected to form Wave C, ultimately completing the larger Wave 4 correction.
🔻 Invalidation Level:
This analysis remains valid as long as price stays below 127,922.
If price breaks above this level, the scenario will be invalidated.
🌍 Fundamental Analysis (Aligned with the Scenario)
From a fundamental standpoint, the projected corrective structure in Bitcoin can be supported by several macro and crypto-specific factors:
Monetary Policy & Liquidity:
Tight monetary conditions from institutions like the Federal Reserve can reduce liquidity in financial markets, often leading to corrective phases in risk assets like Bitcoin—supporting the expected drop into Wave A completion.
Institutional Behavior:
Large-scale investors may engage in profit-taking after strong rallies, contributing to the anticipated decline toward the support zone before re-accumulating for Wave B.
Regulatory Developments:
Uncertainty around crypto regulations in major economies can create volatility and downside pressure, aligning with the corrective Wave C expectation.
Market Cycles & Halving Effects:
Bitcoin’s historical cycles—often influenced by halving events—tend to include deep corrections within broader uptrends. This supports the idea of a multi-phase correction (A-B-C) before continuation.
💡 Wave B Recovery Justification:
The expected rebound (Wave B) could be driven by:
Renewed institutional inflows
Positive sentiment shifts
Short-term easing in macroeconomic pressure
🔼 Wave C Decline Outlook:
The final leg down (Wave C) may occur if:
Liquidity remains tight
Risk-off sentiment dominates markets
Crypto-specific negative catalysts emerge Short 
Long 
Long 
Short 
BTCUSD/BITCOIN WEEKLY BUY PROJECTION 14.04.26In this weekly chart, BTCUSD is showing a strong bullish recovery setup after respecting the lower support zone. Price has bounced from the key demand area near support S1, and now it is trying to move upward with momentum.
The structure suggests that buyers are stepping back into the market after a prolonged downtrend inside the channel. If this strength continues, Bitcoin could push toward the next major resistance zone around 84,000 to 86,000, which is marked as the target price and resistance R1 area on the chart.
For this setup, the main idea is a buy projection, with stoploss maintained below the recent support zone to manage risk properly. As long as price holds above the support region, bullish continuation remains possible on the weekly timeframe.
So overall, this chart is indicating a potential upside move from support toward resistance, and this zone will be very important for the next major BTC move. Long 
Long 
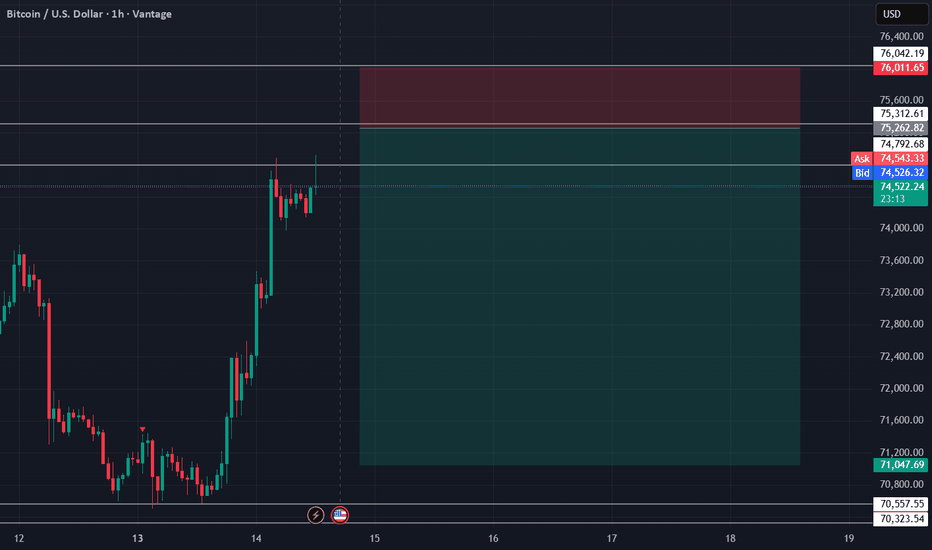
sellHere is a professional and engaging description you can use for your TradingView publication. It highlights the technical aspects of the chart, focusing on price action and market structure.
Title: BTC/USD 1H: High R:R Short Setup at Premium Supply / Resistance
After a sharp, aggressive V-shaped recovery from the recent lows near 70,300, Bitcoin is rapidly pushing back into a premium pricing area on the 1-hour timeframe. While the short-term momentum is strongly bullish, we are approaching a critical resistance zone where a rejection or a deeper retracement becomes highly probable.
This setup anticipates a reaction at the upcoming supply zone/resistance block. The rapid ascent often leaves behind inefficiencies and unchecked liquidity below. We are looking for price to sweep into the 75,260 region, potentially grabbing buy-side liquidity, before initiating a reversal back toward the lower support structures.
Direction: Short
Entry Zone: ~75,260
Stop Loss (SL): ~76,015 (Placed safely above the resistance block to allow for wicks/volatility)
Take Profit (TP): ~71,050 (Targeting a return to the recent discount range and lower liquidity pools)
Risk/Reward Ratio: Approximately 1:5.6
Management:
Given the aggressive nature of the current bullish impulse, wait for a lower timeframe shift in market structure (choch) or a clear bearish rejection candle within the entry zone before blindly placing a limit order.
Disclaimer: This idea is based on technical analysis and price action. It is for educational purposes only and does not constitute financial advice. Always manage your risk appropriately. Short