BTCUSDT: Rejection at 77,400 Resistance Favors a Move To SupportHello everyone, here is my breakdown of the current BTCUSDT setup.
Market Analysis
BTCUSDT previously traded inside a range before breaking higher and shifting bullish. Price then entered a downward channel, where a recent fake breakout above the upper boundary was rejected and price moved back below the Resistance Zone.
Currently, BTCUSDT is trading below the 77,400 Resistance Zone while holding above the 74,400 Support Zone and respecting the downward channel. The recent rejection suggests sellers may attempt another move lower.
My Scenario & Strategy
As long as BTCUSDT remains below the 77,400 Resistance Zone and respects the downward channel, the bearish scenario remains valid. A continuation lower could push price toward the 74,400 Support Zone (TP1).
However, a breakout and close above 77,400 would weaken the bearish outlook and increase the possibility of further upside.
That’s the setup I’m tracking. Thank you for your attention, and always manage your risk.  Short
Short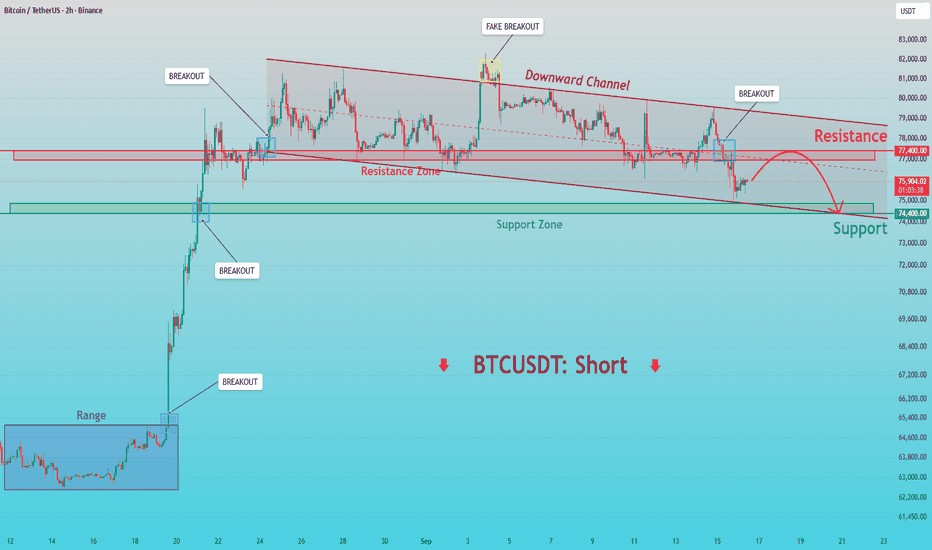
BITCOIN stable after the Fed Rate Hike. What's next?Bitcoin (BTCUSD) has remained mostly stable following the Fed's 0.25 bps rate hike yesterday, despite an initial sell-off on the stock markets. This shows incredible resilience and as we approach the designated end of the Bear Cycle (October 2026) based on the 4-year Cycle Model, the market has now sustained the pressure of two major economic events (counting also Tuesday's Clarity Act failure).
So the picture becomes clearer. According to the past three Bear Cycles since 2014, BTC is on almost an identical 1W RSI pattern of Higher Lows. Only a touch on that trend-line can deliver a price near $60k again, similar to what happened in August 2015 or a 0.5 Fib pull-back as in March 2023. As mentioned numerous times, a weekly closing above the 1W MA50 (blue trend-line), confirms the new Bull Cycle immediately.
The 1W MA200 (orange trend-line) is the technical market Support at the moment and any potential test is a buy opportunity. Especially as Bitcoin enters the 6 week period before the U.S. mid-term elections, which is expected to inflict strong volatility into the markets.
Another striking similarity on this chart is that, after every bottom, the early stages of the Bull Cycles that followed have been inside a Channel Up. In 2020/21 and 2017, those led to parabolic rallies when they broke. In 2024/25 it was much calmer and controlled, almost an extension of the Channel Up itself. So use that to your advantage and once the 1W MA50 breaks, every minor correction towards it, would be a Bull Cycle buy opportunity.
So is there enough time for one last pull-back or the 1W MA50 will break first? Feel free to let us know in the comments section below!
---
** Please LIKE 👍, FOLLOW ✅, SHARE 🙌 and COMMENT ✍ if you enjoy this idea! Also share your ideas and charts in the comments section below! This is best way to keep it relevant, support us, keep the content here free and allow the idea to reach as many people as possible. **
---
💸💸💸💸💸💸
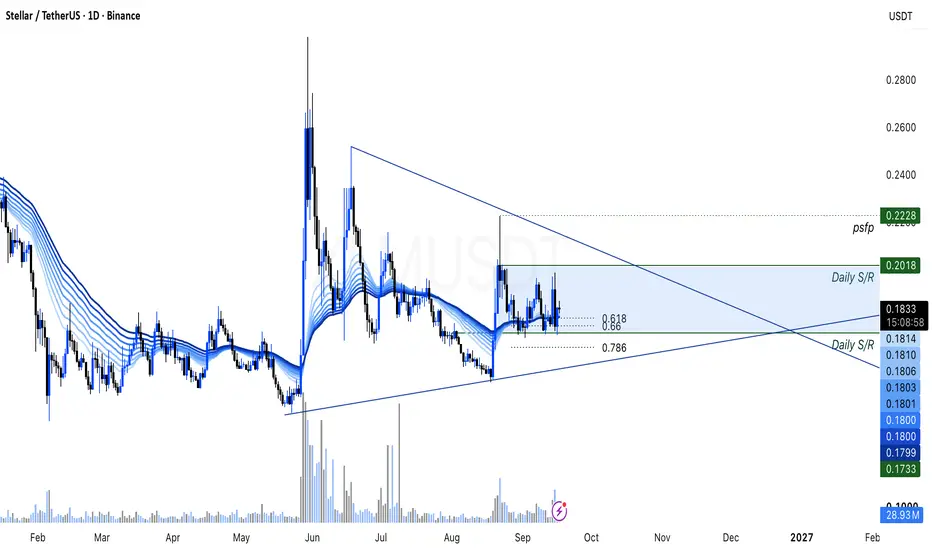
👇 👇 👇 👇 👇 👇 XLM Price Equilibrium, Breakout Incoming ?XLM price action continues to trade within a high-time-frame equilibrium, with neither buyers nor sellers establishing a clear directional breakout. While price remains inside this equilibrium, the current structure suggests that further consolidation may continue before a more decisive move develops.
A breakout from the range would require stronger confirmation, particularly through increasing volume in the direction of the move. If price breaks higher with sustained volume, it could provide greater confirmation that buyers are gaining control and attempting to continue the broader trend. Conversely, a downside break accompanied by increasing selling volume could indicate that sellers are gaining momentum and that a deeper corrective phase may develop.
At present, however, no confirmed breakout has occurred. This keeps XLM within its existing range and leaves the market vulnerable to continued back-and-forth price action around the equilibrium. Traders may therefore want to monitor both the range boundaries and volume behaviour closely.
Until price establishes a clear break supported by increasing volume, continuation of the current consolidation remains a reasonable scenario. The eventual direction should become clearer once price moves beyond the equilibrium and demonstrates sustained acceptance outside the range.
----------------------------------------------------------------------------------------------
UK residents: Don't invest unless you're prepared to lose all the money you invest. This is a high-risk investment and you should not expect to be protected if something goes wrong. Take 2 mins to learn more: coinjar.com/uk/risk-summary
The article is an opinion expressed by the author at a point in time and does not represent the views of CoinJar UK Limited or CoinJar Australia Pty Ltd. Take care to consider the date of this article and be aware that this opinion is based on circumstances at the time of publishing. No responsibility or liability is accepted for any errors of fact or omission expressed therein. Past performance is not a reliable indicator of future results.
This above article is not to be read as investment, legal or tax advice and it takes no account of particular personal or market circumstances; all readers should seek independent investment advice before investing in cryptocurrencies.
We recommend you obtain financial advice before making a decision to use your credit card to purchase cryptoassets or to invest in cryptoassets.In the UK, it's legal to buy, hold, and trade crypto, however cryptocurrency is not regulated in the UK. It's vital to understand that once your money is in the crypto ecosystem, there are no rules to protect it, unlike with regular investments.
You should not expect to be protected if something goes wrong. So, if you make any crypto-related investments, you're unlikely to have recourse to the Financial Services Compensation Scheme (FSCS) or the Financial Ombudsman Service (FOS) if something goes wrong.
----------------------------------------------------------------------------------------------
EU residents: Warning: If you invest in this product, you may lose some, or all, of the money you invest. The value of crypto-assets may rise or fall rapidly. Past performance is not indicative of future results. To learn more see our Risk Disclosures.
CoinJar Europe Limited is authorised by the Central Bank of Ireland as a crypto-asset service provider (registration number C496731)
---------------------------------------------------------------------------------------------- XRP Daily Analysis: Consolidation Below Key ResistanceXRP price action is currently consolidating below a key resistance region, keeping the market at an important technical area. As long as price remains below this resistance, the structure continues to leave room for further corrective movement, particularly if buyers struggle to generate enough momentum to reclaim the level.
A sustained rejection from resistance could increase the probability of a deeper pullback, with the next reaction depending on how price behaves around nearby support zones. Monitoring market structure during any retracement may help determine whether the move remains corrective or develops into a broader shift in direction.
Alternatively, an increase in bullish volume could change the current setup. If stronger volume enters the market and price successfully breaks and establishes acceptance above the resistance region, it would provide greater confirmation that buyers are attempting to resume the broader trend. In that scenario, continuation could become more technically plausible.
For now, the key factor is how XRP responds around resistance and whether volume supports either direction. Until price provides clearer confirmation, both continuation and further correction remain possible scenarios, rather than established outcomes.
----------------------------------------------------------------------------------------------
UK residents: Don't invest unless you're prepared to lose all the money you invest. This is a high-risk investment and you should not expect to be protected if something goes wrong. Take 2 mins to learn more: coinjar.com/uk/risk-summary
The article is an opinion expressed by the author at a point in time and does not represent the views of CoinJar UK Limited or CoinJar Australia Pty Ltd. Take care to consider the date of this article and be aware that this opinion is based on circumstances at the time of publishing. No responsibility or liability is accepted for any errors of fact or omission expressed therein. Past performance is not a reliable indicator of future results.
This above article is not to be read as investment, legal or tax advice and it takes no account of particular personal or market circumstances; all readers should seek independent investment advice before investing in cryptocurrencies.
We recommend you obtain financial advice before making a decision to use your credit card to purchase cryptoassets or to invest in cryptoassets.In the UK, it's legal to buy, hold, and trade crypto, however cryptocurrency is not regulated in the UK. It's vital to understand that once your money is in the crypto ecosystem, there are no rules to protect it, unlike with regular investments.
You should not expect to be protected if something goes wrong. So, if you make any crypto-related investments, you're unlikely to have recourse to the Financial Services Compensation Scheme (FSCS) or the Financial Ombudsman Service (FOS) if something goes wrong.
----------------------------------------------------------------------------------------------
EU residents: Warning: If you invest in this product, you may lose some, or all, of the money you invest. The value of crypto-assets may rise or fall rapidly. Past performance is not indicative of future results. To learn more see our Risk Disclosures.
CoinJar Europe Limited is authorised by the Central Bank of Ireland as a crypto-asset service provider (registration number C496731)
---------------------------------------------------------------------------------------------- BTCUSD | Bearish Rejection & Downside Potential SetupBTCUSD | Bearish Rejection & Downside Potential Setup
Fundamental View
Bitcoin is facing renewed selling pressure as markets prepare for the Federal Reserve’s September 15–16 policy decision. Expectations for a 25-basis-point rate hike have risen sharply, with markets pricing a very high probability of a hike. The increasingly hawkish policy outlook is supporting the U.S. dollar and keeping pressure on risk-sensitive assets such as Bitcoin
At the same time, the U.S. 10-year Treasury yield recently moved above 5%, reflecting tighter financial conditions and adding another macro headwind for crypto markets.
Technical View
On the 1H chart, BTCUSD has rejected the 79,000 area and broken lower from the recent recovery structure.
Price is now trading below the Supertrend and remains beneath the descending trendline. The 77,200–77,700 region is therefore an important resistance zone for the current bearish setup.
If sellers continue to defend this area and BTC breaks below the 75,500 support, the next downside liquidity zone comes into focus, with the broader bearish target around 72,000.
SMC View
From an SMC perspective, the recent rally toward the 79,000 area appears to have interacted with a double-top / buy-side liquidity zone before sellers took control.
The rejection from this premium area has created a bearish shift in short-term momentum. With sell-side liquidity resting below 75,500, a confirmed breakdown could provide the next downside expansion toward the 72,000 region.
This Move Is Supported By
• Hawkish Federal Reserve expectations
• Rising U.S. Treasury yields
• Stronger USD conditions
• Rejection from the 79,000 buy-side liquidity area
• Bearish 1H structure below the descending trendline
• Price trading below the Supertrend
• Potential sell-side liquidity below 75,500
Trading Scenario
Bearish Scenario:
If BTCUSD remains below the 77,200–77,700 resistance zone, sellers could continue targeting the 75,500 support.
A confirmed breakdown below 75,500 could expose the 72,000 area, where a larger reaction may develop.
Bullish Invalidation Scenario:
A sustained move above 77,700 would weaken the immediate bearish structure.
A decisive breakout and hold above 78,090 would invalidate this bearish setup and require a reassessment of the downside thesis.
Key Levels
Resistance: 77,200
Major Resistance: 77,700
Support: 75,500
Bearish Target: 72,000
Invalidation: 78,090
Professional Insights
The 77,200–77,700 region is the key decision zone for this setup. As long as BTC remains below this area and the descending trendline, the bearish structure remains in focus.
The most important confirmation would be a clean break below 75,500 followed by acceptance below the level. A temporary liquidity sweep should not automatically be treated as a confirmed breakdown; a sustained move or retest would provide stronger confirmation.
With the Fed decision approaching, volatility and false breakouts can increase significantly. The reaction to the Fed statement and forward guidance may be more important than the initial rate decision itself.
Risk Management
Avoid treating resistance or support as guaranteed reversal points, particularly ahead of a major central-bank event. Manage position size according to your individual risk tolerance and wait for price-action confirmation before acting on the setup.
The 78,090 level remains the key invalidation for this bearish thesis.
Disclaimer
This analysis is for educational purposes only and does not constitute financial advice. Market conditions can change rapidly, especially around major Federal Reserve events. Always conduct your own research and apply appropriate risk management. Short 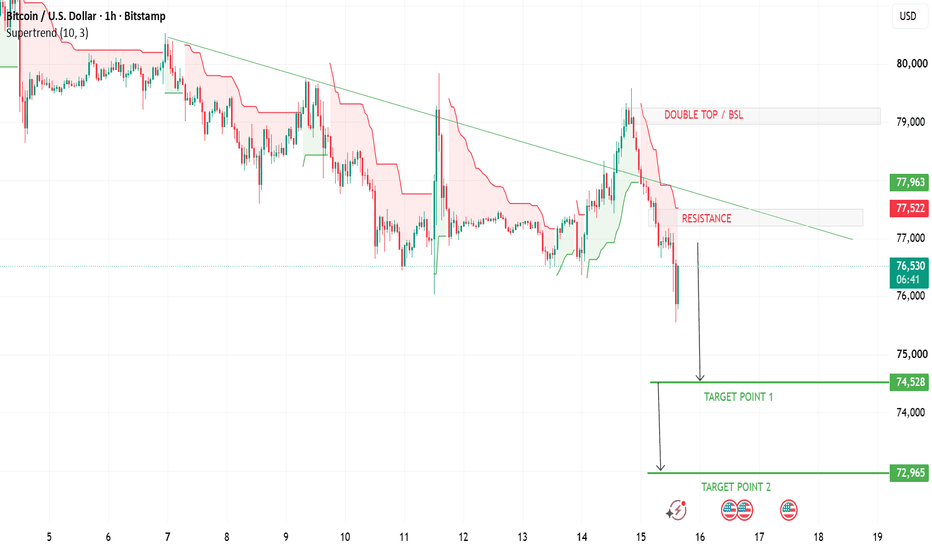
 Long
Long
A Retest Is Only as Good as What Happens Next
A retest is often considered successful the moment price touches a previous breakout level and bounces. That can be misleading because the first reaction tells you that buyers responded, but not whether they were strong enough to regain control.
The better question is what price accomplishes after the bounce.
Suppose CRYPTOCAP:BTC breaks resistance at $80,000, reaches $82,000 and later returns to $80,000. Buyers step in and price rebounds to $81,200. At first glance, the retest worked.
But then CRYPTOCAP:BTC returns to $80,000 only a few hours later.
Buyers respond again, except this time the recovery reaches only $80,700 before losing momentum. On the third test, price barely reaches $80,300 before returning to the level.
The level has technically produced three bullish reactions, yet the behavior is becoming weaker rather than stronger.
This is where failed retests become useful. Instead of counting how many times a level holds, compare what each defense actually achieves. A healthy defense should create separation, reclaim nearby structure and force traders who entered against the breakout to reconsider their positions.
If every bounce travels a shorter distance, lasts less time and returns to the level faster, buyers are spending effort without gaining much territory.
Repeated tests also change the situation. The first return to a breakout area may meet substantial demand, but if price keeps coming back, some of those orders are being filled each time. Unless new buyers continue appearing, the level can become increasingly vulnerable even though it has technically “held” several times.
There is an important difference between a level being defended and a level being under constant pressure.
A strong retest might touch $80,000 once, recover quickly and establish trading comfortably above $81,000. A weak retest might bounce from $80,000 three times while never escaping the immediate area. The second chart contains more successful reactions, but potentially less actual strength.
This gives traders several things to compare after a retest: how far price moves away, how long it stays away, whether the recovery can break nearby structure, and whether each subsequent defense becomes stronger or weaker.
The eventual break of the level should not always be the first evidence that the retest failed.
Often, the deterioration is visible beforehand.
A bounce shows that buyers were present. What they accomplish after the bounce tells you whether their presence actually mattered. Bitcoin: The Former Range Becomes a Key BattlegroundBitcoin has weakened considerably from the 82,000+ region, with the latest move taking price below the lower boundary of its previous consolidation.
The 77,500–78,100 area is now an important structural zone. Price previously consolidated around this region, making its behaviour from below particularly relevant.
Current support sits around 75,500–76,300, with the next major support area around 72,500–73,000.
A recovery above 77,500–78,100 would bring the previous range back into focus, while continued trading below this area would keep the recent breakdown structure intact.
The short-term 4H structure remains under pressure following the range breakdown. We would like to see whether the former range boundary holds as resistance on any recovery, while sustained weakness would keep the lower support zones relevant.
Key Levels
Support: 75,500–76,300
Major Support: 72,500–73,000
Resistance: 77,500–78,100
Major Resistance: 79,500–80,000
This Article is for informational and educational purposes only and does not constitute investment advice. It does not consider the financial situation, needs, or objectives of any specific individual. Any reference to past performance is not a reliable indicator of future results.
Risk Warning: 68% of retail investor accounts lose money when trading CFDs with this provider. You should consider whether you can afford to take the high risk of losing your money. Please refer to our full risk disclaimer on our website. Short 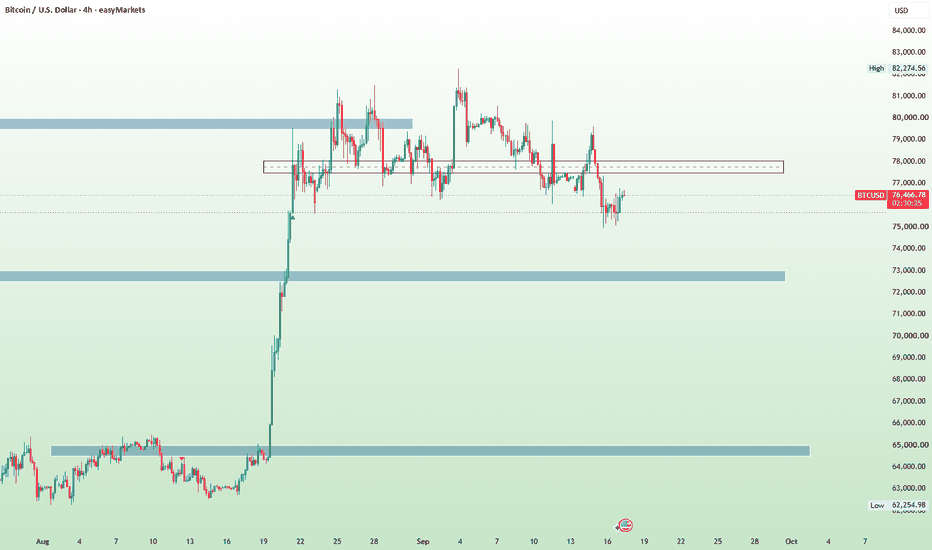
BTC/USD — Professional Technical Analysis📊 BTC/USD — Professional Technical Analysis
🔻 Market Structure
BTC is trading below the descending trendline, keeping the short-term structure bearish.
Supertrend: ~78,856 → currently acting as overhead resistance.
Recent rejection from the 78.8K–79.0K area confirms seller pressure.
🎯 Key Levels
Resistance Zone: 79,000–80,000
Major Resistance: 82,100–82,300
Decision Area: 75,500–76,000
Support Area: 74,900–75,100
Chart Target: ~77,600
🟢 Bullish Scenario
If BTC holds the 75.5K–76K decision area and breaks back above the descending trendline, a recovery toward 77.6K becomes technically possible. A stronger reclaim of 79K–80K would be needed to challenge the broader resistance.
🔴 Bearish Scenario
A decisive break below 75K support would weaken the current setup and could signal continuation of the downward structure.
⚠️ TradingView Summary
BTC is at a critical decision area.
📉 Below the descending trendline = bearish pressure
🟢 Hold 75.5K–76K = possible relief bounce
🔻 Lose 75K = bearish continuation risk
🎯 Upside reference = 77.6K Long 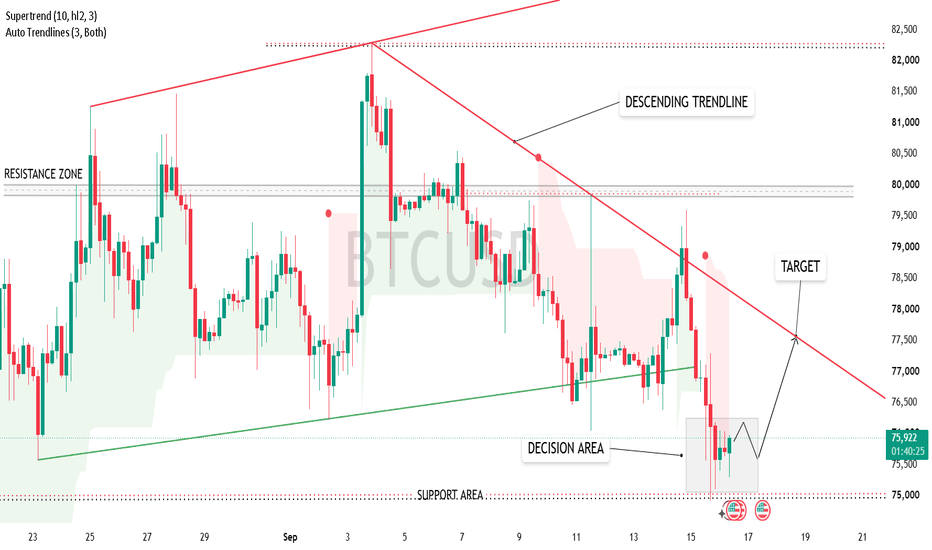
Bitcoin Daily Technical Analysis: Trading Channel at MidpointBitcoin price action continues to trade within a broad descending trading channel, with price currently consolidating around the midpoint of the range. The structure has the potential to develop into a bull flag, but confirmation would require price to maintain the current structure and eventually break above the relevant channel resistance.
If the bull-flag structure holds and bullish momentum strengthens, a sustained move toward the $94,000 resistance area becomes a possible scenario. This level could act as an important test of whether buyers have enough strength to push price beyond the current consolidation.
On the other hand, failure to maintain the bull-flag structure could result in further rotation within the broader channel. A loss of the current support region would increase the possibility of a deeper move toward the $67,500 area, which represents a lower region of interest within the larger range.
For now, Bitcoin remains at a decision point between continuation and further range-bound consolidation. Monitoring how price reacts around the channel boundaries, alongside volume and market structure, may provide greater clarity on the next directional move. Neither scenario is confirmed until price establishes acceptance beyond the relevant levels.
----------------------------------------------------------------------------------------------
UK residents: Don't invest unless you're prepared to lose all the money you invest. This is a high-risk investment and you should not expect to be protected if something goes wrong. Take 2 mins to learn more: coinjar.com/uk/risk-summary
The article is an opinion expressed by the author at a point in time and does not represent the views of CoinJar UK Limited or CoinJar Australia Pty Ltd. Take care to consider the date of this article and be aware that this opinion is based on circumstances at the time of publishing. No responsibility or liability is accepted for any errors of fact or omission expressed therein. Past performance is not a reliable indicator of future results.
This above article is not to be read as investment, legal or tax advice and it takes no account of particular personal or market circumstances; all readers should seek independent investment advice before investing in cryptocurrencies.
We recommend you obtain financial advice before making a decision to use your credit card to purchase cryptoassets or to invest in cryptoassets.In the UK, it's legal to buy, hold, and trade crypto, however cryptocurrency is not regulated in the UK. It's vital to understand that once your money is in the crypto ecosystem, there are no rules to protect it, unlike with regular investments.
You should not expect to be protected if something goes wrong. So, if you make any crypto-related investments, you're unlikely to have recourse to the Financial Services Compensation Scheme (FSCS) or the Financial Ombudsman Service (FOS) if something goes wrong.
----------------------------------------------------------------------------------------------
EU residents: Warning: If you invest in this product, you may lose some, or all, of the money you invest. The value of crypto-assets may rise or fall rapidly. Past performance is not indicative of future results. To learn more see our Risk Disclosures.
CoinJar Europe Limited is authorised by the Central Bank of Ireland as a crypto-asset service provider (registration number C496731)
---------------------------------------------------------------------------------------------- Short 
BTC/USD 4H Technical Analysis: Correction or Breakout Setup?Bitcoin (BTC/USD) remains confined within a well-defined descending channel on the
4-hour chart, extending the sequence of lower highs and lower lows that began after the
early-September peak near $82,000. Price action is currently stabilising near the middle
of the structure, suggesting a period of consolidation rather than a decisive directional
move.
Recent Bounce From Support
Bitcoin recently found support near the lower half of the channel and the lower
Bollinger Band around $74,700. The subsequent rebound has lifted price back toward
the middle of the range, but buyers have so far been unable to reclaim the descending
trendline that continues to cap recovery attempts.
As a result, the recent move appears to be a stabilisation phase rather than
confirmation that the corrective structure has ended.
Bollinger Bands
The Bollinger Bands have begun to contract, highlighting a decline in short-term
volatility.
Upper Band: $78,884
20-Period Average: $76,793
Lower Band: $74,703
Price is currently fluctuating around the Bollinger basis near $76,793, indicating a lack
of strong directional momentum. The upper band aligns closely with channel
resistance, while the lower band marks the area where buyers recently returned to the
market.
RSI Remains Below Neutral
The 4-hour RSI has recovered from recent lows and currently trades around 46.
Although momentum has improved from oversold conditions, the indicator remains
below the neutral 50 threshold, suggesting bullish momentum remains limited. The
recovery in RSI points to stabilisation within the correction rather than a confirmed shift
back to an impulsive uptrend.
Key Levels to Watch
Resistance
$76,800–$77,000 (Bollinger basis area)
$78,800–$79,000 (upper Bollinger Band and channel resistance)
$82,000 (September swing high)
Support
$74,700 (lower Bollinger Band)
$73,000–$74,000 (channel support)
$72,000 (next major technical support)
 Long
Long
HOW-TO: Review Completed LONG and SHORT Scenarios with MSL Smart📌 Overview
This educational example uses the UNIUSDT 1-hour chart to explain how completed LONG and SHORT scenarios are displayed by MSL Smart Trend Manager.
The current status on the published chart is CLOSED, while the earlier markers and labels represent historical scenarios completed on past bars.
The purpose is to explain how signal markers, take-profit labels, trailing-stop lines and exit labels work together. This is not a current trade recommendation or a prediction of future price movement.
━━━━━━━━━━━━━━━━━━━━
🟢 1. Identifying a New Scenario
A green LONG marker indicates the beginning of a bullish scenario. A red SHORT marker indicates the beginning of a bearish scenario.
Each signal establishes a new reference entry at the close of the signal candle. The indicator then displays an ATR-based trailing stop and monitors two volatility-adjusted target levels.
Signals should be evaluated only after the signal candle has closed. They should also be considered together with market conditions, liquidity, volatility and the trader’s own risk-management rules.
━━━━━━━━━━━━━━━━━━━━
🛡️ 2. Following the Trailing Stop
During a LONG scenario, the green trailing line remains below price and can move upward as the market advances.
During a SHORT scenario, the red trailing line remains above price and can move downward as the market declines.
The trailing level only tightens in the direction of the scenario. It does not move farther away to increase the original risk.
When price reaches the trailing level, the scenario closes and a TRAIL EXIT label appears on the chart. A confirmed opposite signal can also end the current scenario and begin a new one.
━━━━━━━━━━━━━━━━━━━━
🎯 3. Reading 1TP and 2TP Labels
A 1TP label means the first volatility-adjusted target was reached during that historical scenario.
A 2TP label means the second target was also reached.
The percentage displayed inside each label measures the price movement from the scenario’s reference entry to that target. These labels record what occurred on historical bars. They are not forecasts and do not imply that future signals will reach the same targets.
Reaching TP1 or TP2 does not automatically close the entire scenario. The indicator can continue following the move with its trailing stop.
After TP2 is reached, the trailing level is moved to protect at least the TP1 level, unless the existing ATR trail is already tighter.
━━━━━━━━━━━━━━━━━━━━
🔎 4. Reviewing the Examples on This Chart
The chart contains several types of historical outcomes:
• Scenarios that reached both TP1 and TP2 before closing.
• Scenarios that reached TP1 but did not reach TP2.
• Scenarios that closed through the trailing stop.
• Direction changes in which an opposite signal began a new scenario.
Reviewing different outcomes is important. The indicator should not be evaluated only from its strongest historical moves.
━━━━━━━━━━━━━━━━━━━━
📊 5. Reading the Dashboard When No Scenario Is Active
The dashboard on the right side of the chart currently shows:
• TREND: NEUTRAL
• Status: CLOSED
• Last Signal: SHORT
This means there is no active scenario at the current bar. Consequently, Profit % and To Trail are not displayed.
The remaining rows summarize the selected sample of recently completed scenarios:
• TP1 — the share and number of scenarios that reached the first target.
• TP2 — the share and number of scenarios that reached the second target.
• SL — the share and number of scenarios closed by the trailing stop before reaching TP1.
For example, “70% / 35 of 50” means that 35 of the latest 50 completed scenarios reached TP1 under the indicator’s current settings.
These figures describe past bars only. They are not a win rate, a profitability calculation or a forecast of future performance.
The statistics do not account for position sizing, fees, slippage or individual execution decisions.
━━━━━━━━━━━━━━━━━━━━
✅ Practical Review Process
1. Locate a LONG or SHORT marker.
2. Follow the matching green or red trailing line.
3. Note whether 1TP or 2TP appeared.
4. Identify where the scenario ended through TRAIL EXIT or an opposite signal.
5. Review both favorable and unfavorable examples.
6. Compare the indicator’s behavior across different market conditions and timeframes.
7. Define position size and acceptable risk independently before using any signal.
━━━━━━━━━━━━━━━━━━━━
⚠️ Important Limitations
MSL Smart Trend Manager is a decision-support indicator. It does not execute trades, provide personalized financial advice or guarantee any trading outcome.
Historical signals, target events and dashboard statistics do not guarantee future results. Market conditions can change, and every trading decision requires independent analysis and risk management.
━━━━━━━━━━━━━━━━━━━━
🔗 Indicator
MSL Smart Trend Manager:
 Education
 Long
Long
Long 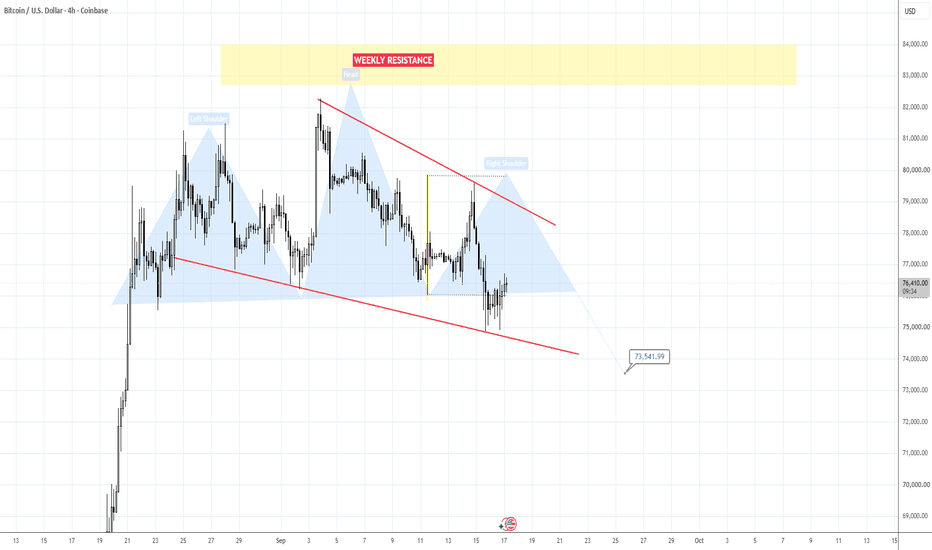
 Long
Long
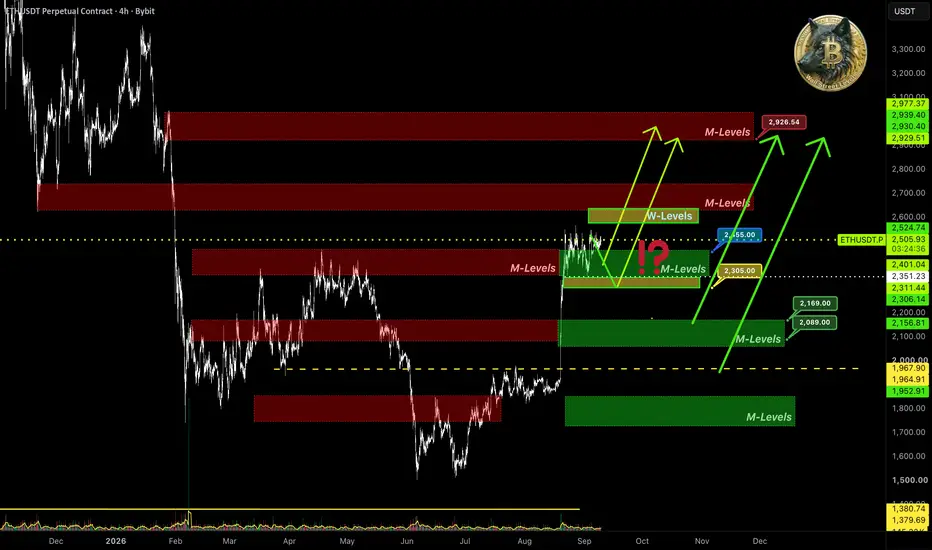
$ETH: Market Thoughts BYBIT:ETHUSDT.P
As seen on the chart, price has been trading at the monthly support 📊M-Levels $2368–$2442 for 2 weeks now, making no strong moves to break the level. But there's no real bounce with position building either. Just the flat market everyone hates.
🧩IMA data shows: the largest players have turned and are closing their long bets. Mid-sized players in the top 20 by position size are neutral — sitting on their hands and doing nothing. The previous institutional buying frenzy is gone. And the crowd, as always in these situations, jumped in at the highs and is waiting for the market to keep going up.
You could say capital is leaving the market, real buyers are scarce.
But during the US session, it's the opposite. While the broader market was selling and pulling money out, 🐋large players were buying a bit of the asset on this dip. It's not enough to move the market yet. We should watch the actions of institutions from US funds: if the buying continues, structurally we are already in a phase of stealth long accumulation.
The picture is mixed. The weekly bullish bias is weakening fast, but institutions are buying the dip during the US session.
What's the conclusion? Buyers are holding the lower boundary for now. But since 🐋large players are exiting positions quickly and the market overall is selling, there's downside risk. But calling a bearish flip is premature.
Trying to buy on the support test right now comes with the risk of a market flush.
For a real rally, we need to see large players' interest return to the spot market. Right now, speculators dominate, and we might just see price chop inside the weekly consolidation range 📊W-Levels $2440–$2560.
⚠️If the idea was useful — glad to have your support 🚀.
Analysis based on 🧩IMA (Integrated Market Analysis)
📊M-Levels — Institutional Interest Level (IIL)  Long
Long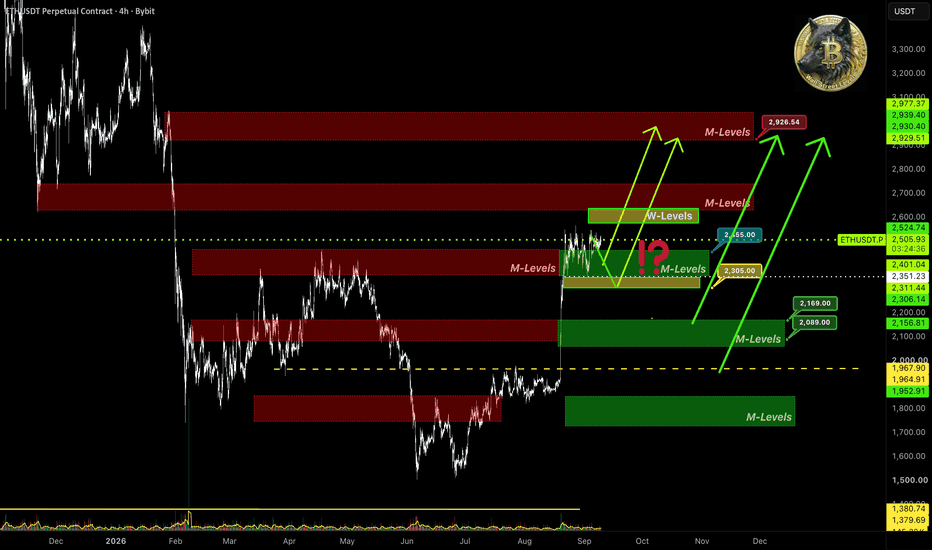
Long 
Bitcoin Price Update – Clean & Clear ExplanationBitcoin is showing a clear rejection from the major resistance area around 79,281–80,069. Price moved strongly upward into this zone but failed to break and hold above it after the rejection, sellers stepped in and pushed price back toward the lower support areas.
Technically Price 79,281 level is now an important rejection level if BTC continues to remain below this area, the market can potentially continue its downside move toward the next support zones.
As long the first important area to watch is around 77,759 a clean break below this level could increase bearish pressure and open the way toward TP1 at 76,926, followed by TP2 around 76,022.
On the other hand, if BTC manages to reclaim 79,281 and successfully breaks above the 79,600–80,069 resistance zone, the bearish setup would become weaker and bullish continuation could come back into focus.
Overall Bias: Bearish while price remains below the major resistance zone. Wait for confirmation and proper risk management before taking any position.
your support means a lot! If you found this analysis useful, leave a Like and tell me your thoughts in the comments. Best of luck with your trading journey! 🚀 Short 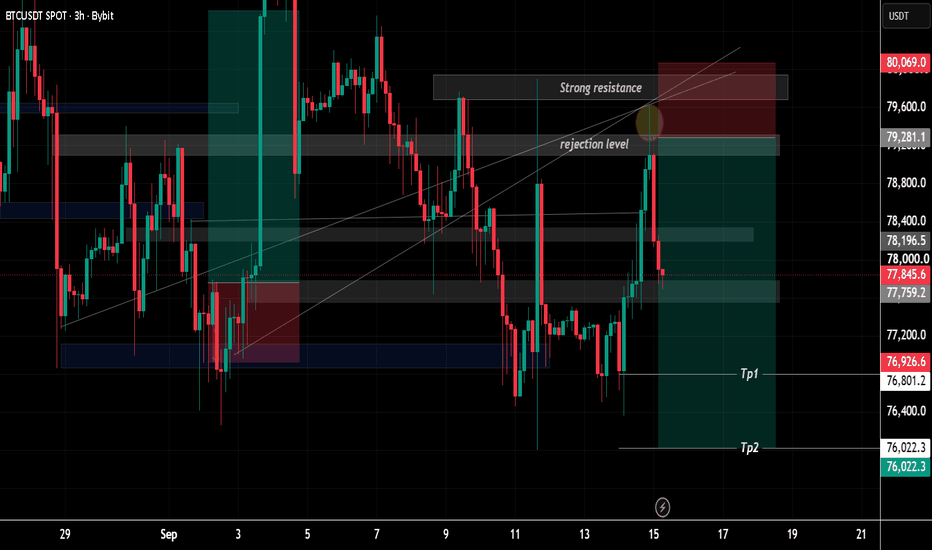
 Long
Long