Why Strong Candles Can Be Weak InformationA large candle attracts attention because it compresses a lot of movement into a short period. Big range, strong close, obvious momentum — visually, it looks important. But candle size and information quality are not the same thing. A strong candle can still tell us surprisingly little on its own if we ignore where it formed, what it interacted with, whether price held the new area, and what happened afterward.
────────────────────────────
SIZE GETS ATTENTION
────────────────────────────
Large candles are useful because they tell us that price moved aggressively during that period. They can show expansion, urgency and a temporary imbalance between buyers and sellers. The mistake is treating that visual strength as the conclusion.
A large bullish candle is not automatically proof that the market is now structurally bullish, just as a large bearish candle does not automatically confirm a reversal. The candle tells us that price moved strongly. It does not, by itself, explain what that move means.
────────────────────────────
LOCATION CHANGES THE MEANING
────────────────────────────
The same candle can carry very different information depending on where it appears. A large bullish candle expanding from a tight consolidation is different from an equally large bullish candle printing directly into an established resistance area after an already extended move.
Both candles can look powerful. Their context is completely different.
That is why I find “Where did this candle form?” more useful than simply asking whether the candle looks strong. Location can turn an impressive candle into meaningful structural information — or reveal that it was mostly a dramatic move into a difficult area.
────────────────────────────
FOLLOW-THROUGH TELLS US MORE
────────────────────────────
A strong candle often creates the impression of confirmation before the market has actually demonstrated anything beyond the initial expansion. What follows can be more informative than the candle itself.
If price continues building in the same direction, holds the newly gained area and develops additional structure, the initial candle gains context. If price immediately retraces, loses the level or turns into overlapping two-sided trade, the interpretation becomes weaker.
That does not mean the original candle was “wrong.” It means the candle described one event, while the subsequent price action told us whether that event actually mattered.
────────────────────────────
EXPANSION IS NOT THE SAME AS ACCEPTANCE
────────────────────────────
Price can move rapidly through a level without proving that the market is comfortable trading beyond it. Expansion answers one question: Did price move strongly? Acceptance answers another: Did price remain there and continue doing business at the new location?
A large candle through resistance can look decisive at first glance. If price immediately falls back below that area and cannot rebuild above it, the expansion still happened, but the broader interpretation changes. The market moved through the level; it did not necessarily establish acceptance beyond it.
That distinction is one reason strong candles can be weak standalone information. The move is obvious. The meaning is still unresolved.
────────────────────────────
CONTEXT IS THE PART THE CANDLE CANNOT SHOW ALONE
────────────────────────────
A single candle cannot tell us whether the move happened after compression or after a long extension, whether it ran directly into a major level, whether the higher timeframe supports it, or whether price later held the area.
Those questions live outside the candle itself.
So when I see a large candle now, I try not to ask only “How strong does this look?” I also ask: Where did it form? What changed structurally? Did price hold the move? Was there follow-through?
Those answers usually matter more than the candle’s size.
Size gets attention. Context gives meaning.
A strong candle can be important. It just should not be asked to explain more than it actually does.
Structure observations, not signals.  Education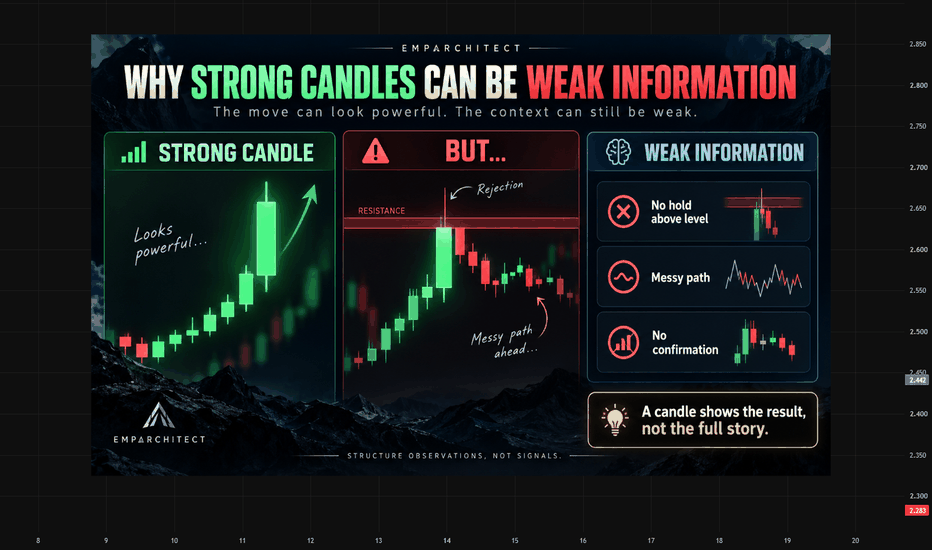
$ZEC | 1D | BUY SETUP |Everyone is calling BINANCE:ZECUSDT a dead legacy privacy coin.
I'm watching a massive 1D structural shift play out in slow motion.
Here is why the crowd is missing the transition from "dead relic" to a high-utility scarcity play. 👇
📊 THE OBVIOUS NARRATIVE vs. THE DATA
The retail crowd sees CRYPTOCAP:ZEC as a forgotten 2016 PoW coin that only gets mentioned during regulatory delisting scares. They think the project lacks momentum and has no future.
But look at the 1D market structure:
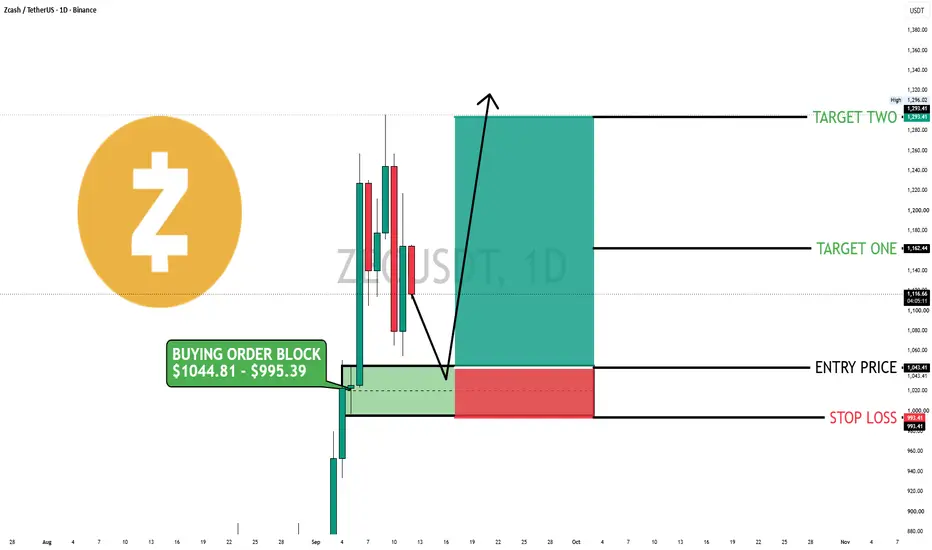
This isn't a dead chart. This is a powerful bullish breakout. Price surged from sub-$880 to a swing high of $1,296.02. Now, it is undergoing a textbook, low-volume corrective pullback to a high-timeframe Buying Order Block between $995.39 and $1,044.81.
🎯 THE DISCONNECT & WHY IT MATTERS
Two massive structural catalysts are completely ignored by the crowd:
Pure Scarcity: Like Bitcoin, CRYPTOCAP:ZEC has a hard cap of 21 million tokens. No private VC unlocks, no hidden vesting cliffs, and no hyper-inflationary emissions.
The Tech Shift: The transition toward Zcash Shielded Assets (ZSA) and Proof-of-Stake (PoS) turns CRYPTOCAP:ZEC from a simple transactional privacy token into a privacy-preserving smart asset layer.
The crowd thinks they are selling an outdated privacy coin. The smart money is accumulating a fully-distributed, ultra-scarce asset ahead of a major network upgrade.
🎯 THE TRADE SETUP
We are waiting for a sweep into the daily demand zone before looking for confirmation.
Buying Order Block: $995.39 – $1,044.81
Entry Trigger: $1,043.41
Stop Loss: $993.41
Target One: $1,162.44
Target Two: $1,293.41
🚨 THE PLAY:
Bullish above $1,043.41. If this major 1D demand zone holds, we have a clean path back toward Target Two ($1,293.41), offering a high-confluence swing setup.
A daily candle close below $993.41 invalidates this bullish thesis. Protect your capital.
Not Financial Advice. ALWAYS DYOR.  Long
Long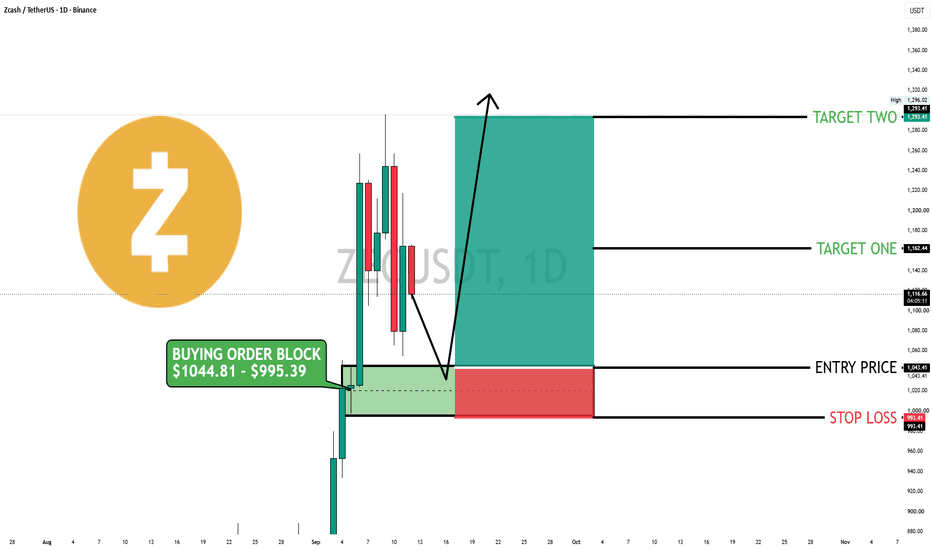
TAO TESTS CRITICAL SUPPORT — ARE BEARS ABOUT TO GET TRAPPED?Yello,Paradisers! are #TAO bears about to get trapped just when the market is starting to show the first signs of a potentially powerful reversal?
💎#TAOUSDT is currently trading around $216 and testing a major Daily Support zone after spending the last sessions moving lower inside a clear falling wedge structure. This is an important location because the higher timeframes remain constructive, with the Weekly and Daily structures still bullish, while the 4H and 1H remain bearish.
💎This timeframe conflict is exactly why patience is crucial here. The short-term trend is still under pressure, but TAO has now reached an area where sellers could start losing control.
💎The falling wedge is becoming increasingly important. Price has already reacted from its lower boundary and is now attempting to reclaim the upper side of the structure. At the same time, we can see a bullish divergence developing on the momentum indicator, suggesting that bearish momentum is weakening even though price recently pushed toward new local lows.
💎As long as TAO continues holding the Daily Support area around $215-$217, the possibility of a bullish reversal remains active. However, simply touching support is not enough confirmation. We want to see buyers prove themselves by reclaiming the falling wedge resistance and establishing strength above this zone.
💎If that confirmation arrives, the first major upside target sits around the $223-$224 1H Resistance. A successful breakout above this level could then open the path toward approximately $230, where the much stronger 4H Resistance begins. Above that, the $231-$232 area would become the next important obstacle for buyers.
💎On the other hand, we cannot ignore the bearish scenario. A confirmed candle close below approximately $212 would invalidate the bullish setup shown on the chart and signal that sellers remain firmly in control. Until either confirmation occurs, aggressively chasing price in either direction provides an unfavorable risk-to-reward situation.
💎This is exactly the type of market structure where inexperienced traders often become impatient. They see support and immediately buy, or they see the short-term bearish trend and start shorting directly into major support. Professional trading requires the opposite approach: identify the important levels first, wait for confirmation, and only then execute when the probabilities become favorable.
💎TAO is approaching a decision point. The Daily Support, falling wedge structure, and developing bullish divergence are giving buyers an opportunity, but price still needs to confirm that the reversal has actually started.
Strive for consistency, not quick profits. Treat the market as a businessman, not as a gambler. Patience around levels like these is what separates disciplined traders from those simply reacting emotionally to every candle.
MyCryptoParadise
iFeel the success🌴  Long
Long
Gold at a Decision Point: The 200 EMA Could Define the Next Move
Gold is approaching an interesting technical decision on the daily chart .
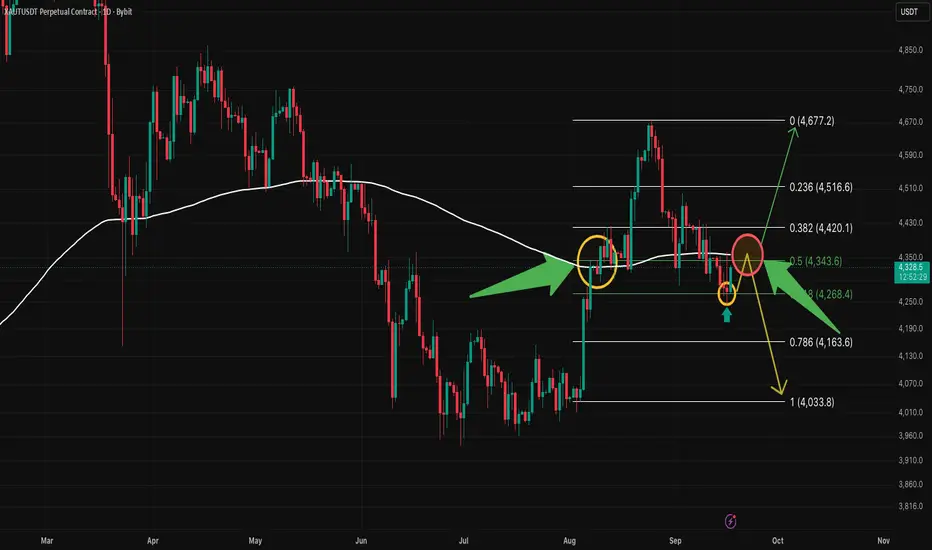
A few weeks ago, price pushed through the 200 EMA and started trading above it. Since then, we’ve seen a deeper retracement through the Fibonacci structure, reaching the area around the 0.618 retracement at 4,268 before buyers stepped back in.
Price has now recovered toward 4,320.
And once again, one level is becoming particularly important:
The 200 EMA.
🎯 One Level Could Change the Picture
Instead of filling the chart with indicators, the current setup can be reduced to a relatively simple question:
Can Gold establish itself back above the 200 EMA — or will price get rejected around it?
That distinction could determine which side of the current Fibonacci structure becomes more relevant next.
Right now, price is trading close to the 0.500 Fibonacci level around 4,344, with the 200 EMA running through essentially the same area.
That creates an interesting technical confluence.
📈 Scenario 1: Gold Reclaims the 200 EMA
If Gold can push through the 200 EMA and establish itself above this area, the bullish scenario becomes more interesting.
The next Fibonacci areas visible on the chart are approximately:
0.382 → 4,420
0.236 → 4,517
0 → 4,677
The larger bullish scenario would therefore bring the previous high around 4,677 back into focus.
But a move above the EMA alone isn’t enough.
What matters is whether price can actually hold above the area rather than simply trade through it temporarily.
A breakout and acceptance are two different things.
📉 Scenario 2: The 200 EMA Rejects Price
The opposite scenario is just as important.
If Gold fails to reclaim the EMA and sellers regain control, the recent recovery could turn into another rejection.
In that case, the lower Fibonacci areas become relevant again:
0.618 → 4,268
0.786 → 4,164
And if the broader structure deteriorates further, the Fibonacci 1 level around 4,034 represents the deeper downside area shown on the chart.
Again, these aren’t predictions.
They are simply the levels that become relevant if the corresponding scenario develops.
🧠 The EMA Is the Decision Zone
This is why the current chart doesn’t need much more.
We already have the Fibonacci structure.
We already saw price react around the 0.618 area.
And now price has returned toward the 200 EMA.
Instead of trying to predict every candle, the cleaner approach is to watch how Gold behaves around this level.
Above and holding → the upper Fibonacci structure becomes more interesting.
Rejection → attention shifts back toward the lower levels.
Simple.
🔔 You Don’t Need to Watch the Chart All Day
There’s another practical side to levels like the 200 EMA.
If a specific technical level is important to your analysis, there is little reason to sit in front of the chart waiting for price to reach or cross it.
We use dedicated indicators that can generate EMA 200 alerts when relevant crossings occur, allowing the chart to come to you instead.
These tools, including our own custom indicators, are provided to our course members at no additional cost.
The purpose isn’t to replace analysis or generate automatic trading decisions.
An alert simply tells you when it’s time to look at the chart again.
That can make a structured trading process considerably more efficient.
📊 Don’t Predict the Break — Prepare for It
Gold doesn’t have to break higher.
It doesn’t have to fall toward 4,034 either.
Right now, neither outcome is confirmed.
What we do have is a clearly identifiable technical area that can help structure the next decision.
200 EMA reclaimed and held? Watch the upper Fibonacci levels.
200 EMA rejection? Watch how price behaves toward the lower structure.
You don’t need to know the outcome beforehand.
You need to know what you’re looking for when it happens.
This analysis is for educational and informational purposes only and does not constitute financial or investment advice. Fibonacci levels, moving averages and technical indicators do not guarantee future price movements. Always conduct your own analysis and manage risk accordingly.  Short
Short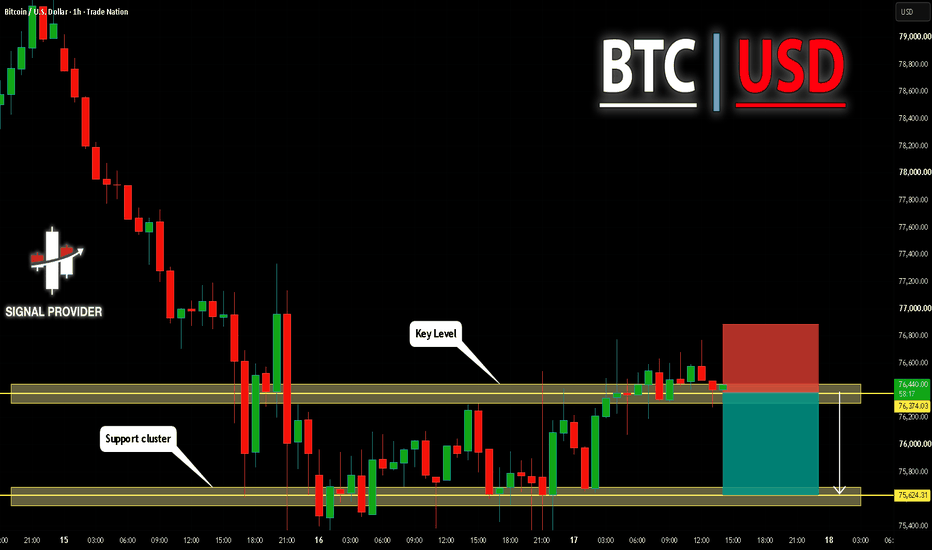
₿ BTCUSDT | BUY SETUP...₿ BTCUSDT | BUY SETUP
📍 Buy Reaction Zone: 75,000–75,500
🎯 Target 1: 77,400–77,600
🎯 Target 2: 79,500–79,700
🟢 Support Zone: 74,900–75,500
🔴 Resistance Zone: 77,700–77,900
🔴 Major Resistance: 79,500–79,700
📊 Market Analysis:
BTC is currently consolidating above the marked 75,000 support area after a strong downside move. Price is forming a short-term base, while the chart indicates a potential recovery from the support zone. A sustained hold above 75,000 followed by a reclaim of 76,600–76,800 can support a move toward the first resistance around 77,400–77,600.
If BTC breaks and holds above 77,900, the next major upside objective is the 79,500–79,700 resistance zone. A decisive breakdown below 74,900 would invalidate this bullish scenario.
🛡️ Structure Invalidation: Below 74,900
Market Bias: 🟢 Bullish recovery — confirmation above 76,600 preferred. Long 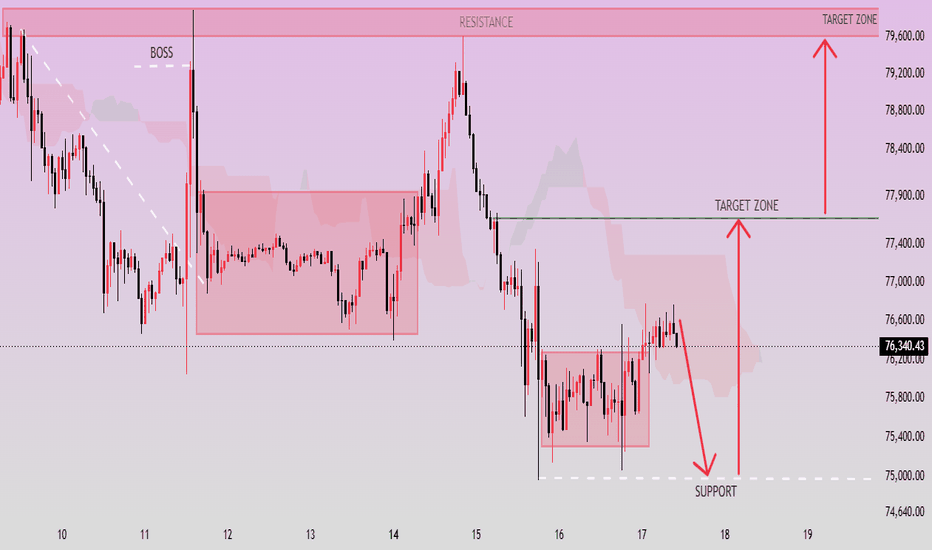
 Long
Long
Pump.fun (PUMP): Correction or the Beginning of the Next Move?The best part of a correction is not catching the exact bottom — it is knowing where the market must prove itself.
PUMP is still moving inside a descending corrective channel on the 4H chart.
Price has now reached an important support / pullback zone, which makes this area interesting for a possible long setup.
But I don't want to chase the first green candle.
There are two possible ways to approach this setup:
Setup
Scenario 1 — Buy the Pullback
Price holds the marked support zone around 0.0035–0.0037 and gives us bullish price action, rejection, or a strong confirmation candle.
→ Possible entry after confirmation
→ Invalidation: 0.0030
Scenario 2 — Buy the Channel Breakout
If price breaks the upper boundary of the descending channel with a strong candle, I would rather wait for a retest and confirmation instead of buying the initial breakout.
The breakout would provide stronger confirmation that the correction is losing control.
Targets
🎯 Short-Term Target: 0.0050
🎯 Mid-Term Target: 0.0060
The 0.006 target also lines up with the 61.8% Fibonacci level shown on the chart.
The important point is that 0.0030 remains the invalidation level. If that level is lost, the current bullish setup needs to be reassessed.
Why is Pump.fun interesting fundamentally?
Pump.fun is not simply another memecoin.
It operates a large token-launch and trading infrastructure on Solana. New tokens begin on a bonding curve, meaning price discovery happens automatically through the protocol rather than through a traditional order book. Once a token reaches the graduation threshold, its liquidity is automatically migrated to PumpSwap.
The platform also generates actual protocol revenue from trading activity.
For example, Pump.fun's current fee structure includes creator fees, protocol fees and liquidity fees, with the bonding-curve trading fee currently listed at 1.25% total.
This is one of the more interesting aspects of the project:
More launches → more trading activity → more fees → more protocol revenue.
Pump.fun passed 1 billion Dollar in cumulative revenue earlier in 2026, according to data reported by The Block.
There is also an important token-economic component.
Pump.fun announced a programmatic buyback-and-burn model using 50% of future revenue for buybacks and burns, following a large PUMP burn earlier in 2026.
That gives PUMP an economic connection to the activity of the platform that many purely speculative tokens don't have.
But this doesn't mean the token automatically goes higher.
One important warning
Pump.fun's business is heavily dependent on trading activity and speculation around new tokens.
That activity can change very quickly.
In June 2026, The Block reported that Pump.fun's activity and revenue had fallen sharply from previous highs, with average daily revenue around 800,000 Dollar versus approximately 4.8 million Dollar six months earlier.
So when looking at PUMP, I would watch more than just the chart:
Platform activity
→ Trading volume
→ Revenue
→ Buybacks/burns
→ Token supply
→ Competition
There are also newer features such as Holder Rewards and experimental AI-related mechanisms such as Mayhem Mode, showing that Pump.fun is trying to evolve from a simple memecoin launchpad into a broader token-launch ecosystem.
That's what makes PUMP interesting to watch — but also what makes it highly sensitive to changes in user activity and market sentiment.
My approach
I would not chase the current move.
The interesting area is the marked pullback/support zone.
If buyers defend it → look for confirmation.
If the descending channel breaks → wait for the retest.
If 0.0030 breaks → the bullish setup is invalidated.
The market doesn't owe us a trade. We wait for it to prove the setup.
Risk Warning: This is a technical and educational market analysis, not financial advice. PUMP is highly volatile and can experience significant losses. Always define your risk before entering a trade. ZEC VDS LONG SetupI’ve been asked a few times to take a look at ZEC and tune VDS for it, so I finally did.
I configured VDS specifically for LONG (BUY) setups on the 4H timeframe.
ZEC is currently in an uptrend, and the SELL signals are still too noisy to be useful. So for now, I’m intentionally focusing only on BUY setups.
On higher timeframes, there simply isn’t enough history yet to build a setup I’d consider reliable.
One thing I find interesting is that the signals become noticeably cleaner as more history develops. The early part of the chart contains significantly more noise, while the more recent BUY signals look much more consistent.
That said, I’m personally staying out of ZEC for now.
I’ve mentioned before that I think the asset has become heavily hyped and, in my view, looks overheated . So this setup is mostly here because several of you asked me to configure VDS for ZEC, rather than because I’m looking to trade it myself.
As more history develops and the hype settles down, we’ll have a much better dataset to evaluate.
For now: 4H, LONG only. Long 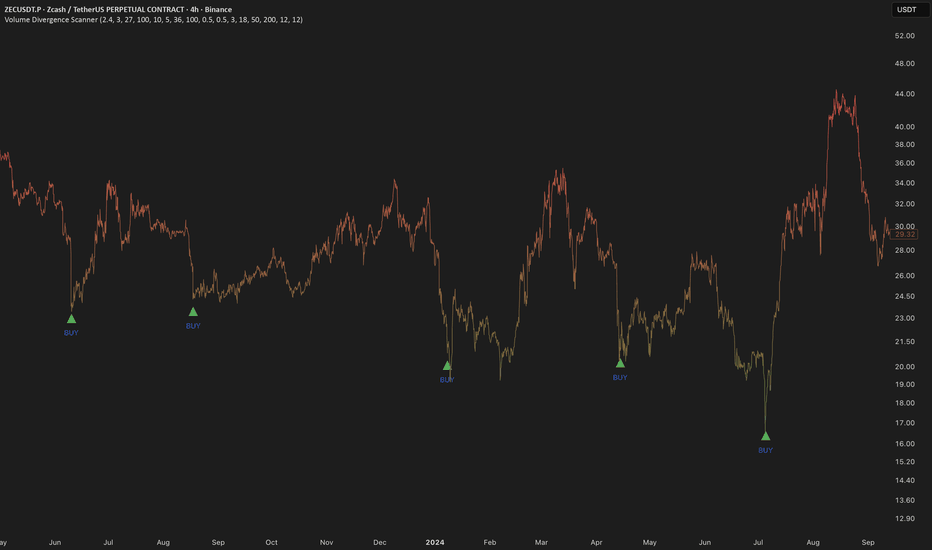
Long 
 Long
Long
 Long
Long
 Long
Long
LIT: Correction in Progress LIT: Correction in Progress — Price Action Is Quietly Preparing the Next Move
The best entries are often found during the correction, not after the move has already started.
LIT is currently going through a correction, but the price action is beginning to show some interesting signs.
The recent candles are becoming more constructive, and the way price is reacting around the current area suggests that sellers may be losing some of their short-term control.
I'm not looking for a prediction here.
I'm watching the price action and candlestick behavior to see whether buyers can gradually regain control.
Technical Setup
Market Phase: Correction
Current Bias: Watching for bullish confirmation
Key Area: Current correction / support zone
Confirmation: Bullish price action + strong candle reaction
Invalidation: Loss of the marked support structure
The important point is that I don't want to buy simply because LIT has corrected.
The correction needs to prove itself.
A strong bullish candle, rejection of lower prices, a higher low, or a clean break of the local structure would make the setup much more interesting.
If sellers continue to dominate and the current support structure fails, I would step back and wait for a new setup.
What I'm Watching
The next few candles are important.
If price continues to consolidate while selling pressure decreases, this could become the preparation phase for another move higher.
But if the market breaks the current support, the bullish scenario loses its technical strength.
Correction → Stabilization → Confirmation → Potential continuation
That's the sequence I'm looking for.
Fundamental & Economic View
LIT is transitioning from Litentry to Heima (HEI), with the project shifting its focus toward chain abstraction, cross-chain infrastructure and interoperability. The official project describes its broader vision around decentralized identity, privacy, chain abstraction, bridge infrastructure and cross-chain applications.
One of the positive aspects is that the project is trying to move beyond its original identity-focused narrative and build infrastructure that can make interaction between different blockchains easier.
However, there is an important warning here.
The tokenomics transition means the circulating supply is expected to increase over time. The project has stated that the HEI supply will move from roughly 66.45M circulating tokens toward 100M over 20 months, with the migration taking place at a 1:1 ratio.
That potential increase in circulating supply is something investors should not ignore.
There is also execution risk: the success of the Heima transition ultimately depends on whether the new chain-abstraction products attract real users, developers and liquidity.
So fundamentally, I see an interesting technological direction — but the transition itself creates additional uncertainty.
Final View
For now, I'm more interested in how LIT behaves during this correction than in predicting the next target.
If price action continues to improve and buyers confirm the structure, the setup becomes more interesting.
If support fails, we step aside.
A correction is not automatically an opportunity.
The opportunity appears when the correction starts showing signs of exhaustion.
⚠️ Risk Warning : This is educational market analysis, not financial advice. Small-cap crypto assets can experience extreme volatility and liquidity risk. Always define your invalidation and position size before entering a trade.  Long
Long
 Long
Long
BTCUSDT: Rejection at 77,400 Resistance Favors a Move To SupportHello everyone, here is my breakdown of the current BTCUSDT setup.
Market Analysis
BTCUSDT previously traded inside a range before breaking higher and shifting bullish. Price then entered a downward channel, where a recent fake breakout above the upper boundary was rejected and price moved back below the Resistance Zone.
Currently, BTCUSDT is trading below the 77,400 Resistance Zone while holding above the 74,400 Support Zone and respecting the downward channel. The recent rejection suggests sellers may attempt another move lower.
My Scenario & Strategy
As long as BTCUSDT remains below the 77,400 Resistance Zone and respects the downward channel, the bearish scenario remains valid. A continuation lower could push price toward the 74,400 Support Zone (TP1).
However, a breakout and close above 77,400 would weaken the bearish outlook and increase the possibility of further upside.
That’s the setup I’m tracking. Thank you for your attention, and always manage your risk. Short 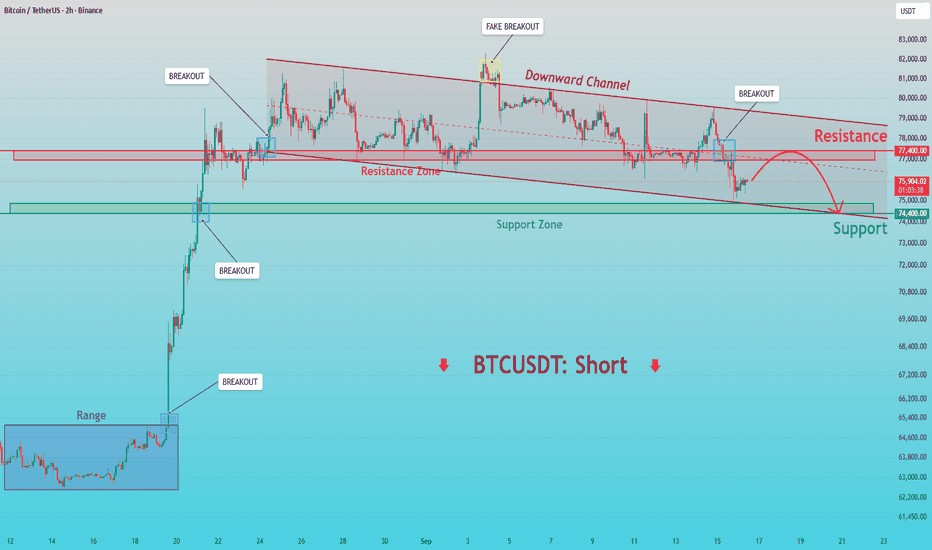
BITCOIN stable after the Fed Rate Hike. What's next?Bitcoin (BTCUSD) has remained mostly stable following the Fed's 0.25 bps rate hike yesterday, despite an initial sell-off on the stock markets. This shows incredible resilience and as we approach the designated end of the Bear Cycle (October 2026) based on the 4-year Cycle Model, the market has now sustained the pressure of two major economic events (counting also Tuesday's Clarity Act failure).
So the picture becomes clearer. According to the past three Bear Cycles since 2014, BTC is on almost an identical 1W RSI pattern of Higher Lows. Only a touch on that trend-line can deliver a price near $60k again, similar to what happened in August 2015 or a 0.5 Fib pull-back as in March 2023. As mentioned numerous times, a weekly closing above the 1W MA50 (blue trend-line), confirms the new Bull Cycle immediately.
The 1W MA200 (orange trend-line) is the technical market Support at the moment and any potential test is a buy opportunity. Especially as Bitcoin enters the 6 week period before the U.S. mid-term elections, which is expected to inflict strong volatility into the markets.
Another striking similarity on this chart is that, after every bottom, the early stages of the Bull Cycles that followed have been inside a Channel Up. In 2020/21 and 2017, those led to parabolic rallies when they broke. In 2024/25 it was much calmer and controlled, almost an extension of the Channel Up itself. So use that to your advantage and once the 1W MA50 breaks, every minor correction towards it, would be a Bull Cycle buy opportunity.
So is there enough time for one last pull-back or the 1W MA50 will break first? Feel free to let us know in the comments section below!
---
** Please LIKE 👍, FOLLOW ✅, SHARE 🙌 and COMMENT ✍ if you enjoy this idea! Also share your ideas and charts in the comments section below! This is best way to keep it relevant, support us, keep the content here free and allow the idea to reach as many people as possible. **
---
💸💸💸💸💸💸
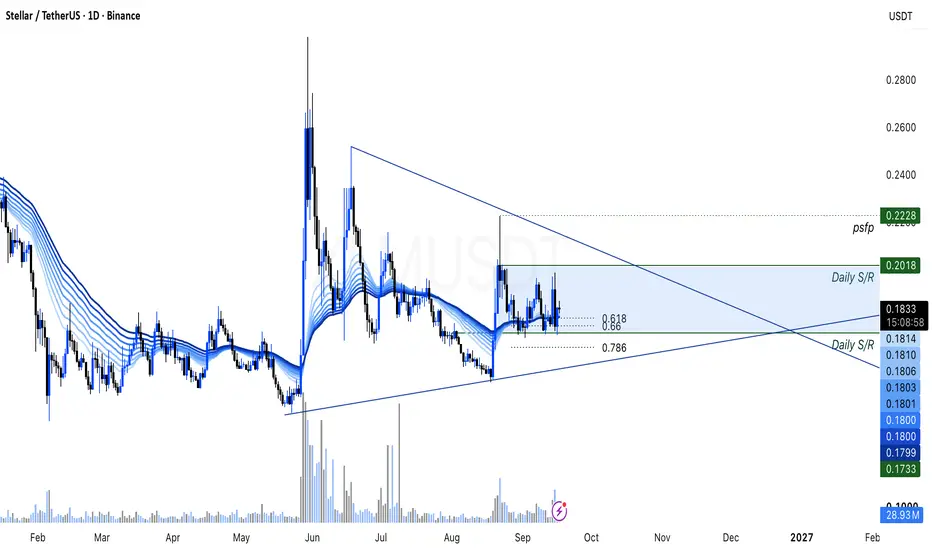
👇 👇 👇 👇 👇 👇 XLM Price Equilibrium, Breakout Incoming ?XLM price action continues to trade within a high-time-frame equilibrium, with neither buyers nor sellers establishing a clear directional breakout. While price remains inside this equilibrium, the current structure suggests that further consolidation may continue before a more decisive move develops.
A breakout from the range would require stronger confirmation, particularly through increasing volume in the direction of the move. If price breaks higher with sustained volume, it could provide greater confirmation that buyers are gaining control and attempting to continue the broader trend. Conversely, a downside break accompanied by increasing selling volume could indicate that sellers are gaining momentum and that a deeper corrective phase may develop.
At present, however, no confirmed breakout has occurred. This keeps XLM within its existing range and leaves the market vulnerable to continued back-and-forth price action around the equilibrium. Traders may therefore want to monitor both the range boundaries and volume behaviour closely.
Until price establishes a clear break supported by increasing volume, continuation of the current consolidation remains a reasonable scenario. The eventual direction should become clearer once price moves beyond the equilibrium and demonstrates sustained acceptance outside the range.
----------------------------------------------------------------------------------------------
UK residents: Don't invest unless you're prepared to lose all the money you invest. This is a high-risk investment and you should not expect to be protected if something goes wrong. Take 2 mins to learn more: coinjar.com/uk/risk-summary
The article is an opinion expressed by the author at a point in time and does not represent the views of CoinJar UK Limited or CoinJar Australia Pty Ltd. Take care to consider the date of this article and be aware that this opinion is based on circumstances at the time of publishing. No responsibility or liability is accepted for any errors of fact or omission expressed therein. Past performance is not a reliable indicator of future results.
This above article is not to be read as investment, legal or tax advice and it takes no account of particular personal or market circumstances; all readers should seek independent investment advice before investing in cryptocurrencies.
We recommend you obtain financial advice before making a decision to use your credit card to purchase cryptoassets or to invest in cryptoassets.In the UK, it's legal to buy, hold, and trade crypto, however cryptocurrency is not regulated in the UK. It's vital to understand that once your money is in the crypto ecosystem, there are no rules to protect it, unlike with regular investments.
You should not expect to be protected if something goes wrong. So, if you make any crypto-related investments, you're unlikely to have recourse to the Financial Services Compensation Scheme (FSCS) or the Financial Ombudsman Service (FOS) if something goes wrong.
----------------------------------------------------------------------------------------------
EU residents: Warning: If you invest in this product, you may lose some, or all, of the money you invest. The value of crypto-assets may rise or fall rapidly. Past performance is not indicative of future results. To learn more see our Risk Disclosures.
CoinJar Europe Limited is authorised by the Central Bank of Ireland as a crypto-asset service provider (registration number C496731)
---------------------------------------------------------------------------------------------- XRP Daily Analysis: Consolidation Below Key ResistanceXRP price action is currently consolidating below a key resistance region, keeping the market at an important technical area. As long as price remains below this resistance, the structure continues to leave room for further corrective movement, particularly if buyers struggle to generate enough momentum to reclaim the level.
A sustained rejection from resistance could increase the probability of a deeper pullback, with the next reaction depending on how price behaves around nearby support zones. Monitoring market structure during any retracement may help determine whether the move remains corrective or develops into a broader shift in direction.
Alternatively, an increase in bullish volume could change the current setup. If stronger volume enters the market and price successfully breaks and establishes acceptance above the resistance region, it would provide greater confirmation that buyers are attempting to resume the broader trend. In that scenario, continuation could become more technically plausible.
For now, the key factor is how XRP responds around resistance and whether volume supports either direction. Until price provides clearer confirmation, both continuation and further correction remain possible scenarios, rather than established outcomes.
----------------------------------------------------------------------------------------------
UK residents: Don't invest unless you're prepared to lose all the money you invest. This is a high-risk investment and you should not expect to be protected if something goes wrong. Take 2 mins to learn more: coinjar.com/uk/risk-summary
The article is an opinion expressed by the author at a point in time and does not represent the views of CoinJar UK Limited or CoinJar Australia Pty Ltd. Take care to consider the date of this article and be aware that this opinion is based on circumstances at the time of publishing. No responsibility or liability is accepted for any errors of fact or omission expressed therein. Past performance is not a reliable indicator of future results.
This above article is not to be read as investment, legal or tax advice and it takes no account of particular personal or market circumstances; all readers should seek independent investment advice before investing in cryptocurrencies.
We recommend you obtain financial advice before making a decision to use your credit card to purchase cryptoassets or to invest in cryptoassets.In the UK, it's legal to buy, hold, and trade crypto, however cryptocurrency is not regulated in the UK. It's vital to understand that once your money is in the crypto ecosystem, there are no rules to protect it, unlike with regular investments.
You should not expect to be protected if something goes wrong. So, if you make any crypto-related investments, you're unlikely to have recourse to the Financial Services Compensation Scheme (FSCS) or the Financial Ombudsman Service (FOS) if something goes wrong.
----------------------------------------------------------------------------------------------
EU residents: Warning: If you invest in this product, you may lose some, or all, of the money you invest. The value of crypto-assets may rise or fall rapidly. Past performance is not indicative of future results. To learn more see our Risk Disclosures.
CoinJar Europe Limited is authorised by the Central Bank of Ireland as a crypto-asset service provider (registration number C496731)
---------------------------------------------------------------------------------------------- BTCUSD | Bearish Rejection & Downside Potential SetupBTCUSD | Bearish Rejection & Downside Potential Setup
Fundamental View
Bitcoin is facing renewed selling pressure as markets prepare for the Federal Reserve’s September 15–16 policy decision. Expectations for a 25-basis-point rate hike have risen sharply, with markets pricing a very high probability of a hike. The increasingly hawkish policy outlook is supporting the U.S. dollar and keeping pressure on risk-sensitive assets such as Bitcoin
At the same time, the U.S. 10-year Treasury yield recently moved above 5%, reflecting tighter financial conditions and adding another macro headwind for crypto markets.
Technical View
On the 1H chart, BTCUSD has rejected the 79,000 area and broken lower from the recent recovery structure.
Price is now trading below the Supertrend and remains beneath the descending trendline. The 77,200–77,700 region is therefore an important resistance zone for the current bearish setup.
If sellers continue to defend this area and BTC breaks below the 75,500 support, the next downside liquidity zone comes into focus, with the broader bearish target around 72,000.
SMC View
From an SMC perspective, the recent rally toward the 79,000 area appears to have interacted with a double-top / buy-side liquidity zone before sellers took control.
The rejection from this premium area has created a bearish shift in short-term momentum. With sell-side liquidity resting below 75,500, a confirmed breakdown could provide the next downside expansion toward the 72,000 region.
This Move Is Supported By
• Hawkish Federal Reserve expectations
• Rising U.S. Treasury yields
• Stronger USD conditions
• Rejection from the 79,000 buy-side liquidity area
• Bearish 1H structure below the descending trendline
• Price trading below the Supertrend
• Potential sell-side liquidity below 75,500
Trading Scenario
Bearish Scenario:
If BTCUSD remains below the 77,200–77,700 resistance zone, sellers could continue targeting the 75,500 support.
A confirmed breakdown below 75,500 could expose the 72,000 area, where a larger reaction may develop.
Bullish Invalidation Scenario:
A sustained move above 77,700 would weaken the immediate bearish structure.
A decisive breakout and hold above 78,090 would invalidate this bearish setup and require a reassessment of the downside thesis.
Key Levels
Resistance: 77,200
Major Resistance: 77,700
Support: 75,500
Bearish Target: 72,000
Invalidation: 78,090
Professional Insights
The 77,200–77,700 region is the key decision zone for this setup. As long as BTC remains below this area and the descending trendline, the bearish structure remains in focus.
The most important confirmation would be a clean break below 75,500 followed by acceptance below the level. A temporary liquidity sweep should not automatically be treated as a confirmed breakdown; a sustained move or retest would provide stronger confirmation.
With the Fed decision approaching, volatility and false breakouts can increase significantly. The reaction to the Fed statement and forward guidance may be more important than the initial rate decision itself.
Risk Management
Avoid treating resistance or support as guaranteed reversal points, particularly ahead of a major central-bank event. Manage position size according to your individual risk tolerance and wait for price-action confirmation before acting on the setup.
The 78,090 level remains the key invalidation for this bearish thesis.
Disclaimer
This analysis is for educational purposes only and does not constitute financial advice. Market conditions can change rapidly, especially around major Federal Reserve events. Always conduct your own research and apply appropriate risk management. Short 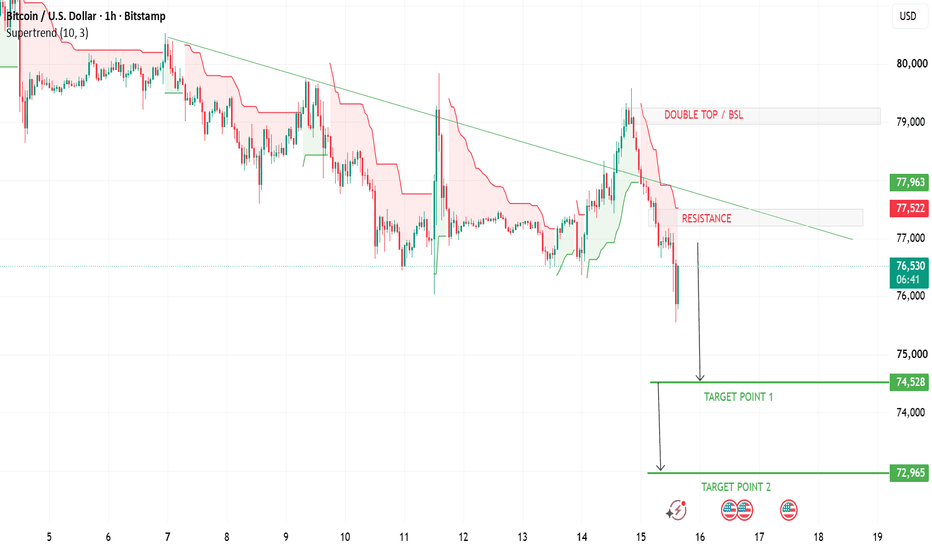
Long 
A Retest Is Only as Good as What Happens Next
A retest is often considered successful the moment price touches a previous breakout level and bounces. That can be misleading because the first reaction tells you that buyers responded, but not whether they were strong enough to regain control.
The better question is what price accomplishes after the bounce.
Suppose CRYPTOCAP:BTC breaks resistance at $80,000, reaches $82,000 and later returns to $80,000. Buyers step in and price rebounds to $81,200. At first glance, the retest worked.
But then CRYPTOCAP:BTC returns to $80,000 only a few hours later.
Buyers respond again, except this time the recovery reaches only $80,700 before losing momentum. On the third test, price barely reaches $80,300 before returning to the level.
The level has technically produced three bullish reactions, yet the behavior is becoming weaker rather than stronger.
This is where failed retests become useful. Instead of counting how many times a level holds, compare what each defense actually achieves. A healthy defense should create separation, reclaim nearby structure and force traders who entered against the breakout to reconsider their positions.
If every bounce travels a shorter distance, lasts less time and returns to the level faster, buyers are spending effort without gaining much territory.
Repeated tests also change the situation. The first return to a breakout area may meet substantial demand, but if price keeps coming back, some of those orders are being filled each time. Unless new buyers continue appearing, the level can become increasingly vulnerable even though it has technically “held” several times.
There is an important difference between a level being defended and a level being under constant pressure.
A strong retest might touch $80,000 once, recover quickly and establish trading comfortably above $81,000. A weak retest might bounce from $80,000 three times while never escaping the immediate area. The second chart contains more successful reactions, but potentially less actual strength.
This gives traders several things to compare after a retest: how far price moves away, how long it stays away, whether the recovery can break nearby structure, and whether each subsequent defense becomes stronger or weaker.
The eventual break of the level should not always be the first evidence that the retest failed.
Often, the deterioration is visible beforehand.
A bounce shows that buyers were present. What they accomplish after the bounce tells you whether their presence actually mattered.