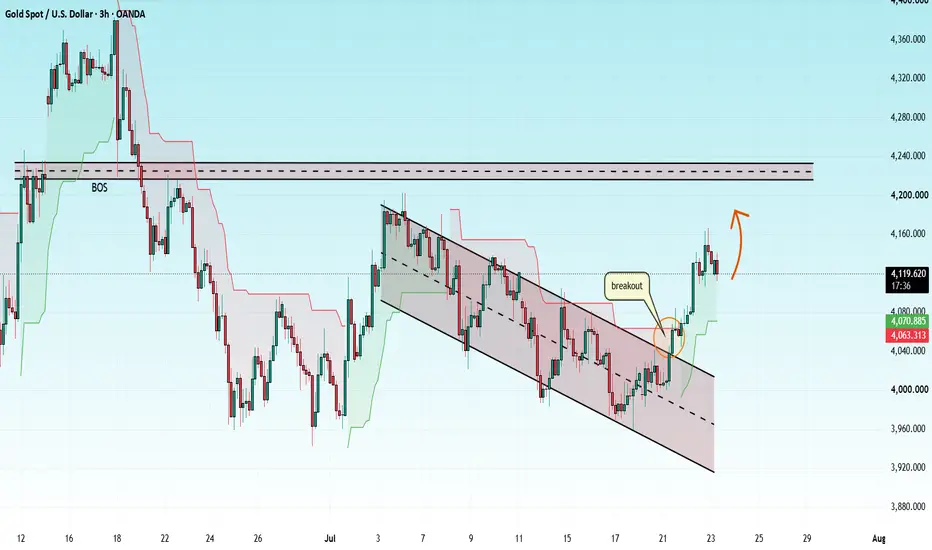
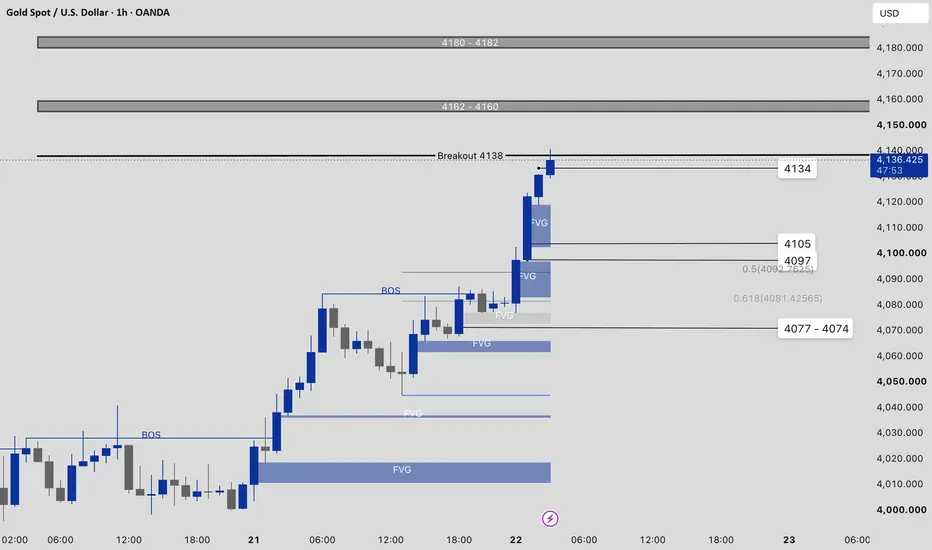
Consolidation at high levels. Buy at support levels.On Wednesday, following a strong rally, gold entered a period of consolidation at elevated levels; during early Asian trading, the price rebounded after approaching the 20-period moving average on the 2-hour chart, maintaining a bullish-leaning, range-bound trend.
Currently, the price is trading above short- and medium-term moving averages that are fanning out upwards, indicating that the bulls remain in control. However, the MACD has shown signs of turning downwards at a high level, indicating a slowdown in short-term momentum. Attention should be paid to the risk of a correction after the surge.
The area around 4100 has now transformed from previous resistance into significant support. As long as the price holds above this level, the overall rebound is likely to continue. The key resistance levels to watch are the previous highs of 4180 and 4202. If these levels can be effectively broken and stabilized, the market may further challenge the 4278 area.
However, caution is warranted: if the price falls below 4100, short-term profit-taking could ensue, and attention should shift to the support zone around 4080–4075.
Short-term trading strategy: Focus primarily on buying the dips. Look to enter long positions near the 4100 support level, or alternatively at 4080–4075, with a target of 4200.  Long
Long
Escalating tensions support oil prices furtherUSOIL remains supported amid escalating geopolitical tensions in the Middle East. New strikes in the Red Sea exert pressure on global supply chains and embed a geopolitical risk premium into shipping costs. Concurrently, these attacks serve to bolster Tehran's negotiating leverage, while Washington maintains pressure on Iran by targeting key infrastructure.
These developments signal that prolonged friction may persist and keep the Strait of Hormuz closed, driving oil supply deficits. Meanwhile, the US Strategic Petroleum Reserve (SPR) has dropped to its lowest level since 1983—hovering just above 250 mln barrels—leaving operational capacity stretched. This presents a structural risk to US crude supply and may further bolster prices if the SPR continues to shrink.
Consequently, the US may find incentive to de-escalate tensions, which might cap oil's upside. Nevertheless, prices may continue to strengthen pending any clear signs of diplomatic easing.
Technically, USOIL maintains a strong rally above expanding EMAs, signaling sustained bullish momentum. A breach above the nearest resistance at 85.64 may drive prices toward the next resistance target at 90.90. Conversely, a drop below 85.64 may trigger a pullback toward support at 83.00.
By Van Ha Trinh - Financial Market Strategist at Exness XAUUSD Bulls Hold the BreakoutGold price has been pushing higher.
After breaking above the descending trendline, momentum accelerated and carried price toward 4,160.
Now, price is pulling back into the first support zone around 4,105–4,120.
This pullback isn’t weakness, it’s a retest.
Sellers are trying to push price lower, but buyers are still defending the breakout structure.
As long as this support holds, bullish momentum can return. A deeper correction toward 4,070–4,085 would remain another important demand area.
I am anticipating the next impulsive leg higher toward the 4,200 target. Long 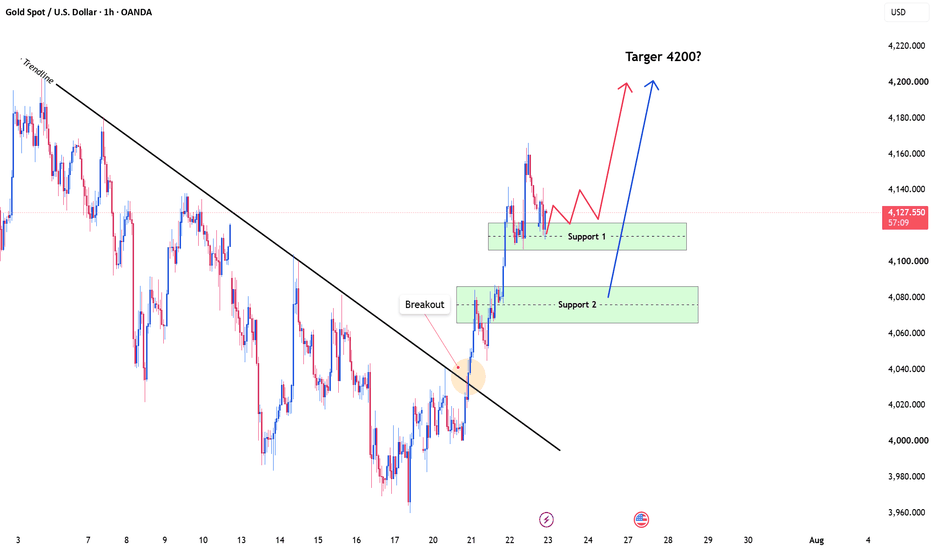
 Long
Long
Long 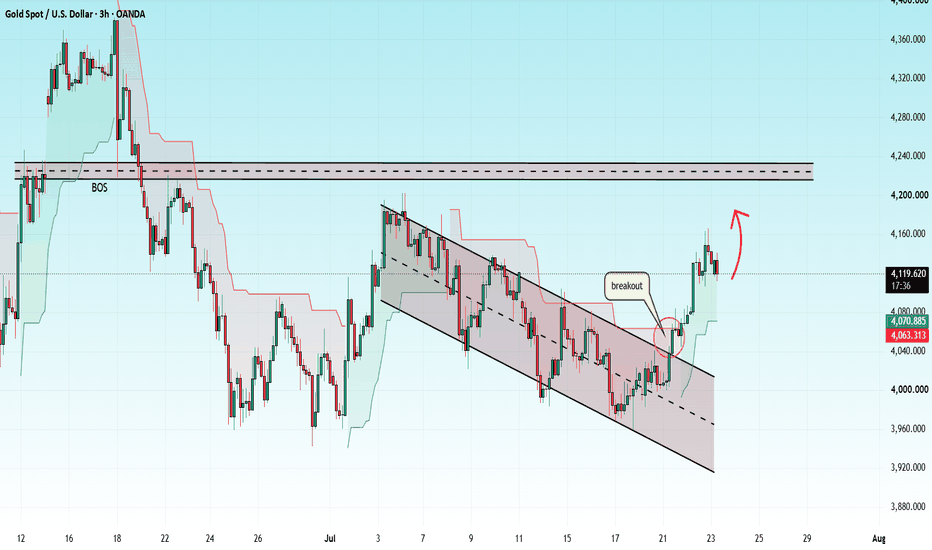
Short 
## GOLD (XAU/USD) – 30-Minute Chart Analysis ## GOLD (XAU/USD) – 30-Minute Chart Analysis (Medium & Short-Term Swing)
1. Gold is currently trading inside a **crucial demand-supply zone around 4,090–4,100**, making this the most important decision area for both short-term and medium-term direction.
2. The recent uptrend remains intact as long as this **crucial support zone** holds. The sequence of **higher highs and higher lows** still favors buyers in the medium term.
3. **Short-Term Bullish Scenario:** If buyers successfully defend **4,090–4,100**, Gold is likely to resume its upward swing towards **4,160**, followed by **4,220**, with a medium-term target around **4,290–4,300**.
4. A bullish confirmation would be a **strong bullish candle accompanied by higher volume** from the support zone, indicating fresh buying interest.
5. **Short-Term Bearish Scenario:** If Gold closes decisively below **4,090**, the current bullish swing structure will weaken, and profit booking could accelerate.
6. In the bearish case, the first downside target is expected around **4,040**, followed by **4,000**, where buyers may attempt to stabilize the market.
7. The chart indicates that the current pullback appears to be a **retest of the breakout zone**, which is a common continuation pattern in a healthy uptrend. Therefore, the reaction at this level is more important than the pullback itself.
8. From a **medium-term perspective**, the probability still favors the bulls as long as the price continues to hold above the crucial support zone. A successful retest would establish another **Higher Low (HL)** and strengthen the overall uptrend.
9. Traders should avoid taking aggressive directional positions **inside the crucial zone**. It is better to wait for confirmation—a bullish bounce for long positions or a decisive breakdown for short positions.
10. **Overall Outlook: Neutral to Moderately Bearish (6.5/10)** while Gold breaks crucial zone comfortably:
11. **Overall Outlook: Neutral to Moderately Bullish (3.5/10)** while Gold remains above **4,090–4,100**. Expected paths:
* **Bullish:** **4,110 → 4,160 → 4,220 → 4,290**
* **Bearish:** **4,090 Breakdown → 4,040 → 4,000 → 3,990**
---
### Key Trading Levels
* **Crucial Support Zone:** **4,090–4,100**
* **Immediate Resistance:** **4,160**
* **Major Resistance:** **4,220**
* **Medium-Term Target:** **4,290–4,300**
* **Bearish Confirmation:** **Close below 4,090**
* **Bullish Confirmation:** **Strong bounce and close above 4,140 after defending the support zone**
---
### Disclaimer
> **Disclaimer:** This analysis is based on technical indicators, swing structure, price action, support and resistance zones, and the current market structure. It is intended **solely for educational and informational purposes** and **should not be considered financial or investment advice**. Financial markets are inherently volatile, and no technical analysis can guarantee future price movements. Please conduct your own research and consult a qualified financial advisor before making any investment or trading decisions.
Long 
Long 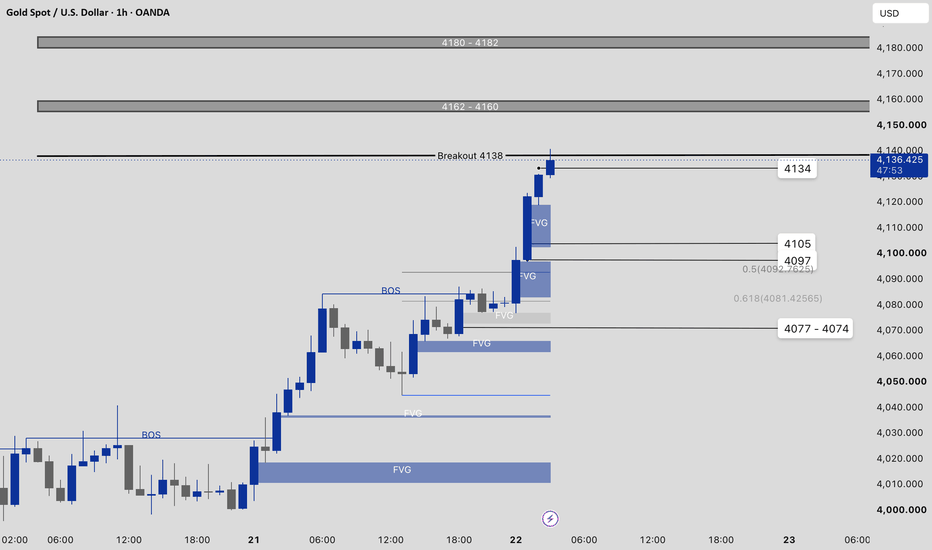
Long 
Long 
July 23, 2026 - XAUUSD Analysis and Potential Opportunity📊 Summary:
Bullish momentum remains strong, and the preferred strategy is to buy pullbacks where support holds. That said, after rallying roughly 160 points over the past two days, the market also carries a higher risk of a short-term pullback.
Today, keep a close eye on the 4107 support level. If price breaks below 4107, the preferred strategy shifts to selling pullbacks where resistance holds. A further break below 4100 would strengthen bearish momentum. If 4107 continues to hold, it remains an attractive area to look for long opportunities.
In short, above 4107, the preferred strategy is to buy pullbacks where support holds. Below 4107, the preferred strategy shifts to selling pullbacks where resistance holds.
🔍 Key Levels to Watch:
• 4166 – Resistance
• 4144 – Resistance
• 4138 – Resistance
• 4130 – Resistance
• 4113 – Support
• 4107 – Key Support
• 4100 – Support
• 4090 – Support
📈 Intraday Strategy:
SELL: If price breaks below 4107 → target 4104, with further downside toward 4100, 4097, 4090
BUY: If price holds above 4130 → target 4134, with further upside toward 4138, 4141, 4144
If you find this helpful or traded using this plan, a like would mean a lot and keep me motivated. Thanks for the support!
 Long
Long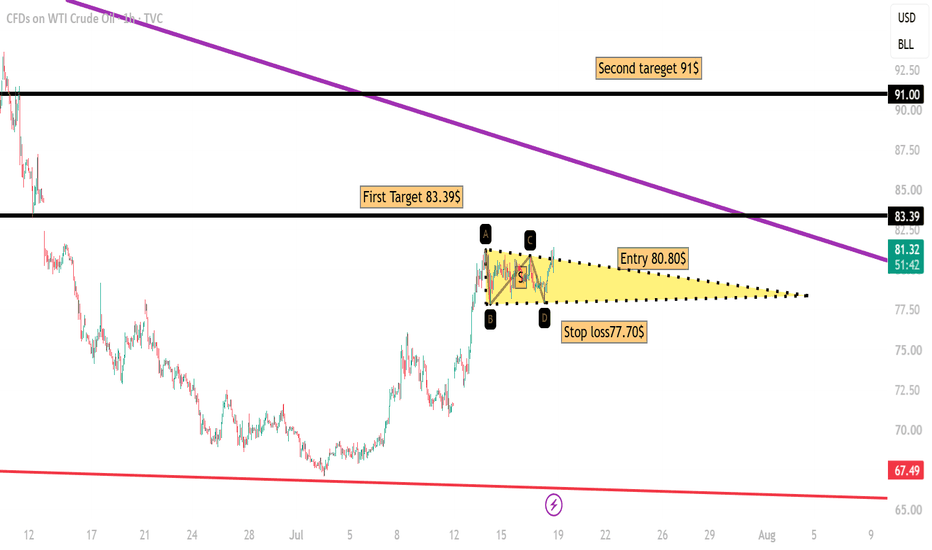
Long 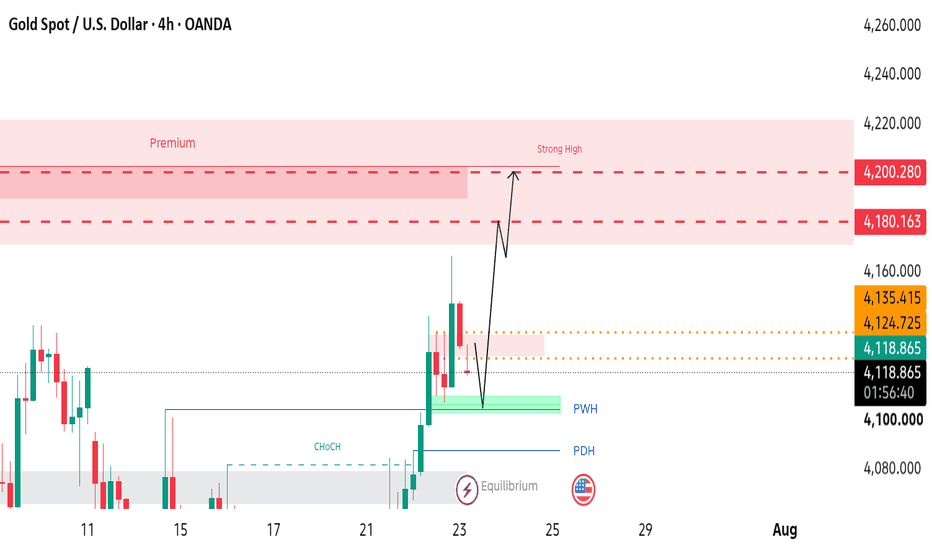
 Education
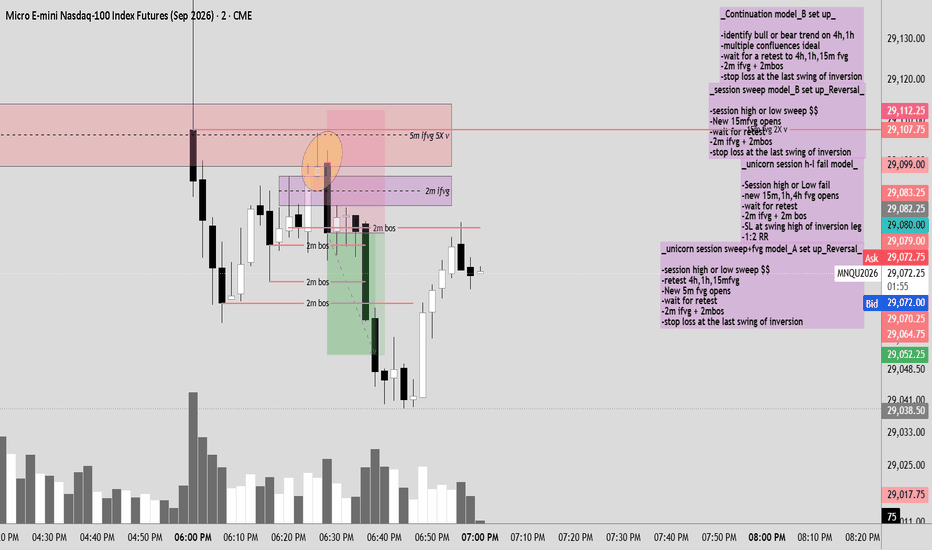
Gold (MGC) | Is This the High of the Week?After three strong days of bullish momentum, Gold is starting to show signs that buyers may be losing steam. I'm not ready to call the top just yet, but we're reaching an area where I want to see how price reacts before making my next move.
One thing that immediately caught my attention was the large gap down at today's session open. Rather than chasing price lower, I'd actually like to see the market retrace and attempt to fill that gap. The reaction there should tell us a lot about who is in control heading into the Asian Kill Zone.
📈 Bullish Scenario
If buyers reclaim the gap, break above yesterday's high, and can hold those gains, then the uptrend remains intact and I'll continue respecting the bullish momentum.
📉 Bearish Scenario
If price fills the gap but fails to reclaim value, followed by a break and acceptance below 4116, I'll view that as confirmation that sellers are beginning to take control. That would align with the larger bearish structure I'm seeing on the higher timeframes.
I'm trying not to let my higher timeframe bias force trades. Yes, the Daily chart still favors the bears overall, but the intraday trend has been making higher highs and higher lows all week. Until that structure breaks, patience is key.
For me, this session isn't about predicting the next move—it's about letting the market confirm which side is winning the auction.
Key Levels I'm Watching
🔹 Yesterday's High – Bullish continuation if reclaimed and accepted above.
🔹 4116 – Bearish confirmation if price breaks below and accepts underneath.
🔹 Session Gap – The reaction here could determine the direction for the remainder of the week.
As always, I'm letting price come to me rather than chasing moves. The best trades usually come after confirmation, not anticipation.
What's your bias heading into Thursday? Are you expecting continuation higher, or do you think this rally is running out of steam?
#Gold #MGC #Futures #PriceAction #OrderFlow #TradingView #COMEX #MarketStructure #ICT #SmartMoney #DayTrading #NOFOMOTrading Short

 Long
Long
NeuPortal | Gold 24h - neutral band, a pullback within rangeMeasured, not assumed. The band is the interquartile range of how gold has actually moved over this window, read from 3,001 overlapping windows of the chart's own history.
Median 4,142
Core 50% 4,081 - 4,209 (3.1% of spot)
Wide 80% 3,999 - 4,262 (6.4%)
NO DIRECTIONAL LEAN. The trend gate is open (ADX 35), so the market is trending by that measure - but the net momentum signals cancel out, so the median sits near spot. Strong trend, no clean direction. This is a statement about how far, not which way.
WHERE THIS BAND FAILS - AND WE SAY SO
Out-of-sample, fitted on older history and tested on newer: core coverage 27% against a 50% target, wide 55% against 80%. Both well below target, which means on gold at this horizon the band runs TOO NARROW - price left it more often than it should. That is a real weakness, printed on the chart, not hidden. A tool that only ever looks good is a tool that isn't being scored.
Why: skew -0.67 and excess kurtosis 3.00. Gold's fat tails and left skew are exactly what a narrow empirical band underestimates, and the coverage numbers catch it.
125 independent windows, not 3,001 - overlapping windows share most of their bars, and the smaller number is the honest sample size.
The drawn path is an illustration of how price might travel, not a claim about the route. What is described is where it lands, and that is the band.
Educational content - not financial advice. Short 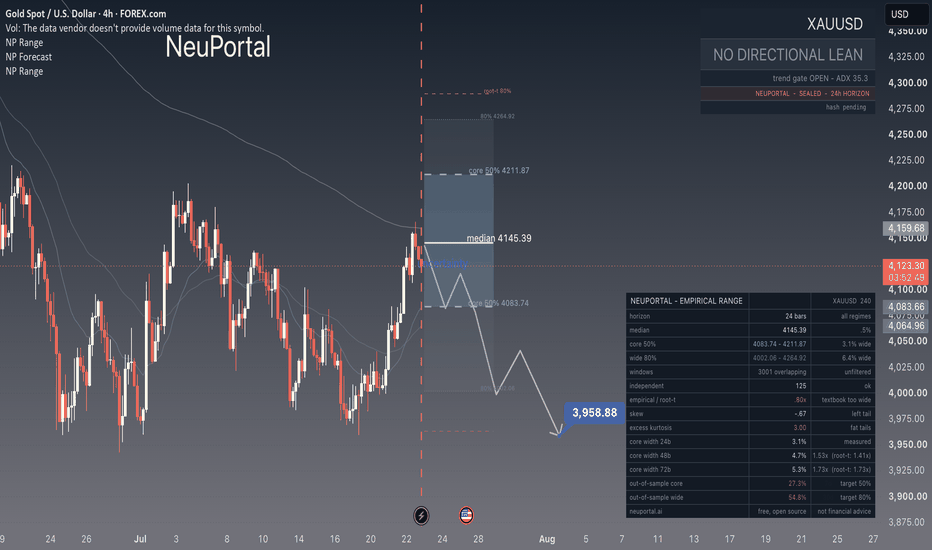
Crude Oil MCX Fut Intraday Technical Analysis 23 July, 26MCX:CRUDEOIL1!
Crude Oil Futures (MCX) | Intraday Structure | July 23, 2026
Crude Oil is trading around 8,412, hovering directly above the 8,410 Zero Line. The contract has experienced a volatile corrective phase following its sharp rally toward the 8,570 peak, now compressing inside its central value block as market participants seek a clear directional catalyst.
Price enters the session locked tight around its primary benchmark. Buyers are defending the immediate support cluster to maintain structural continuity toward higher expansion targets, while bears are attempting to push price below the Zero Line to unlock deeper liquidation legs. Wait for a high-volume 15-minute candle breakout before committing capital.
Bullish Triggers
Long Entry: Above 8,441 (strongly validated while price holds structural footing above the 8,400 Add Long Pos. band).
Targets: 8,629 - 8,765
Risk Control: Structure weakens below 8,400. Hard exit below 8,323.
Bearish Triggers
Short Entry: Below 8,358 (validated if liquidity pushes fail to hold the 8,410 Zero Line, converting it into a firm distribution ceiling).
Targets: 8,191 - 8,055
Risk Control: Cover immediately above 8,476. Day Bias remains structurally protected above 8,222.
No-Trade Chop Zone: 8,323 - 8,441
Expect rotational, choppy price action inside this decision block as commercial participants balance risk. Avoid over-trading early whipsaws inside this zone; let a clean 15-minute structural candle breakout provide true execution validation.
Execution Rule: Structure first, confirmation next. Zero anticipation.
Hit Boost and drop your view in the comments if you're tracking these levels today.
#CrudeOil Gold MCX Fut Intraday Technical Analysis - 23 July, 26MCX:GOLD1!
Gold Futures (MCX) | Intraday Structure | July 23, 2026
Gold is trading around 145,693, hovering just above the 145,680 Zero Line. The contract has completed a strong vertical breakout from its base near 144,500, pushing into a higher value range before entering a localized pullback and consolidation block right at its central pivot.
Price action enters the session positioned near the zero benchmark. Buyers are attempting to maintain structural acceptance above this level to fuel the next upward extension, while sellers look for a breakdown below the line to trigger a deeper pull back. Wait for a high-volume 15-minute candle to break cleanly away from this cluster before committing capital.
Bullish Triggers
Long Entry: Above 145,355 (strongly validated while price holds structural footing above the 145,156 Add Long Pos. band).
Targets: 146,724 - 147,369
Risk Control: Structure weakens below 145,156. Hard exit below 144,792.
Bearish Triggers
Short Entry: Below 144,956 (validated if price breaks back down below the 145,680 Zero Line and converts it into a rigid distribution ceiling).
Targets: 144,636 - 143,991
Risk Control: Cover immediately above 145,519. Weekly Bias remains structurally protected above 144,299.
No-Trade Chop Zone: 144,792 - 145,355
Expect rotational, choppy price action within this decision range as commercial participants balance risk. Avoid chasing early morning whipsaws inside this block; let a clean 15-minute structural candle breakout provide execution confirmation.
Execution Rule: Structure first, confirmation next. Zero anticipation.
Hit Boost and drop your view in the comments if you're tracking these levels today.
#Gold