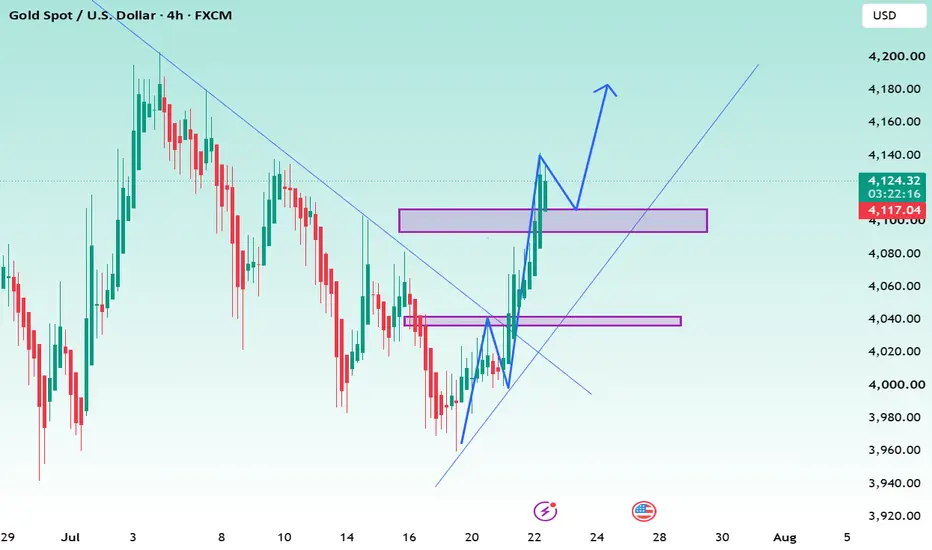
XAUUSD: Patience Pays — Waiting for a Discount on this Bull RallLooking at the higher timeframes on Gold, we've finally broken out of that nasty downtrend and shifted structure strictly to the upside. The momentum on this recent leg has been explosive, but that’s exactly why I’m sitting on my hands right now.
Price is overextended and consolidating at the highs. Buying XAUUSD here at current market prices is basically just giving into FOMO, and the risk-to-reward just isn't there.
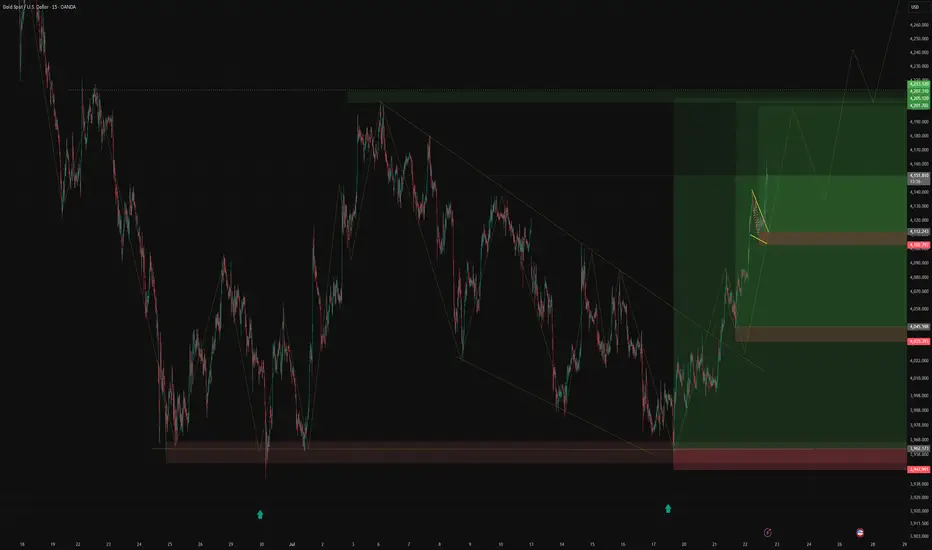
If you drop down to the 1H and 15m charts, you can see price left behind a massive imbalance (FVG) and a clean, untested order block during that crazy run-up. I want to see a mean-reversion pullback to fill that void before I get involved.
I'm setting my alerts for the 4090 - 4100 zone. That’s our premium discount area where buyers should step back in.
The Gameplan:
Entry Zone: 4090 - 4100.
Confirmation: I will not be using a blind limit order. Once price taps our zone, I'm dropping to the lower timeframes (1m/3m/5m) to wait for confirmation. Ideally, I want to see an SMT divergence form (keeping a close eye on Silver or DXY) alongside a bullish shift in market structure before pulling the trigger.
Invalidation (SL): Below 4065. If we break and hold below this, the bullish narrative for this leg is busted and we likely see a deeper drop.
Targets: Taking partials at the recent local high around 4140, and leaving a runner for the major 4H liquidity draw up at 4180+.
Stay patient and let Gold come to your zone. If it just takes off to 4180 from here without a pullback, we simply miss the trade and move on. Capital preservation first.
 Long
Long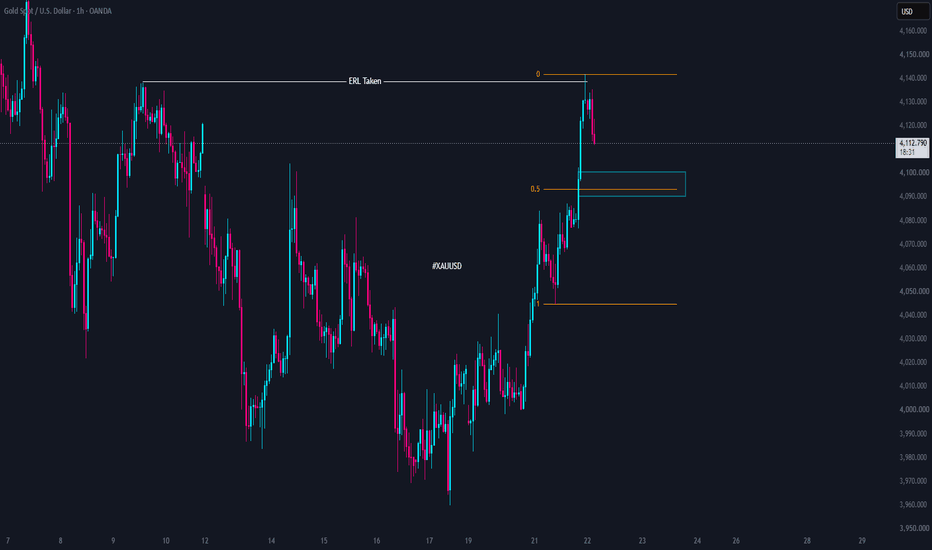
Long 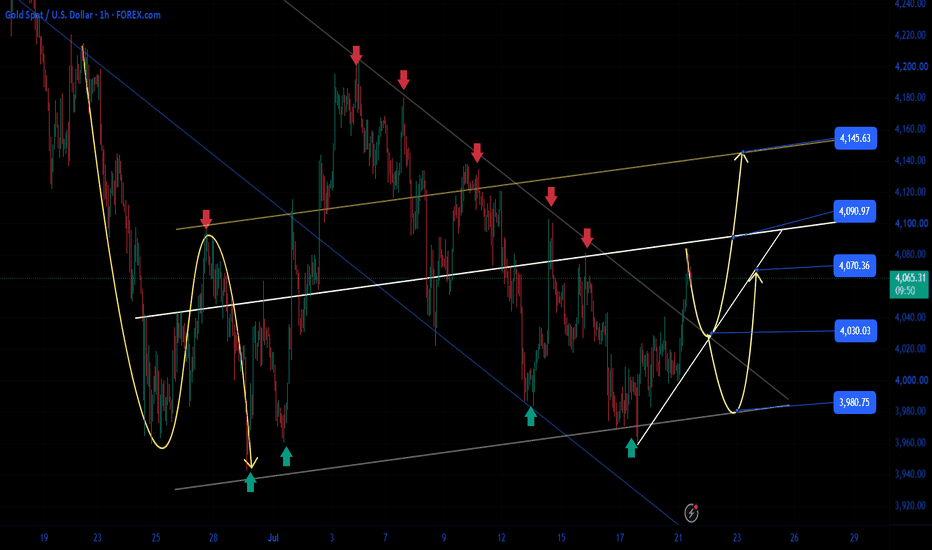
Gold Analysis | July 21
📈 Gold Analysis | July 21
Gold Rebounds Above $4070 — Can Bulls Continue the Recovery?
During Tuesday’s Asian and European sessions, gold opened slightly lower but quickly turned higher and moved upward strongly.
As mentioned in our previous analysis, when gold fails to fall despite bearish pressure, it often signals that a rebound may be forming.
The latest move was mainly driven by a shift in market sentiment after signs of improvement in the US-Iran situation. Asian stock markets rebounded strongly, risk appetite recovered, and gold received short-term buying support.
Currently, spot gold is trading around:
📍 4060-4070 area
📈 Up approximately 1.6%
📌 Fundamental Analysis
The current gold market is being driven by two competing forces:
1️⃣ Risk Sentiment Recovery
The market has started pricing in a lower probability of a major US-Iran escalation.
Previously, concerns about:
A wider military conflict
Strait of Hormuz disruption
Global supply chain risks
pushed investors into defensive positions.
However, as extreme geopolitical fears eased, funds began returning to risk assets, supporting Asian equities and weakening traditional safe-haven demand.
2️⃣ Inflation & Fed Policy Remain Key Risks
Although gold rallied today, oil prices did not fall significantly.
This means the core inflation pressure has not disappeared.
Higher oil prices could continue to:
➡️ Increase inflation expectations
➡️ Delay Fed rate-cut expectations
➡️ Support higher real yields
➡️ Limit gold upside
The current market theme is:
Risk appetite recovery + Inflation concerns
rather than:
Systemic crisis + Safe-haven demand
Therefore, gold’s rebound still needs further confirmation.
Key factors to watch:
🔥 US-Iran developments
🔥 Energy supply situation
🔥 Fed policy expectations
📊 Technical Analysis
Daily Chart
Gold has formed a strong bullish candle and is now testing the daily middle Bollinger Band.
The key question:
Can gold break and close above this resistance?
If gold can:
✅ Break above the middle band
✅ Close strongly with consecutive bullish candles
Then upside targets could extend toward:
🎯 4200
🎯 4350
However, if price only temporarily breaks above the middle band and fails to hold:
Gold may continue sideways consolidation and retest:
🟢 4000
🟢 3960 support zone
The important bullish defense area remains:
📍 3940-3960
As long as this zone holds, buyers still have opportunities.
⏱ Short-Term Technical View
From the hourly chart:
Gold formed a strong bullish reversal pattern after holding above 4000.
The rebound momentum was stronger than expected, with price breaking above the short-term middle band.
However, after reaching around 4085, gold faced resistance and pulled back.
Current trading range:
🔴 Resistance:
4085-4100
🟢 Support:
4030-4040
Additional support levels:
4051
4041
4031
Avoid chasing highs after a strong rally. A pullback confirmation would provide better risk-reward opportunities.
📌 Gold Trading Strategy | July 21
🔻 Short Strategy (Sell on Resistance)
Entry:
📍 4085-4095
Stop Loss:
❌ 4110
Targets:
🎯 4070
🎯 4060
Break below → 4050
🔺 Long Strategy (Buy the Pullback)
Entry:
📍 4040-4050
Stop Loss:
❌ 4020
Targets:
🎯 4070
🎯 4080
Break above → 4100
💡 Trading Outlook
Gold has entered a short-term rebound phase, but the market still needs confirmation.
Key levels today:
🔥 4100 → bullish breakout confirmation
🟢 4030-4040 → important support zone
Do not chase strong candles.
Wait for pullbacks, manage risk, and follow the market structure.
📈 Patience creates opportunities.
🤝 Share your gold trading ideas below, and let’s follow the market together! 🚀 Long 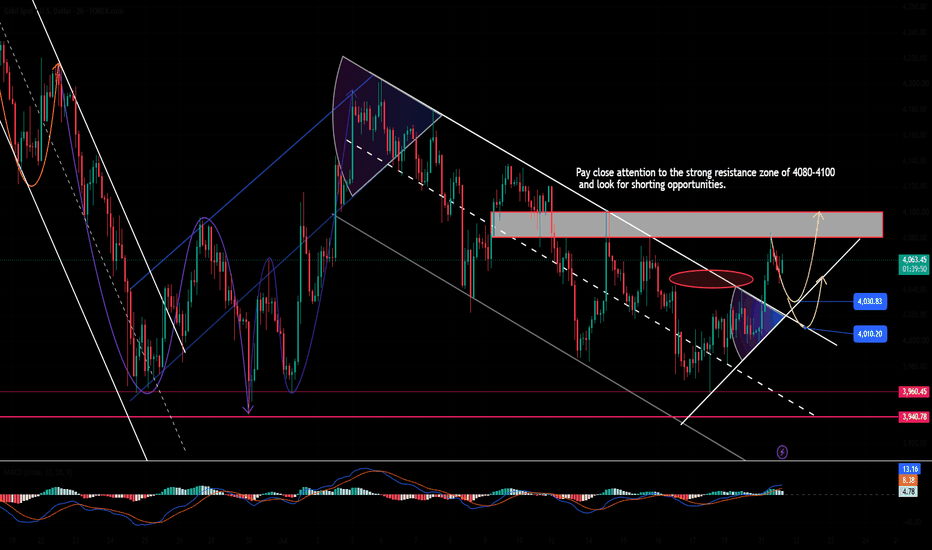
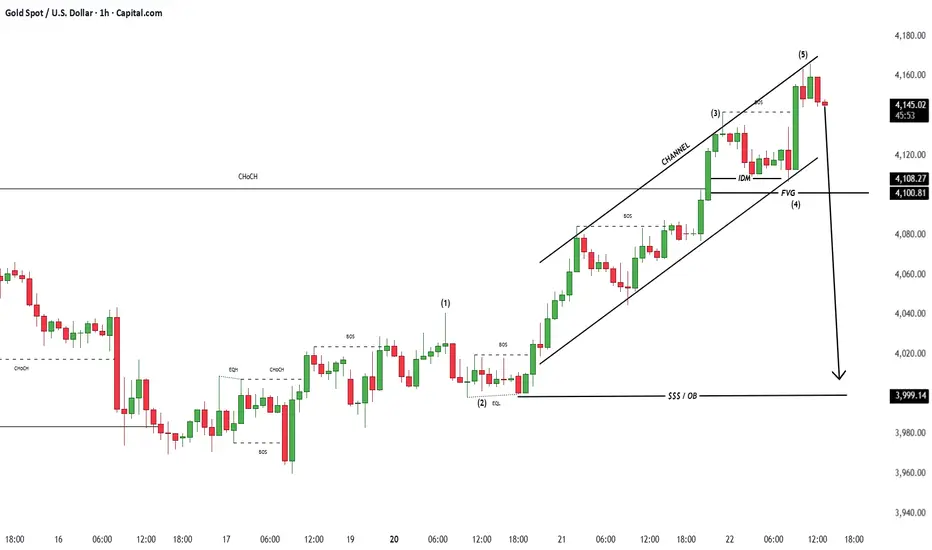
Gold Trading Strategy UpdateGold has surged for three consecutive days, shifting from a downtrend to a bullish one. As seen on the one-hour chart, gold is currently in a clear upward channel. Our consecutive long positions in gold over the past few days have yielded considerable profits.
I have repeatedly emphasized that short-term trading must follow the trend. In a strong uptrend, the strategy is to go long on gold. In a weak downtrend, we must follow the trend and go short on gold. Clearly, gold has now shifted to a bullish trend, so we can easily profit by simply going long again when gold retraces.
Today, during the European session, our precise analysis identified support for gold in the 4100-4110 area. We went long in this area and achieved substantial profits. After the US session opened, gold retraced from around 4130, and we again went long in the 4110-4120 area. These two long signals resulted in significant profits. If you also need such precise signals, please feel free to contact me.
Next, we can see that gold rebounded again to around the recent high of 4160. A slight pullback followed, and the bullish momentum has now been fully released. I believe gold is currently in a consolidation phase, and this situation may continue in the short term. We can continue to monitor the support area of 4140-4145. This area is the previous high and also the current support/resistance zone. Our focus should be on the opening of the next trading day. Gold will likely retest the resistance area of 4200 at the opening of the next trading day.
Therefore, we can now preemptively place long orders to speculate on a significant rise in the next trading day. Pay close attention to trading opportunities in the 4140-4150 area. Long 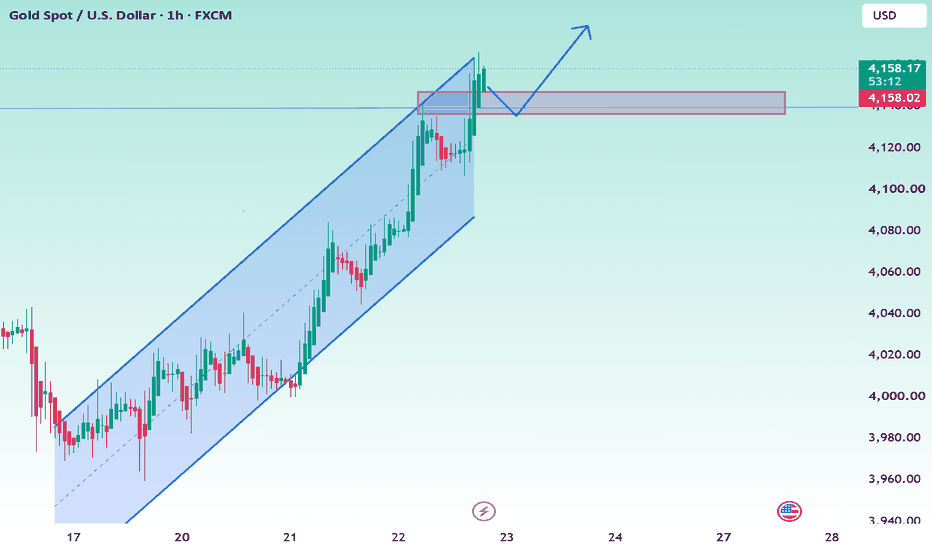
Long 
Long 
 Short
Short
Long 
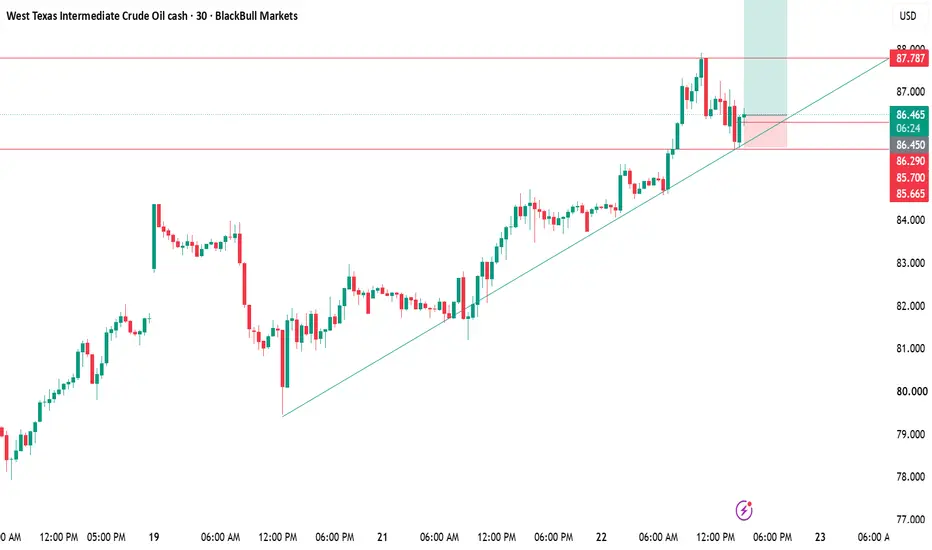
## WTI CRUDE OIL (USOIL) – 1-Hour Chart Analysis## WTI CRUDE OIL (USOIL) – 1-Hour Chart Analysis
1. Crude Oil has transitioned into a **bullish market structure**, consistently forming **higher highs and higher lows**, indicating buyers are firmly in control.
2. The chart shows multiple successful **breakout and retest patterns**, where previous resistance levels have turned into strong support, confirming trend continuation.
3. The latest breakout above the **$85.50–$86.00** resistance zone establishes a fresh **Higher High (HH)**, strengthening the bullish outlook.
4. As long as Crude Oil holds above the **$85.50 support zone**, the current uptrend is expected to remain intact with buyers maintaining momentum.
5. The recent pullback appears to be a healthy **retest of the breakout level**, which often provides a base for the next impulsive upward move.
6. If the support around **$85.50** holds, Crude Oil could resume its rally toward the **$88–$90** zone in the near term.
7. A sustained breakout above **$88** would likely trigger another impulsive leg higher, with medium-term upside targets around **$95** and **$99**, as projected on the chart.
8. The bullish structure would weaken only if price closes decisively below **$85.50**, which could result in a deeper correction toward the previous support near **$78–$79**.
9. Traders should closely monitor the **$85.50 breakout-retest zone**, as bullish price action from this level would provide confirmation for the continuation of the uptrend.
10. **Overall Outlook: Bullish (9/10)** with the expected path: **$85.70 → $88 → $90 → $95 → $99**, while **$85.50** remains the key support and invalidation level.
---
### Disclaimer
> **Disclaimer:** This analysis is based on technical indicators, price action, market structure, breakout-retest patterns, support and resistance levels, and the current chart setup. It is intended **solely for educational and informational purposes** and **should not be considered financial or investment advice**. Financial markets are inherently volatile, and no technical analysis can guarantee future price movements. Please conduct your own research and consult a qualified financial advisor before making any investment or trading decisions.
 Long
Long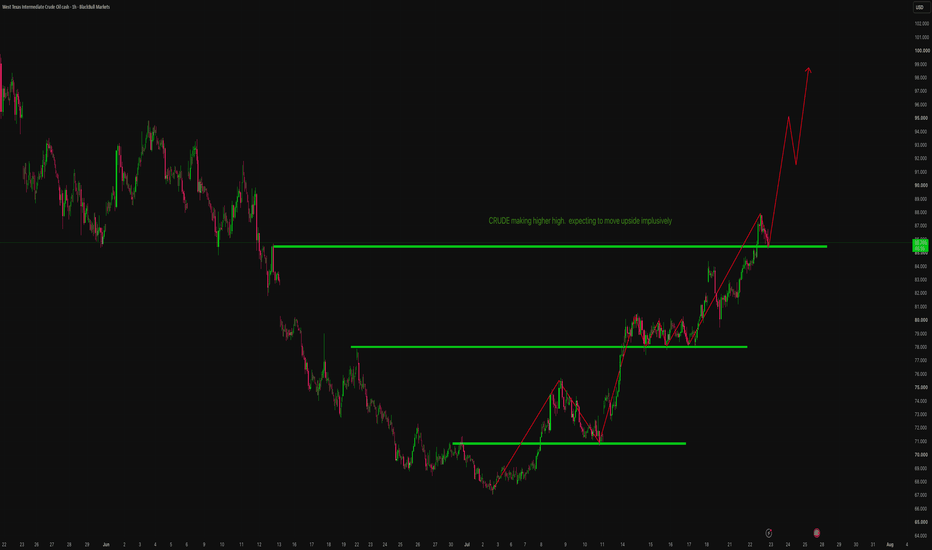
Oil, the Yen, and #NQ100: Three Signals of Rising VolatilityFinancial markets have received several fresh catalysts for increased volatility. #Brent crude has climbed close to multi-week highs, the Japanese yen has weakened to levels not seen in decades, and the U.S. technology sector is preparing for earnings releases from its largest companies.
Although these markets are driven by different factors, they share one common theme: shifting expectations for inflation, interest rates, and demand for risk assets.
#Brent: Supply Risks Remain in Focus
Brent crude has climbed toward $95 per barrel as tensions in the Middle East continue to fuel supply concerns. Additional pressure comes from threats to shipping routes in the Red Sea and reduced maritime activity around the Strait of Hormuz.
Any further disruptions could increase both shipping costs and delivery times for crude oil. If geopolitical tensions escalate, Brent could move closer to the $100 mark. On the other hand, easing tensions would likely reduce the geopolitical risk premium currently supporting prices.
USDJPY: Intervention Risk Is Growing
USDJPY has traded above 163, reaching its highest level in roughly four decades. Japanese authorities have once again signaled their readiness to act against excessive weakness in the national currency.
The yen continues to face pressure from the wide interest rate gap between the United States and Japan. Higher oil prices add to the challenge, as a weaker yen makes imported energy more expensive and reinforces inflationary pressures.
The probability of a currency intervention is increasing, meaning USDJPY could experience sharp price swings. However, without a change in the Bank of Japan’s monetary policy, any intervention may have only a temporary impact.
#NQ100: A Key Test for the Technology Sector
The #NQ100 index is entering a crucial period as major technology companies prepare to report quarterly earnings. Investors will be watching profit figures, artificial intelligence spending, and forward guidance particularly closely.
Strong earnings could revive demand for technology stocks. Conversely, disappointing results or rising AI-related spending without corresponding profit growth could trigger another wave of selling.
Another important risk factor is rising U.S. Treasury yields. Elevated oil prices continue to support inflation expectations, potentially delaying Federal Reserve policy easing—a scenario that typically weighs on growth stocks.
What Comes Next?
#Brent, USDJPY, and #NQ100 are all trading near important technical and fundamental levels. Their next major moves will largely depend on developments in global oil supply, potential action by Japanese authorities, and earnings results from leading technology companies.
According to FreshForex analysts , the combination of geopolitical uncertainty, elevated interest rates, and corporate earnings season is likely to keep volatility high across commodity, currency, and equity markets. Long 
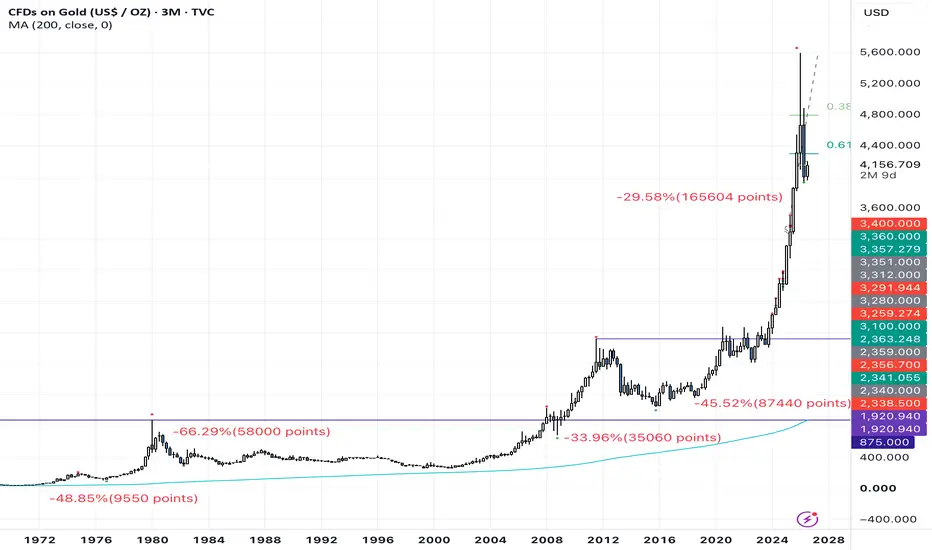
Is the correction over?Gold has started to recover after correcting nearly 30% from its recent all-time high.
Looking back over the past 50 years, every major Gold correction tells a different story.
1974–1976: -48.85%
1980–1982: -66.29%
2008: -33.96%
2011–2015: -45.52%
2026 (Current): -29.58%
At first glance, most traders focus only on the percentage decline.
However, what caught my attention was something else.
The absolute price movement has expanded dramatically over time:
1974: ~9,550 points
1980: ~58,000 points
2008: ~35,060 points
2011: ~87,440 points
2026: ~165,604 points (current)
While the percentage corrections remain within a surprisingly similar range, the size of each move in price has grown significantly.
To me, this reflects how much the Gold market has evolved—with greater liquidity, broader institutional participation, ETFs, algorithmic trading, and millions of retail traders worldwide.
This doesn't necessarily mean Gold has become more bearish or more bullish.
It simply reminds us that today's market is not the same market it was 20, 30, or 50 years ago. market risk factors.a single news event can move price, but lasting trends are usually the result of several market forces working together and they all influence how investors value risk and allocate capital.
Understanding these risk factors won't tell you where price will go next. It will help you understand why markets move.
Interest Rates
Interest rates determine the cost of borrowing and the return on holding cash.
When central banks raise rates, borrowing becomes more expensive, economic activity often slows, and investors reassess the value of riskier assets. Higher rates can also support a currency by attracting capital seeking better returns.
Lower rates generally have the opposite effect, encouraging borrowing, investment, and spending.
Inflation
Inflation measures how quickly the general level of prices is increasing.
When inflation remains above a central bank's target, markets often anticipate tighter monetary policy. Those changing expectations can influence bond yields, currencies, equities, and commodities long before any policy decision is announced.
Currency Movements
Exchange rates affect far more than the foreign exchange market.
A stronger currency can reduce the value of overseas earnings when converted back into the domestic currency, while a weaker currency can increase import costs. Currency movements also influence trade, investment flows, and the pricing of globally traded commodities.
Commodity Prices
Commodities are essential inputs for the global economy.
Large moves in oil, natural gas, industrial metals, or agricultural products can change production costs, inflation expectations, and economic growth forecasts. Because energy affects almost every industry, oil prices are closely monitored across financial markets.
Geopolitical Events
Markets generally respond negatively to uncertainty.
Wars, trade disputes, sanctions, elections, and political instability can disrupt supply chains, alter capital flows, and reduce investor confidence. During periods of elevated uncertainty, capital often rotates toward assets perceived as relatively safer.
Liquidity
Liquidity describes how easily an asset can be bought or sold without causing a significant change in price.
During periods of market stress, liquidity often declines, bid-ask spreads widen, and price swings become larger. This is why volatility can accelerate even when there is relatively little new information.
Government and Central Bank Policy
Markets constantly price in future policy.
Changes in taxation, regulation, government spending, or central bank communication can reshape expectations for economic growth and inflation. In many cases, the market reacts less to the decision itself than to whether it differs from what participants were already expected.
How These Risks Work Together
Market risk factors rarely act in isolation.
For example, a higher-than-expected inflation report may lead investors to expect higher interest rates. Bond yields could rise, the domestic currency may strengthen, equities might come under pressure, and gold could experience increased volatility as markets adjust to the new outlook.
One economic release can trigger a chain reaction across multiple asset classes because markets continuously reprice expectations.
** @currencynerd wisdom**
Price reflects the combined expectations of millions of market participants.
No single indicator explains every move, but understanding the major market risk factors provides the context behind price action. The objective is not to predict every headline, it is to recognise the forces influencing the market and manage risk as those conditions evolve.
put together by : Pako Phutietsile as @currencynerd
Education 
Long 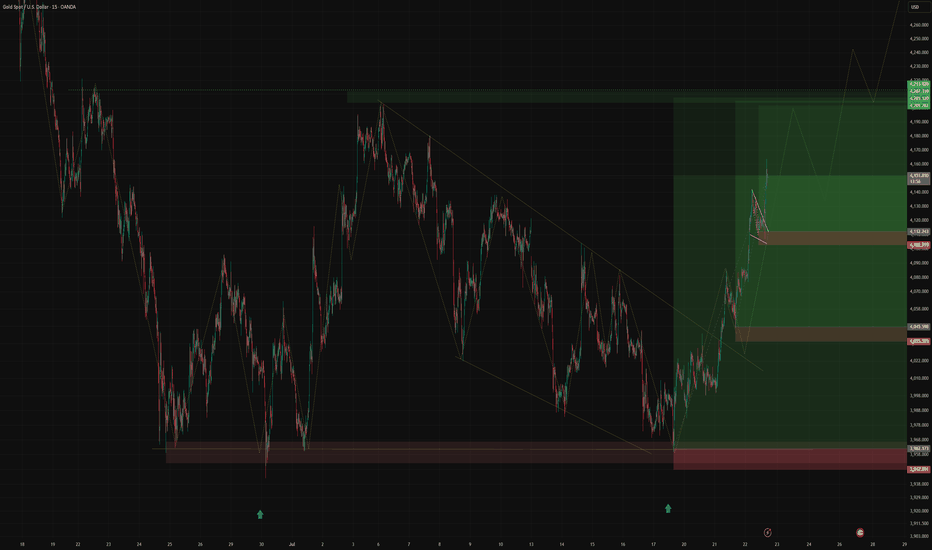
Long 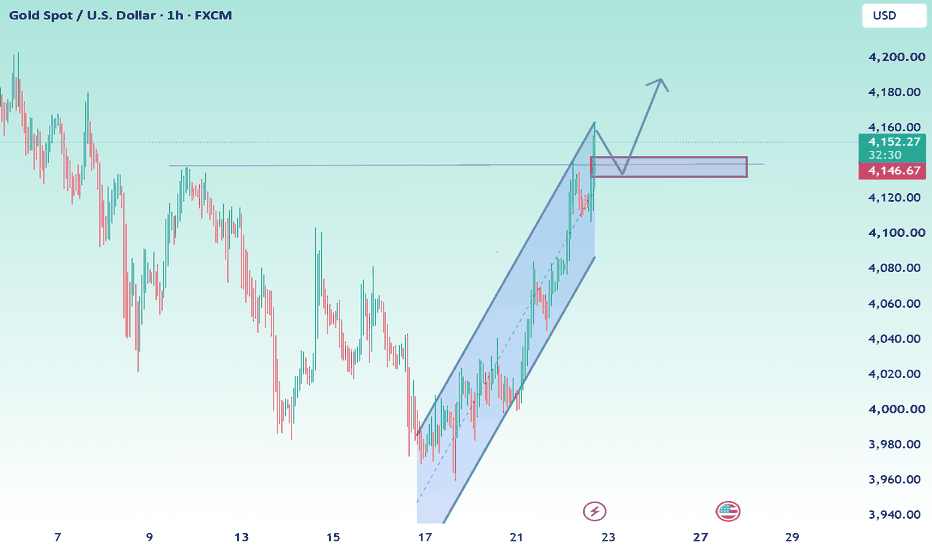
Long 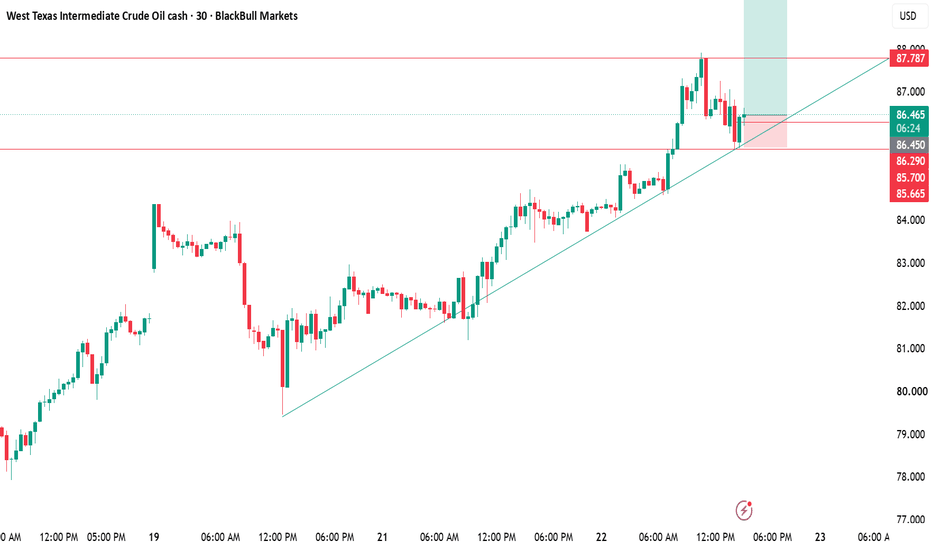
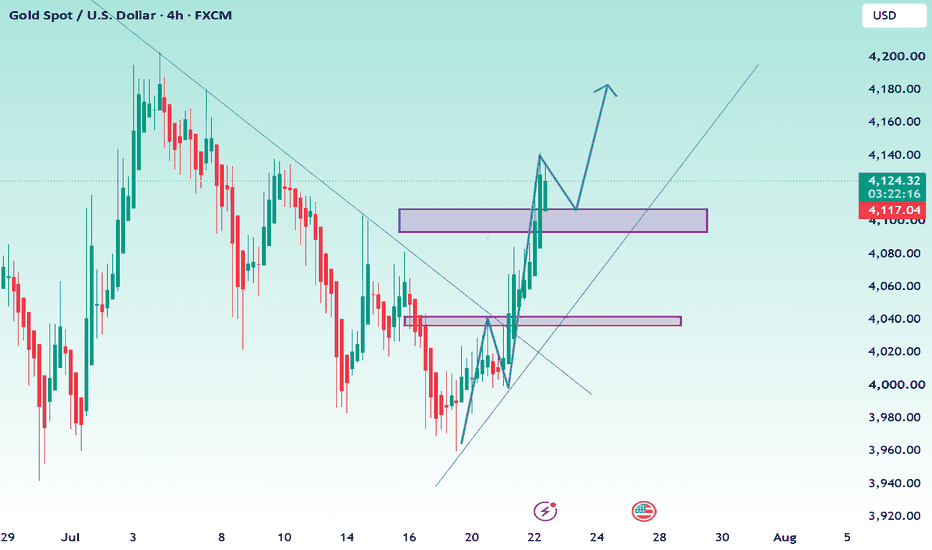
Gold Bulls Poised to Launch a New RallyGold surged sharply again after opening today, rebounding to a high near the previous peak of 4140 before facing resistance and pulling back. The trend has now shifted from bearish to bullish. This shift is primarily driven by a confluence of factors: a stream of recent news favorable to gold, market expectations of a low probability of a Federal Reserve rate hike, and the resulting inflow of capital into the asset.
Yesterday, I noted that the upside resistance lay at the $4100 mark; however, gold easily broke through this level today, signaling the start of a new rally. In this type of market environment, the strategy is simply to follow the trend. As I often emphasize: one should short gold when the market is weak and go long when the market is strong. Crucially, one should not attempt to short gold after it has broken to new highs following a rebound.
For today's trading, we need to focus on three points: 1. Look to go long on intraday pullbacks. 2. If gold maintains its strength during the European session, continue to go long during the US session. 3. If prices rise during the Asian and European sessions and show resilience against a decline during the US session, continue to go long the following day.
The key downside level to watch is 4076, which marked the low point after the opening. On the hourly chart, the base of the largest bullish candle sits near 4100—a level that coincides with the 0.618 Fibonacci retracement point and serves as a support floor. Meanwhile, the 0.382 retracement level for the move from 4076 to 4142 is located at 4117. Based on this analysis, I believe a pullback to the 4095–4110 range presents a good opportunity to go long. On the upside, watch for resistance in the 4170–4180 range. Long