Futures market
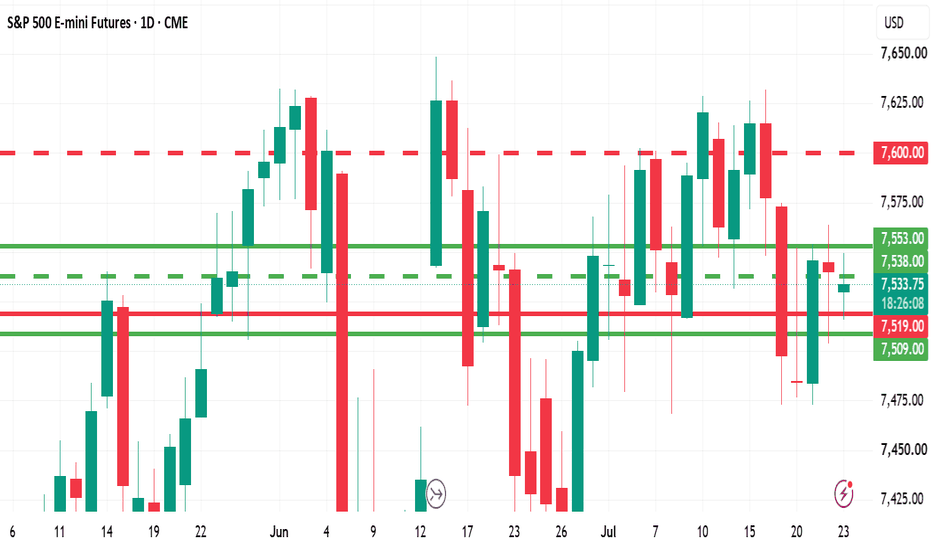
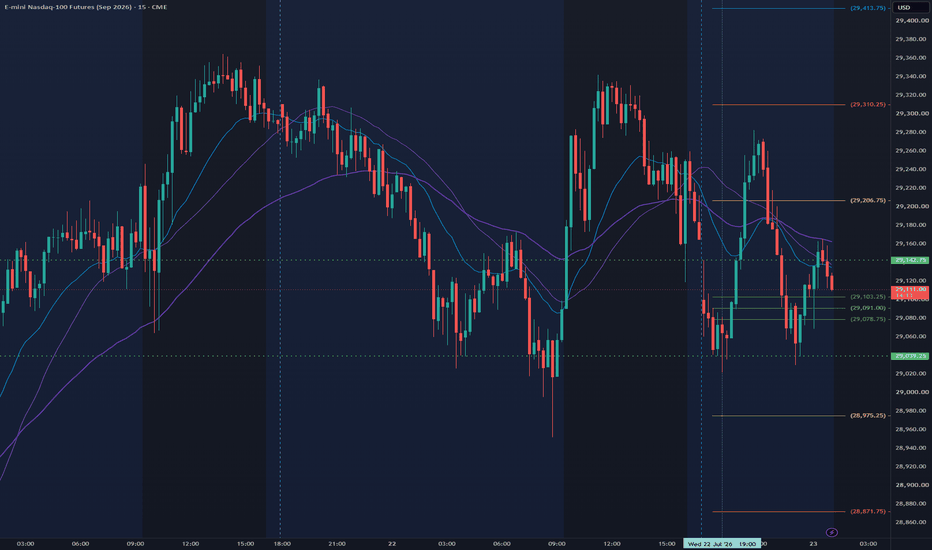
NQ Power Range Report with FIB Ext - 7/23/2026 SessionCME_MINI:NQU2026
- PR High: 29142.50
- PR Low: 29039.25
- NZ Spread: 231.0
Key scheduled economic events:
08:30 | Initial Jobless Claims
Session Open Stats (As of 12:15 AM)
- Session Open ATR: 640.45
- Volume: 53K
- Open Int: 287K
- Trend Grade: Short
- From BA ATH: -6.3% (Rounded)
Key Levels (Rounded - Think of these as ranges)
- Long: 31904
- Mid: 29517
- Short: 27131
Keep in mind this is not speculation or a prediction. Only a report of the Power Range with Fib extensions for target hunting. Do your DD! You determine your risk tolerance. You are fully capable of making your own decisions.
BA: Back Adjusted
BuZ/BeZ: Bull Zone / Bear Zone
NZ: Neutral Zone
Copper — a six-week high, now pausing at the bundleCopper hit a six-week high this week on a mix of supply shocks — a storm disrupting Chilean mines (Codelco, Antofagasta), tightening Comex inventories on US tariff positioning, and a Chinese import premium at its highest since last May. The rally has been real, not speculative: production is genuinely down.
The bundle read here: the MA convergence has acted as support through the pullback stages of this month's rally, and price is now pausing right at it after Tuesday's peak. Whether this is a healthy pause before the next leg or the start of a real reversal is exactly the open question the structure poses.
Not financial advice — for analysis and education only. Method: Insen / OpenTraders.
USOIL Tests Key ResistanceMarket View
WTI crude oil continues to recover on the 4H chart after forming a strong base near the recent lows.
The market has shifted from a prolonged bearish trend into a short-term bullish recovery, supported by a sequence of higher highs and higher lows. Buyers remain in control for now, but price is approaching an important resistance area where profit-taking may emerge.
Whether oil can sustain this recovery will largely depend on how price reacts around the current resistance zone.
Key Resistance Zone
First resistance: 88.20–89.00
This is the nearest resistance area and the current decision zone.
A confirmed breakout above this region would signal continued bullish momentum.
Second resistance: 90.50–92.00
This represents the next major upside objective if buyers successfully clear the current resistance.
Major resistance: 94.00–96.00
A sustained move into this area would confirm a much stronger medium-term recovery.
Key Support Zone
First support: 86.20–87.00
This is the first support buyers need to defend to maintain the current bullish structure.
Second support: 83.80–85.00
This area previously acted as a breakout base and could attract renewed buying interest during a pullback.
Major support: 80.00–81.50
A break below this zone would weaken the recovery structure and shift momentum back toward sellers.
Market Sentiment
Market sentiment has turned cautiously bullish.
The recent series of higher highs and higher lows suggests buyers currently have the upper hand. However, after a strong advance, the market is approaching an important resistance zone where volatility and profit-taking could increase.
A breakout above 89.00 would strengthen bullish sentiment.
A move below 86.20 would suggest that a deeper correction is developing.
Please share your view below:
Will USOIL break above 89.00 and continue its recovery toward 92.00? Or will sellers defend resistance and trigger another pullback?
More market structure and key level updates will be shared regularly.
XAUUSD: Bulls Hold the Trend, But 4,147 Decides XAUUSD: Bulls Hold the Trend, But 4,147 Decides
Market Context
Gold is cooling after a four-day recovery as higher oil prices from Middle East tensions bring inflation concerns back into focus. This can make the market more cautious about Fed policy and limit gold’s upside momentum.
At the same time, the US Dollar is not fully strong either, as traders remain alert to possible USD/JPY selling pressure and intervention risk. That keeps gold in a tricky position: not fully bearish, but not strong enough to chase at the high.
Key point: gold is still inside a short-term bullish structure, but buyers must defend the pullback zones if they want continuation.
Technical Structure
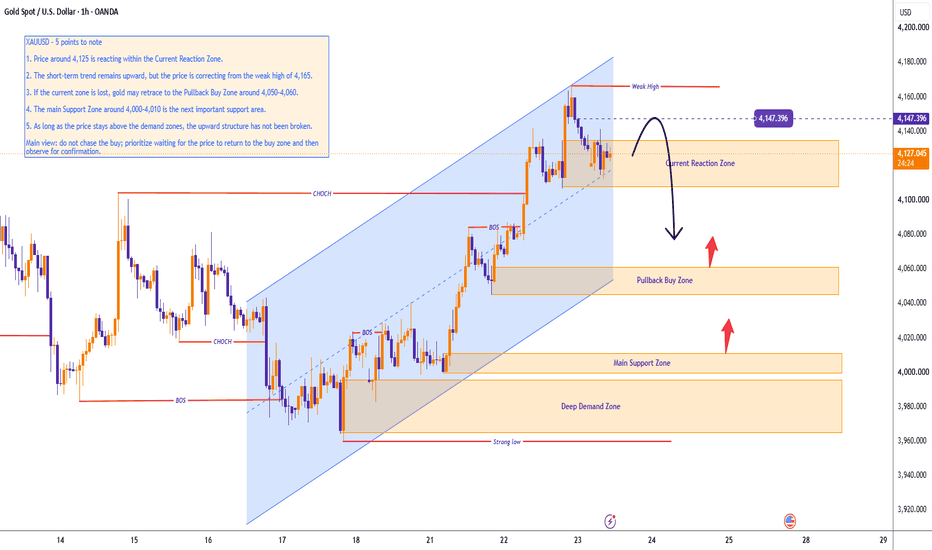
Gold is trading around 4,127 and reacting inside the Current Reaction Zone after pulling back from the weak high near 4,165.
The short-term structure remains upward, supported by the recent bullish channel and previous BOS signals. However, momentum is slowing near the upper area, and RSI hovering around 50 shows that the market is still at a decision point.
The first key level is 4,147. If buyers reclaim this level, gold may retest the weak high and extend higher.
If the current reaction zone fails, price may pull back toward 4,050 - 4,060. This is the Pullback Buy Zone and the first area where buyers may reload.
Below that, 4,000 - 4,010 is the Main Support Zone. As long as gold holds above the demand structure, the broader short-term bullish trend is not broken.
Key Levels
Current Price: 4,127
Weak High: 4,147 - 4,165
Current Reaction Zone: 4,100 - 4,130
Pullback Buy Zone: 4,050 - 4,060
Main Support Zone: 4,000 - 4,010
Deep Demand Zone: 3,960 - 3,990
Bullish Continuation: Above 4,147
Bearish Risk: Below 4,050
Trading Plan
Buy Pullback
Entry: 4,050 - 4,060
SL: Below 4,000
TP: 4,100 / 4,127 / 4,147
Condition: Price must pull back into the buy zone and show bullish confirmation. Buyers need to defend the channel structure and form a clear reaction before entry.
Buy Breakout
Entry: Above 4,147 after breakout and retest
SL: Below 4,100
TP: 4,165 / 4,180 / 4,200
Condition: Price must reclaim 4,147 with strength, hold the retest, and continue forming higher lows. Avoid chasing the first breakout candle without confirmation.
Sell Reaction
Entry: 4,147 - 4,165
SL: Above 4,180
TP: 4,127 / 4,100 / 4,060
Condition: Price reaches the weak high zone but fails to continue higher. Bearish rejection from this area could trigger a corrective pullback toward the buy zone.
Breakdown Sell
Entry: Below 4,050 after confirmed breakdown
SL: Above 4,100
TP: 4,010 / 4,000 / 3,980
Condition: Price loses the Pullback Buy Zone, retest fails, and bearish momentum returns. This would increase the risk of a deeper correction toward the Main Support Zone.
Overall Bias
Gold remains short-term bullish, but the market is no longer clean enough to chase.
Above 4,147, buyers can extend the recovery toward 4,165 and 4,200. Below 4,050, the bullish structure weakens and price may return toward 4,000 - 4,010.
Best approach: wait for either a clean breakout above 4,147 or a controlled pullback into 4,050 - 4,060.
Will buyers reclaim 4,147, or will gold need one deeper pullback before the next move?
XAUUSDTactical Short Setup Market NarrativeThe market on the 1-hour timeframe is currently exhibiting bearish sentiment after testing the upper resistance area and failing to sustain higher levels. The price is showing signs of rejection, suggesting that sellers may regain control to push the market back toward the lower support zone.
Key Levels
Entry: Current price level (around 4,128).
Target: Support zone near 3,958.
Trade Plan:
Entry: Look for short positions at the current level.
Stop Loss (SL): Position above the 4,171 resistance level to manage risk and invalidate the bearish setup if breached.
Take Profit (TP): Target the support zone identified near 3,958.
Educational Insight:
When price approaches a major resistance level and struggles to break higher, it often indicates weakening buyer interest. Trading in the direction of the underlying structure, combined with a clear stop loss, is a disciplined way to capitalize on potential downside moves in a range-bound market
Disclaimer
This analysis is for educational purposes only and does not constitute financial advice. Trading involves significant risk; please conduct your own due diligence and manage your risk according to your personal trading plan
BITCOIN Long
BITCOIN BUY LIMIT ORDER : 65405
Stop Loss: 64860
Remove risk/Partials @: 65975
Take profit: 66085
Trade Plan: Long
Bias: BULLISH short term.
Entry reason: Price will most likely test key TPO area.
Fundamentally: The short-term valuation tool also shows temporarily undervalued against the competing index
Stop Loss: Below nearest low.
First target: 65975
Please refer to BTCUSD for CFDs symbols
Consolidation at high levels. Buy at support levels.On Wednesday, following a strong rally, gold entered a period of consolidation at elevated levels; during early Asian trading, the price rebounded after approaching the 20-period moving average on the 2-hour chart, maintaining a bullish-leaning, range-bound trend.
Currently, the price is trading above short- and medium-term moving averages that are fanning out upwards, indicating that the bulls remain in control. However, the MACD has shown signs of turning downwards at a high level, indicating a slowdown in short-term momentum. Attention should be paid to the risk of a correction after the surge.
The area around 4100 has now transformed from previous resistance into significant support. As long as the price holds above this level, the overall rebound is likely to continue. The key resistance levels to watch are the previous highs of 4180 and 4202. If these levels can be effectively broken and stabilized, the market may further challenge the 4278 area.
However, caution is warranted: if the price falls below 4100, short-term profit-taking could ensue, and attention should shift to the support zone around 4080–4075.
Short-term trading strategy: Focus primarily on buying the dips. Look to enter long positions near the 4100 support level, or alternatively at 4080–4075, with a target of 4200.
Escalating tensions support oil prices furtherUSOIL remains supported amid escalating geopolitical tensions in the Middle East. New strikes in the Red Sea exert pressure on global supply chains and embed a geopolitical risk premium into shipping costs. Concurrently, these attacks serve to bolster Tehran's negotiating leverage, while Washington maintains pressure on Iran by targeting key infrastructure.
These developments signal that prolonged friction may persist and keep the Strait of Hormuz closed, driving oil supply deficits. Meanwhile, the US Strategic Petroleum Reserve (SPR) has dropped to its lowest level since 1983—hovering just above 250 mln barrels—leaving operational capacity stretched. This presents a structural risk to US crude supply and may further bolster prices if the SPR continues to shrink.
Consequently, the US may find incentive to de-escalate tensions, which might cap oil's upside. Nevertheless, prices may continue to strengthen pending any clear signs of diplomatic easing.
Technically, USOIL maintains a strong rally above expanding EMAs, signaling sustained bullish momentum. A breach above the nearest resistance at 85.64 may drive prices toward the next resistance target at 90.90. Conversely, a drop below 85.64 may trigger a pullback toward support at 83.00.
By Van Ha Trinh - Financial Market Strategist at Exness
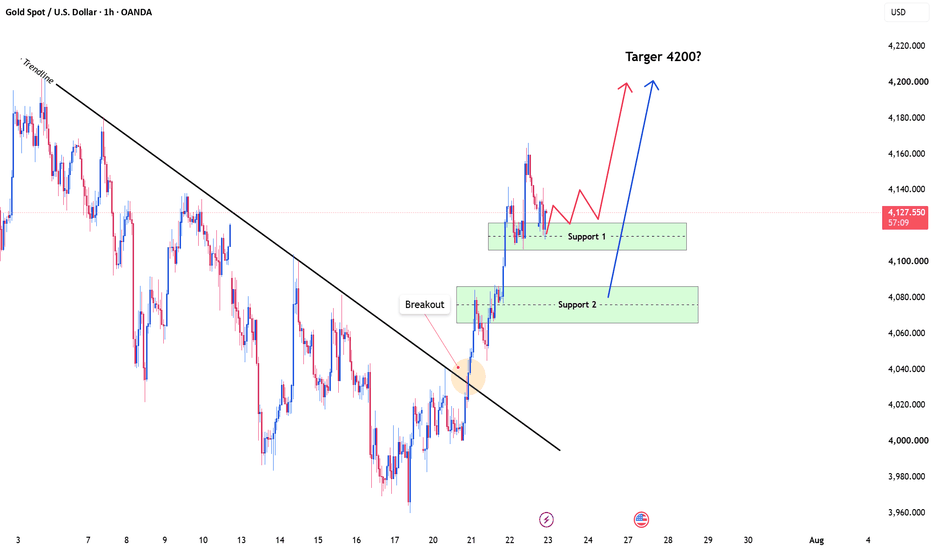
XAUUSD Bulls Hold the BreakoutGold price has been pushing higher.
After breaking above the descending trendline, momentum accelerated and carried price toward 4,160.
Now, price is pulling back into the first support zone around 4,105–4,120.
This pullback isn’t weakness, it’s a retest.
Sellers are trying to push price lower, but buyers are still defending the breakout structure.
As long as this support holds, bullish momentum can return. A deeper correction toward 4,070–4,085 would remain another important demand area.
I am anticipating the next impulsive leg higher toward the 4,200 target.
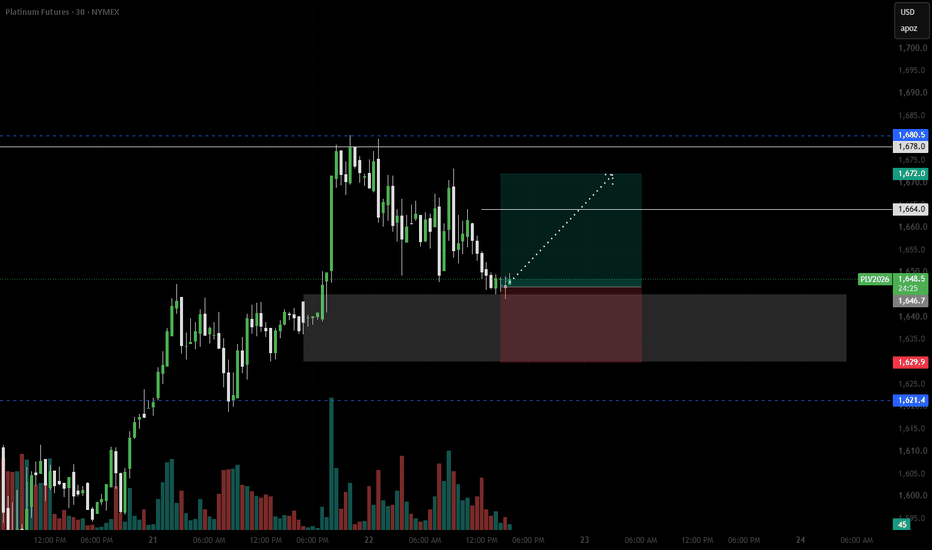
Platinum Long
PLATINUM MARKET BUY ORDER : 1646.7
Stop Loss: 1629.9
Remove risk/Partials @: 1664.0
Take profit: 1672.0
Trade Plan: Long
Bias: BULLISH short term.
Entry reason: Price will most likely test key TPO area.
Fundamentally: The short-term valuation tool also shows temporarily undervalued against the competing index
Stop Loss: Below nearest low.
First target: 1664.0
Please refer to XPTUSD for CFDs symbols
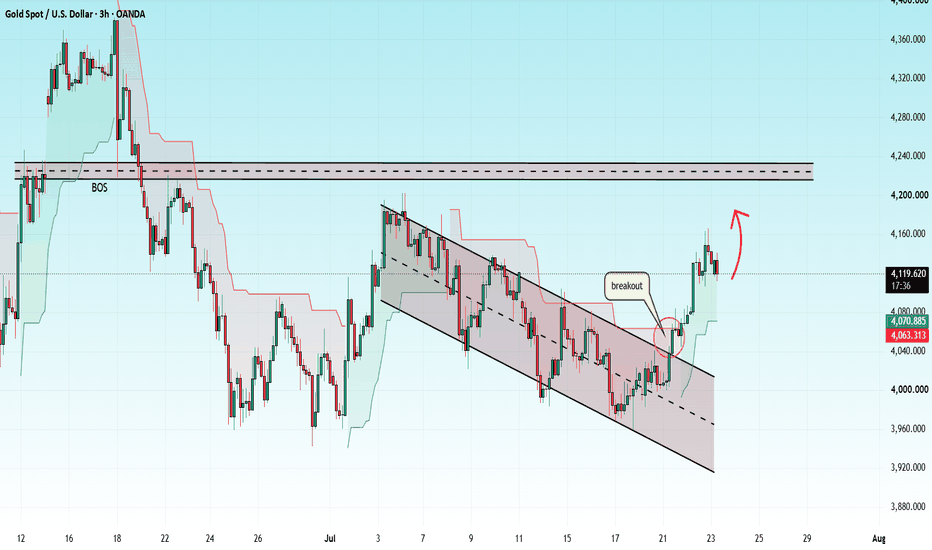
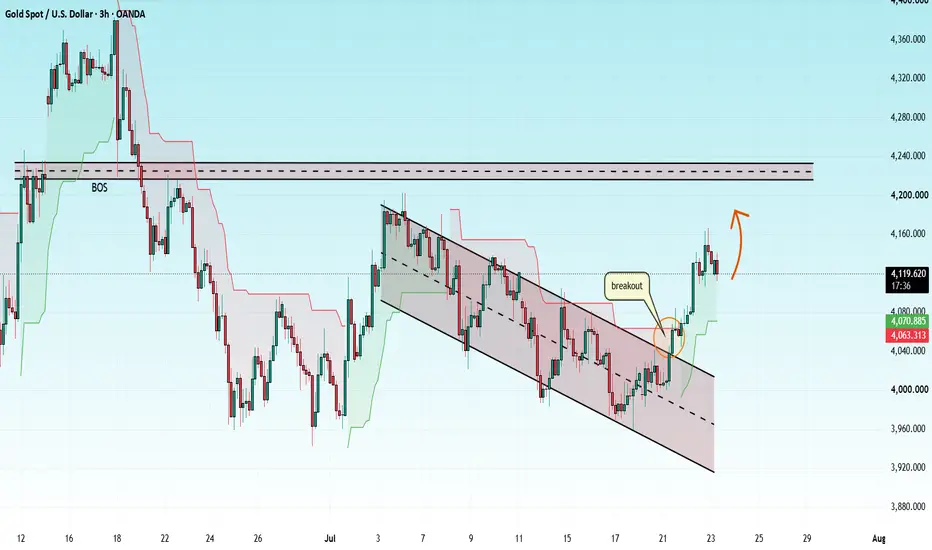
XAUUSD H3: Buyers Gradually Reclaiming Market StructureGold just broke out of the descending price channel that's been running since the high above 4.200, closing firmly above the upper edge of the channel — a fairly clear breakout signal after a long stretch of decline. The resistance zone at 4.220–4.240 above (where a BOS occurred previously) will be the next technical target if this rally continues.
My plan is to buy right at the current price level around 4.110–4.120, stop loss below 4.070 (below the old upper channel edge), targeting a first objective at 4.150 and a further target at 4.240.
The biggest risk is if price falls back inside the channel — once price closes below 4.070, this breakout will be considered unsuccessful, and I'll stay on the sidelines waiting for a new signal rather than forcing a buy.
This is just my personal take based on technical analysis. Wishing you successful trading.
## GOLD (XAU/USD) – 30-Minute Chart Analysis ## GOLD (XAU/USD) – 30-Minute Chart Analysis (Medium & Short-Term Swing)
1. Gold is currently trading inside a **crucial demand-supply zone around 4,090–4,100**, making this the most important decision area for both short-term and medium-term direction.
2. The recent uptrend remains intact as long as this **crucial support zone** holds. The sequence of **higher highs and higher lows** still favors buyers in the medium term.
3. **Short-Term Bullish Scenario:** If buyers successfully defend **4,090–4,100**, Gold is likely to resume its upward swing towards **4,160**, followed by **4,220**, with a medium-term target around **4,290–4,300**.
4. A bullish confirmation would be a **strong bullish candle accompanied by higher volume** from the support zone, indicating fresh buying interest.
5. **Short-Term Bearish Scenario:** If Gold closes decisively below **4,090**, the current bullish swing structure will weaken, and profit booking could accelerate.
6. In the bearish case, the first downside target is expected around **4,040**, followed by **4,000**, where buyers may attempt to stabilize the market.
7. The chart indicates that the current pullback appears to be a **retest of the breakout zone**, which is a common continuation pattern in a healthy uptrend. Therefore, the reaction at this level is more important than the pullback itself.
8. From a **medium-term perspective**, the probability still favors the bulls as long as the price continues to hold above the crucial support zone. A successful retest would establish another **Higher Low (HL)** and strengthen the overall uptrend.
9. Traders should avoid taking aggressive directional positions **inside the crucial zone**. It is better to wait for confirmation—a bullish bounce for long positions or a decisive breakdown for short positions.
10. **Overall Outlook: Neutral to Moderately Bearish (6.5/10)** while Gold breaks crucial zone comfortably:
11. **Overall Outlook: Neutral to Moderately Bullish (3.5/10)** while Gold remains above **4,090–4,100**. Expected paths:
* **Bullish:** **4,110 → 4,160 → 4,220 → 4,290**
* **Bearish:** **4,090 Breakdown → 4,040 → 4,000 → 3,990**
---
### Key Trading Levels
* **Crucial Support Zone:** **4,090–4,100**
* **Immediate Resistance:** **4,160**
* **Major Resistance:** **4,220**
* **Medium-Term Target:** **4,290–4,300**
* **Bearish Confirmation:** **Close below 4,090**
* **Bullish Confirmation:** **Strong bounce and close above 4,140 after defending the support zone**
---
### Disclaimer
> **Disclaimer:** This analysis is based on technical indicators, swing structure, price action, support and resistance zones, and the current market structure. It is intended **solely for educational and informational purposes** and **should not be considered financial or investment advice**. Financial markets are inherently volatile, and no technical analysis can guarantee future price movements. Please conduct your own research and consult a qualified financial advisor before making any investment or trading decisions.
XAUUSD H1: Will the New Support Hold?Gold has just gone through a stretch of sharp volatility following a hot rally, but is still holding above the key support zone around 4.107–4.121 — an area that lines up with the rising moving average. The long-term bullish structure from the 3.940 low remains intact.
My plan is to wait for price to pull back to the 4.107–4.121 support zone before buying, stop loss below 4.085, targeting a first objective at 4.165 and a further target at 4.200 if the rally continues.
The biggest risk is if this support zone gets lost — once price closes below 4.085, I'll consider this short-term bullish structure broken and stay on the sidelines temporarily rather than chasing the price.
This is just my personal take based on technical analysis. Wishing you successful trading.
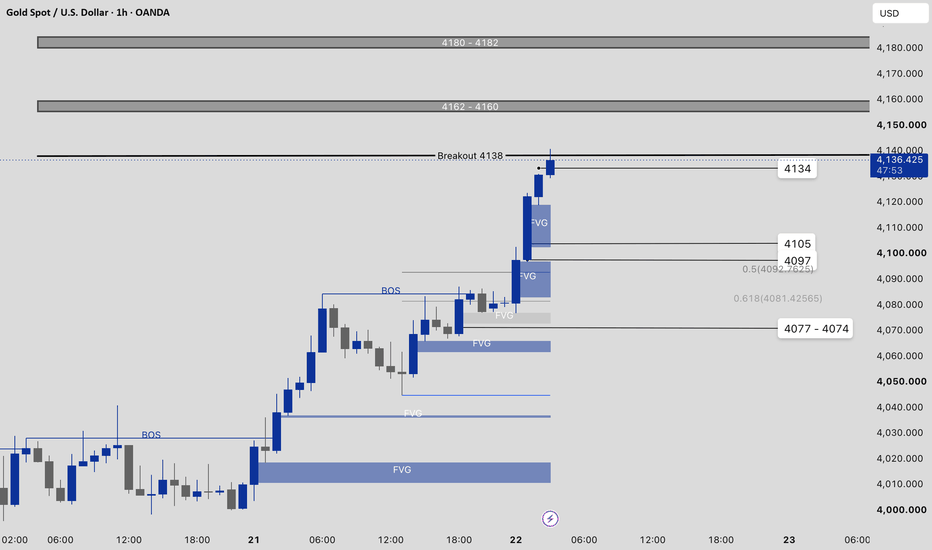
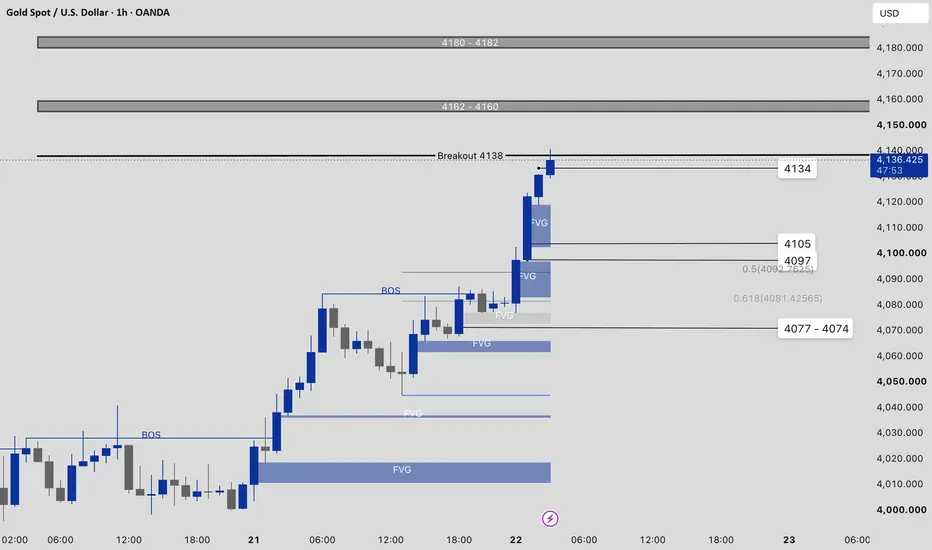
XAUUSD Trading Plan (H1) - Key Levels & Scenarios🔹 Scenario 1: BUY on Retest (Pullback)
Buy Zone (FVG / Support): 4097 – 4105
Entry: 4100
Stop Loss: 4088
Take Profit: 4138 – 4160
🔹 Scenario 2: BUY Breakout (Expansion)
Wait for H1 candle to close above 4138 before entering on the retest to avoid fakeouts.
Breakout Level: 4138
Retest Entry: 4138 – 4140
Stop Loss: 4125
Take Profit: 4160 – 4180
🔹 Scenario 3: Counter-Trend SELL (Resistance Zones)
Sell Zone 1: 4160 – 4162
Entry: 4160 | SL: 4172 | TP: 4138 – 4105
Sell Zone 2: 4180 – 4182
Entry: 4180 | SL: 4193 | TP: 4160 – 4138
XAUUSD H1: Sellers Still Haven't Found Their FootingGold's bullish structure has been holding up well since the low around 4.000, with consecutive higher lows — a signal that buyers are still in control of this entire upward move. The 4.100–4.115 zone is now the nearest support after price just broke above this area.
My plan is to wait for price to pull back to the 4.100–4.115 zone before buying, stop loss below 4.085, targeting a first objective at 4.165 and a further target at 4.200 if the rally continues.
The biggest risk is if this support zone gets lost — once price closes below 4.085, I'll consider this short-term bullish structure broken and stay on the sidelines temporarily rather than chasing the price.
This is just my personal take based on technical analysis. Wishing you successful trading.
Gold Analysis (July 23): Gold Rises Despite Middle East TensionsGold Analysis (July 23) – Gold supported up to around 4,170 yesterday despite Middle East tensions – Gold rose after breaking out of the downward price channel and descending trendline resistance. Today, investors should keep an eye on the Initial Jobless Claims data released at 19:30.
Investors are flocking back to the gold market as attacks between the U.S. and Iran escalate into their second week. On Wednesday, U.S. President Donald Trump declared that the U.S. would blow up an Iranian bridge or power plant—including those in the capital, Tehran—every time Iran fires on ships in the Strait of Hormuz. Meanwhile, Iran threatened to strike U.S.-linked infrastructure and energy facilities in the region if Washington carries out Trump's threats. Earlier on Wednesday, U.S. Secretary of State Marco Rubio accused Iran of not being "serious" about reaching an agreement with the U.S., while emphasizing that Washington remains "committed to diplomacy" in the Middle East.
Read more : blog ngoại hối - https://blogngoaihoi (.)co/
XAUUSD Daily Analysis📅 XAUUSD Trading Plan – 23 Jul
Price continues to trade above PWH, keeping the higher-timeframe bullish structure intact.
The 4133–4136 zone is the first intraday resistance before PDH at 4166. Acceptance through this resistance keeps PDH as the next objective, while acceptance above PDH opens the path to WB-PWH (4202). A confirmed rejection from 4133–4136 or a loss of PWH shifts focus back to 4087 and 4076.
Trade only after 15M confirms acceptance or rejection at the mapped level.
━━━━━━━━━━━━━━━━━━
📊 BIAS
━━━━━━━━━━━━━━━━━━
🟢 Weekly: Bullish (Developing)
🟢 Daily: Bullish
🟢 H4: Bullish
🟢 H1: Bullish
━━━━━━━━━━━━━━━━━━
📍 LEVELS
━━━━━━━━━━━━━━━━━━
🔺 Resistance:
* 4133–4136 (Intraday Resistance Zone)
* 4166 (PDH)
* 4202 (WB-PWH)
🔻 Support:
* 4104 (PWH)
* 4087 (DB-PDH)
* 4076 (PDL)
━━━━━━━━━━━━━━━━━━
🟢 BUY SCENARIOS
━━━━━━━━━━━━━━━━━━
* Hold above 4104 (PWH) with 15M Bullish Displacement + MSS.
* Accept 4133–4136 with 15M Bullish Displacement + MSS.
* Break and accept 4166 (PDH) with 15M Bullish Displacement + MSS.
🎯 TP:
4133–4136 → 4166 → 4202
━━━━━━━━━━━━━━━━━━
🔴 SELL SCENARIOS
━━━━━━━━━━━━━━━━━━
* Reject 4133–4136 with 15M Bearish Displacement + MSS.
* Reject 4166 (PDH) with 15M Bearish Displacement + MSS.
* Lose 4104 (PWH), retest as resistance with 15M Bearish Displacement + MSS.
🎯 TP:
4104 → 4087 → 4076
July 23, 2026 - XAUUSD Analysis and Potential Opportunity📊 Summary:
Bullish momentum remains strong, and the preferred strategy is to buy pullbacks where support holds. That said, after rallying roughly 160 points over the past two days, the market also carries a higher risk of a short-term pullback.
Today, keep a close eye on the 4107 support level. If price breaks below 4107, the preferred strategy shifts to selling pullbacks where resistance holds. A further break below 4100 would strengthen bearish momentum. If 4107 continues to hold, it remains an attractive area to look for long opportunities.
In short, above 4107, the preferred strategy is to buy pullbacks where support holds. Below 4107, the preferred strategy shifts to selling pullbacks where resistance holds.
🔍 Key Levels to Watch:
• 4166 – Resistance
• 4144 – Resistance
• 4138 – Resistance
• 4130 – Resistance
• 4113 – Support
• 4107 – Key Support
• 4100 – Support
• 4090 – Support
📈 Intraday Strategy:
SELL: If price breaks below 4107 → target 4104, with further downside toward 4100, 4097, 4090
BUY: If price holds above 4130 → target 4134, with further upside toward 4138, 4141, 4144
If you find this helpful or traded using this plan, a like would mean a lot and keep me motivated. Thanks for the support!
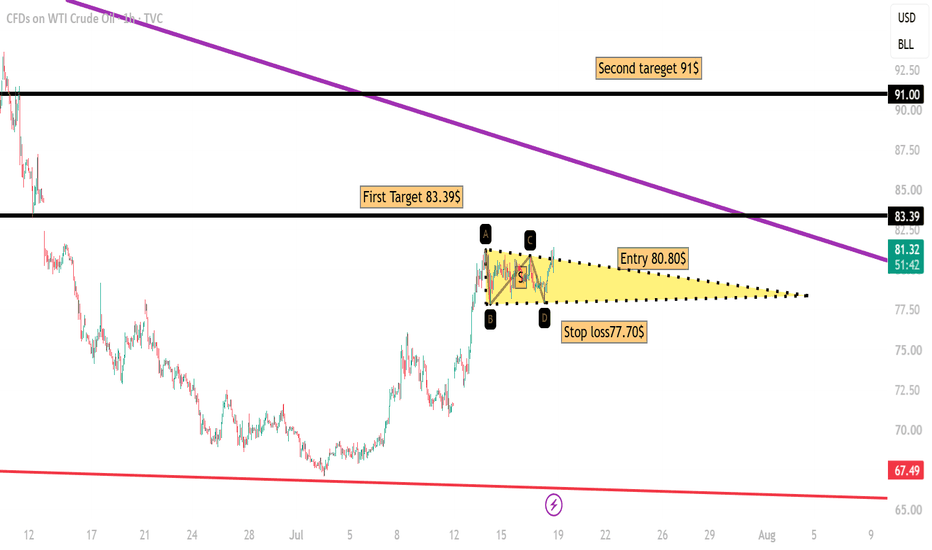
WTI Crude Oil – Professional Technical Analysis (1H Chart)WTI Crude Oil is showing signs of a bullish continuation after a strong impulsive rally from the recent lows. The current price action is consolidating within a symmetrical triangle, indicating a temporary pause before the next directional move. The broader trend remains bullish as long as price holds above the key support level.
Technical Outlook
Following a sharp bullish impulse, the market has entered a healthy consolidation phase.
Price is compressing inside a symmetrical triangle, reflecting a balance between buyers and sellers before a potential breakout.
The recent breakout from the previous range suggests buyers continue to control the medium-term trend.
Trade Setup
Buy Entry: 80.80
Stop Loss: 77.70
Target 1: 83.39
Target 2: 91.00
Technical Confluence
✅ Symmetrical Triangle continuation pattern.
✅ Strong bullish impulse preceding the consolidation.
✅ Higher lows remain intact within the current structure.
✅ Price continues to trade above major medium-term support.
Trading Plan
A confirmed breakout above the triangle resistance near 80.80 would validate the continuation pattern and likely trigger the next bullish wave toward 83.39, which represents the first major resistance level.
If bullish momentum remains strong and 83.39 is broken with conviction, the next upside objective is 91.00, where a significant higher-timeframe resistance is located.
Invalidation
A sustained break and hourly close below 77.70 would invalidate the bullish setup, indicating that buyers have lost momentum and increasing the probability of a deeper correction toward lower support levels.
Risk Management
Traders should wait for a confirmed breakout accompanied by increased volume or a strong bullish candle before initiating long positions. This approach helps reduce the risk of false breakouts commonly seen in triangle formations.
Bias: Bullish (Short-Term) 📈
Entry: 80.80
Stop Loss: 77.70
Target 1: 83.39
Target 2: 91.00
Invalidation: Hourly close below 77.70