Education

Bitcoin – 4H Chart AnalysisBitcoin has made a strong bullish move from the ₹76,800–77,200 support zone and is now consolidating near $80,500.
The key resistance zone is $81,000–81,900. A sustained breakout above this zone with strong volume can indicate further upside momentum. On the downside, $76,800–77,200 remains the major support zone.
Key levels:
🔹 Resistance: $81,000–81,900
🔹 Support: $76,800–77,200
🔹 Current structure: Bullish, but facing resistance
Short 
Long 
Ethereum – 4H Chart AnalysisEthereum has shown a strong recovery from the $2,440–2,500 support zone and is currently consolidating around $2,580.
The key resistance zone is $2,620–2,670. A sustained breakout with strong volume can support further upside momentum, while rejection may lead to a pullback toward the support zone.
Key levels:
🔹 Resistance: $2,620–2,670
🔹 Support: $2,440–2,500
🔹 Current structure: Bullish, but facing resistance
 Short
Short
Long 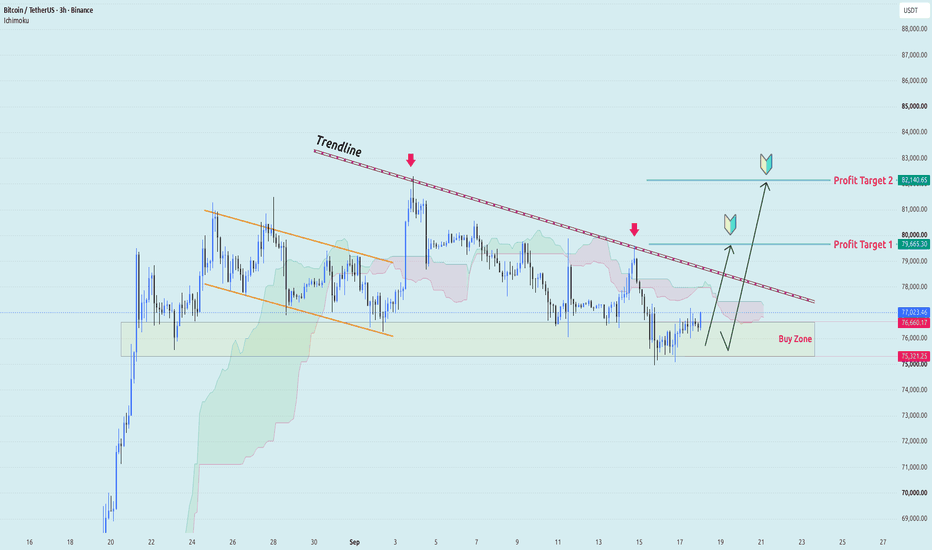
ETHUSDT: Supply Zone Sweep & Rejection | 1:3.2 R:R Short SetupMarket Structure & Thesis:
Ethereum staged a strong impulsive run out of the $2,370–$2,400 consolidation base, but momentum is stalling out right at a major overhead liquidity pool ($2,644–$2,655). The 1-hour chart displays a clear double-top / liquidity sweep followed by immediate wick rejection, signaling that aggressive sellers are defending this supply zone.
Trade Execution Details:
Bias: Bearish (Short)
Entry: ~$2,628.64
Stop Loss (SL): $2,654.59 (Above structural high / liquidity sweep)
Take Profit (TP): $2,545.83 (Previous breakout retest & key horizontal support)
Risk / Reward: 1 : 3
Invalidation:
An hourly candle body close above $2,655 breaks the bearish reversal structure and invalidates the short setup. Long 
Bitcoin may fall to 58000 againCOINBASE:BTCUSD
Namaskaram Everyone
Why is very important, why i am giving you a sell here.
so here is my reasons.
# As per neowave Market finished a major bullish trend at the top 1,26,296.
Retraced 61 percent from there.
# Now we are seeing a price jump from this 61 percent which is 60,000 price area.
But market is only given a price wise fall here , still there is some space for consolidation a time wise correction
# Major resistance area is 98,000 , no doubt about it. But if this is going to be an diagonal than price must retrace from current area in form of ((D)) and ((E)) leg.
# if this happen than we have a great risk to reward ration of 10 times and if we do compounding than more.
# Now why price must behave this way, honestly price can behave any number of ways but this way we a good risk reward ratio so we are givng a trade suggestion here.
I dont post regulary updates about instrument, but i have found a new approch to neowave and its easy to code and update. so if you are interested in Neowave Trades , keep following us.
and if you have any query related to anything , you can leave comment here.
Thank You.
Thank You. Short 
Education

BITCOIN (BTC/USD) – DAILY CHART - Fibonacci AnalysisBitcoin is consolidating above the 0.618 Fibonacci support. A sustained breakout above $77,987 may open the way toward higher resistance levels.
🎯 TRADE LEVELS:
🟢 Entry: Above $77,987
🛑 Stop Loss: $74,616
🎯 Target 1: $82,281
🎯 Target 2: $94,681
📌 Wait for daily candle confirmation above resistance. Trail SL as price moves in your favor.
DISCLAIMER :
This content is created by Logic Trade Room for educational and informational purposes only.
It is not financial advice, investment advice, trading advice, or a recommendation to buy or sell any security, index, futures contract, or options contract.
Trading and investing in the stock market involve substantial risk, including the risk of losing your entire invested capital. Past performance does not guarantee future results.
The entry, stop-loss, and target levels mentioned are illustrative chart-based levels and may change with market conditions. No trade setup or market prediction is guaranteed to be accurate.
Always conduct your own research, verify live market prices, and consult a qualified financial advisor before making investment decisions.
Trade with logic. Risk with discipline.
Logic Trade Room Long 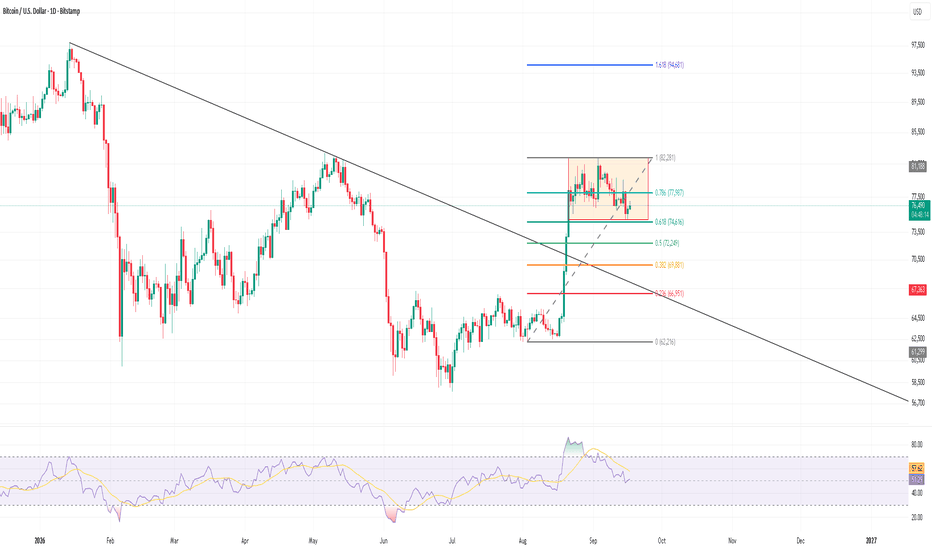
Professional BTC/USD Technical AnalysisMarket Structure Overview
The BTC/USD 45-minute chart shows a strong bullish expansion from the $75,500–$76,200 demand zone. After forming a base and producing a market-structure break, Bitcoin developed a sequence of higher highs and higher lows, eventually accelerating above the $78,000 area.
The strongest move occurred around the $78,000 level, where price broke sharply higher and advanced toward the $81,500–$82,000 resistance region. This confirms strong short-term buying momentum, although the latest price action suggests that the market is becoming vulnerable to a pullback after the extended rally.
Key Resistance Zone
The immediate resistance is around $81,800–$82,200. Price is approaching this area after a strong impulsive advance, and the chart already shows signs of hesitation near the upper boundary.
A rejection from this zone could trigger profit-taking and a short-term corrective move toward lower intraday support.
Support and Demand
The most important structural demand zone is located around $75,500–$76,200. This area previously acted as an accumulation/base zone and was followed by the latest major bullish expansion.
For the current trend, the nearer support levels around $80,800–$81,200 should be monitored first. Holding above these levels would keep the short-term bullish structure intact, while a deeper retracement could bring price back toward the $78,000 breakout region.
Potential Price Scenario
If BTC continues to hold above the recent breakout structure, another test of $82,000 is possible. However, a clear rejection around $81,800–$82,200 could lead to a corrective pullback as traders lock in profits.
The chart's projected path suggests a potential final push toward the $82,000 area followed by a take-profit/pullback phase.
Confirmation
Bullish continuation would be supported by a clean 45-minute close above $82,000 followed by successful support confirmation.
A bearish short-term scenario would become more relevant after a strong rejection from resistance combined with a break below the latest higher-low structure.
Overall Structure
BTC/USD remains structurally bullish on the 45-minute timeframe, with strong momentum following the breakout from the $75,500–$76,200 demand area. At the same time, price is now extended near major resistance, making rejection and profit-taking risks increasingly important.
Key levels:
* Resistance: $81,800–$82,200
* Near-term support: $80,800–$81,200
* Breakout support: around $78,000
* Major demand: $75,500–$76,200 Short 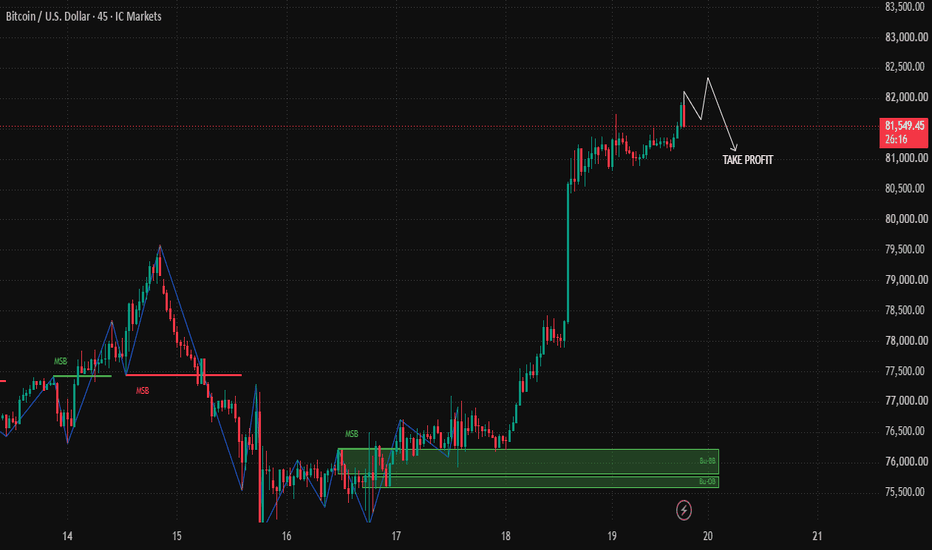
BTCUSDT: Repeat Breakout, 84.6K Target in SightBTCUSDT is trading around 80,920 USDT following a second breakout from a descending channel within its recent price structure. Notably, the price is holding firm above the EMA34 (approx. 79,440) and EMA89 (approx. 78,430), and the post-breakout upward momentum remains intact.
From a technical standpoint, if BTC maintains the 79,500–80,000 zone and establishes a "higher low," I lean towards a scenario where the price retests 82,300 before extending to the primary target zone near 84,600 USDT. The fact that the current breakout structure closely mirrors the previous rally is also a signal worth monitoring.
The macroeconomic backdrop offers mild support but is not entirely favorable. Asian stock markets are rising, driven by the technology sector, while oil prices have dipped slightly to around $103 per barrel, helping to stabilize risk sentiment.
The bullish scenario would weaken if BTC loses the 79,400 level, and particularly if it drops below 78,400.
Will BTC sustain the breakout and continue its push toward 84.6K? Long 
Long 
Bitcoin / U.S. Dollar (BTC/USD) – 45-Minute ChartMarket Structure Overview
The BTC/USD 45-minute chart shows a strong bullish recovery after price established a base around the 75,500–76,000 demand zone. The marked market-structure shift and subsequent higher highs indicate that buyers regained short-term control.
Price then accelerated sharply higher, reaching the 81,700–81,900 area before undergoing a corrective pullback. The recent decline appears corrective rather than a confirmed bearish reversal, as price has stabilized around the 80,200–80,500 region and is now attempting to recover.
Key Support and Demand
The major demand zone remains around 75,500–76,000. This area previously acted as a strong accumulation region and initiated the latest bullish expansion.
For the current structure, the 80,200–80,500 area is an important short-term support region. Holding above this zone would help preserve the sequence of higher lows and maintain the recovery structure.
Resistance and Upside Levels
The first major resistance is located around 81,500–81,800, where the previous swing high and take-profit projection are positioned.
A sustained break and close above this resistance could open the way toward the 82,000 area and potentially higher levels if bullish momentum continues.
Bullish Scenario
If BTC continues to hold above the 80,200–80,500 support region and develops another higher low, buyers could attempt another move toward 81,500–81,800.
A confirmed breakout above the previous swing high would provide stronger evidence of bullish continuation.
Bearish Risk Scenario
Failure to maintain the 80,200–80,500 support area could lead to another corrective move toward lower intraday support. A deeper breakdown would weaken the current bullish structure and increase the probability of a retest toward the 78,000–76,000 region.
Trade Structure
• Short-term bias: Bullish while price holds above key support
• Key support: 80,200–80,500
• Major demand: 75,500–76,000
• First resistance: 81,500–81,800
• Potential upside area: 82,000+
• Bullish confirmation: Break and close above the previous swing high
• Invalidation: Sustained breakdown below the current recovery structure
Overall, the chart currently reflects a bullish recovery structure with BTC attempting to resume the upward move after a corrective pullback. Confirmation above the recent high would be important before considering the next expansion leg. Long 
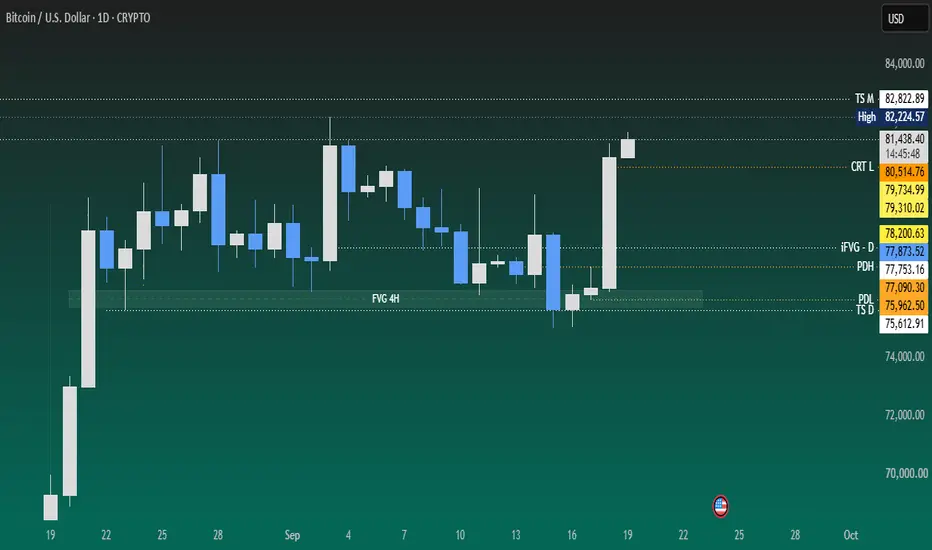
Weekly Analysi - BTCHi Friends, here is detailed weekly analysis.
Monthly
The previous month closed positive and relatively strong, with price sustaining above the monthly iFVG. The current monthly candle is also displaying strength following a downside rejection, indicating continued bullish participation. Price appears to be progressing toward the 82,822 level, which remains an important reference point.
Weekly
On the weekly timeframe, price is showing renewed strength following the previous week’s downside move. The current price structure suggests a potential move toward the recent weekly swing high, provided bullish momentum continues to sustain.
Daily
The daily structure presents a more nuanced picture. Price showed strength on Monday; however, Tuesday witnessed a sharp sell-off that swept liquidity below the recent low around the 4H FVG. Following the liquidity sweep, price entered a consolidation phase through Wednesday and Thursday.
On Friday, price expanded sharply higher, coinciding with a major news event, resulting in significant volatility and displacement.
Price is currently approaching/at a supply zone, where two scenarios become relevant: range-bound consolidation or a liquidity-driven move. A sustained breakout above the recent highs with convincing price acceptance would provide stronger confirmation of bullish continuation. Alternatively, price may first hunt nearby liquidity before establishing the next directional move.
Please do follow me if you liked the idea💡...
Disclaimer ⚠️: This analysis is for educational purposes only and does not constitute investment advice. Please do your own research (DYOR) and check with your financial advisor before making any trading decisions. 📚💰