Make Wealth through SOLUSD: Limited Risk- Highest Gain
SOLUSD Progressive Buying Strategy – Risk vs Reward
Assumption: Client buys 1 SOL at each support level as price falls. Maximum loss assumes SOL falls to $0 after purchases. Profits are cumulative based on total holdings if exited at each resistance.
• Stage 1: Buy 1 SOL at $80.23. Maximum possible loss is $80.23 if SOL falls to zero. If SOL revisits $280, profit is $199.77.
• Stage 2: Buy another 1 SOL at $37.96. Total investment becomes $118.19 for 2 SOL. Maximum loss is limited to invested capital, while profit at $280 becomes $441.81.
• Stage 3: Buy another 1 SOL at $30.42. Total investment becomes $148.61 for 3 SOL. Profit at $280 increases to $691.39.
• Stage 4: Buy the final 1 SOL at $15.33. Total investment becomes $163.94 for 4 SOL. Profit at $280 reaches $956.06, while the maximum possible loss remains the invested capital of $163.94.
This illustration demonstrates how disciplined accumulation at major support levels can improve the average acquisition cost while keeping downside risk limited to the total invested amount and significantly enhancing upside potential during a recovery.
Stage Buy at Support Total SOL Held Total Investment ($) Max Loss if SOL=$0 Exit $88.48 Exit $106.07 Exit $128.96 Exit $161.02 Exit $202.40 Exit $240 Exit $280
1 80.23 1 80.23 -80.23 +8.25 +25.84 +48.73 +80.79 +122.17 +159.77 +199.77
2 37.96 2 118.19 -118.19 +58.77 +93.95 +139.73 +203.85 +286.61 +361.81 +441.81
3 30.42 3 148.61 -148.61 +116.83 +169.60 +238.27 +334.45 +458.59 +571.39 +691.39
4 15.33 4 163.94 -163.94 +189.98 +260.34 +351.90 +480.14 +645.66 +796.06 +956.06
Crypto market
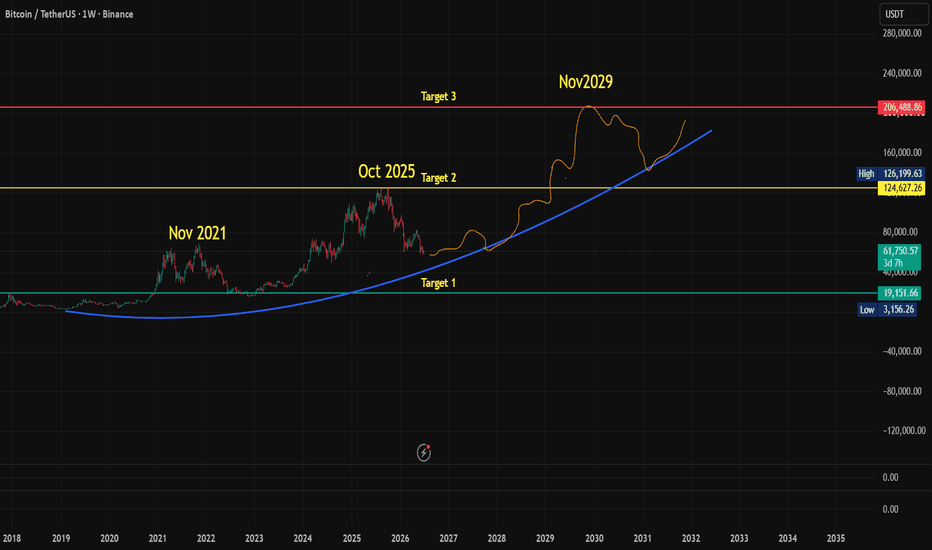
BTC WEEKLY TREND CYCLEThis analysis come in my dream so I am posting for further analysis by our analysist on trading view community, I named it as BTC TREND CYCLE HISTORICAL $ FUTURE.
Everything is possible in BULL Market and FUTURE market.
Disclaimer : Never historical data we should assume for future data.
Paper Trade and Risk Management.
Happy Learning and Trading
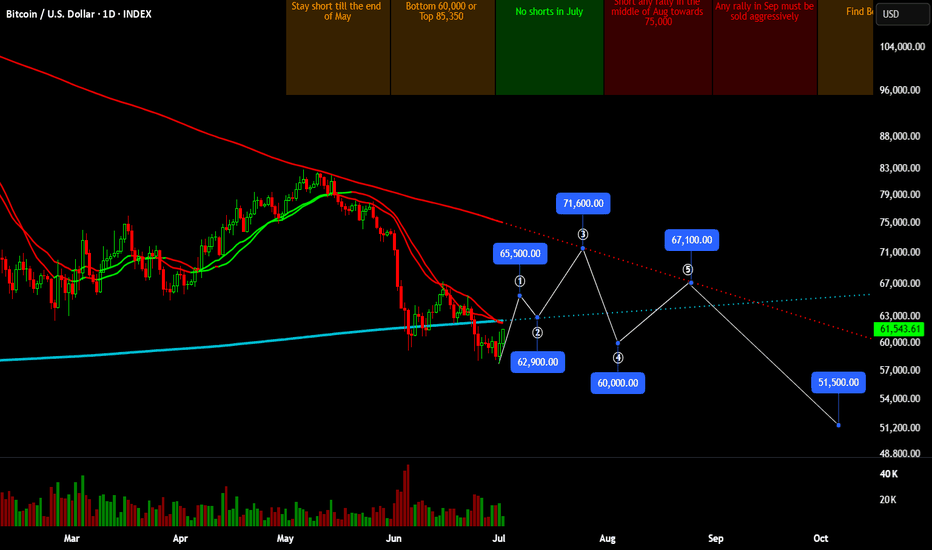
Possible Path for Bitcoin till final bottomBITSTAMP:BTCUSD recently swept the June low and rallied to 61,500. The rally is expected to extend to 65,500 till next week before bears get reactivated. However I believe the low of 57,800 will not be revisited before the final capitulation.
200 DSMA will keep acting as resistance till late August before Bitcoin would crash and form a bottom around 51,000-52,000. Remember, the Realized Price for Bitcoin is hovering around 53,000 levels and Bitcoin never bottoms before sweeping the Realized Price.
By October, we can expect the bottoming to be completed, and that will also end the bear cycle of 1 year as it has happened in 2022, 2018, and bit more in 2014.
Solana Builds Momentum as Bulls Eye the $80 BreakoutSolana continues to trade with a strong bullish structure after reclaiming the $74 area. Buyers remain in control, and the recent breakout suggests the market could challenge the psychological $80 resistance.
Although crypto sentiment remains cautious due to continued Bitcoin ETF outflows, SOL is outperforming many major altcoins from a technical perspective.
Trade Setup:
Buy Zone: $75.50 – $76.50
Stop Loss: $73.50
Take Profit 1: $80.00
Take Profit 2: $84.00
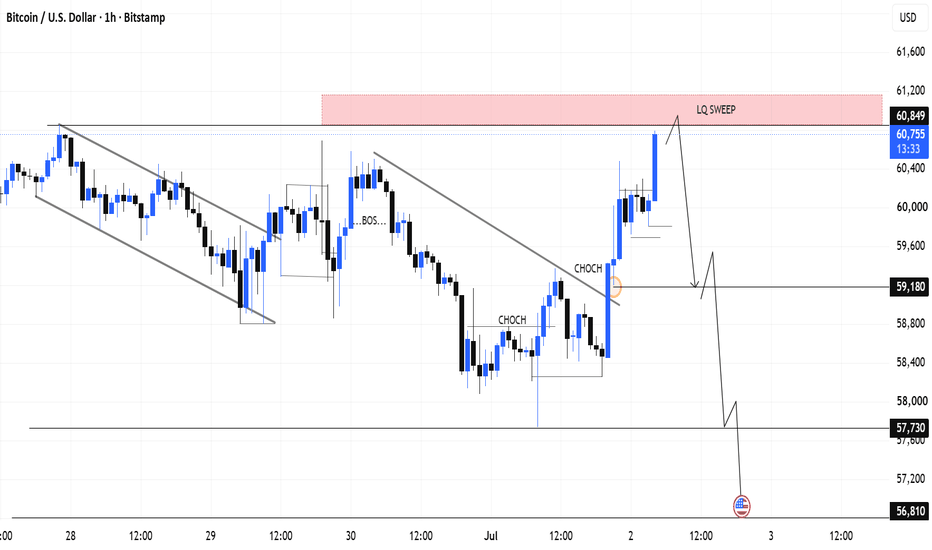
Market Structure & Liquidity Sweep BTCUSD📊 Market Structure & Liquidity Sweep:
Bitcoin (BTCUSD) on the 1H timeframe has delivered a highly significant structural development. The price action recently expanded upward to execute a clean liquidity sweep 🏹 (LQ SWEEP) into the premium resistance/supply matrix, trapping premature breakout buyers before showing immediate signs of slowing down 📉.
🔍 SMC Technical Confluences:
🎯 Liquidity Hunt: The recent aggressive spike effectively cleared out buy-side liquidity resting above the previous highs, mitigating institutional orders in the overhead supply zone.
🔄 Order Flow Shift: Despite previous bullish internal CHoCH signs, the macro structure remains heavily reactive at these premium levels, indicating that institutional sellers 🐻 are actively defending this zone.
📍 Downside Targets: Below the current market price, multiple internal liquidity pools and clean lows remain exposed near 59,180 and 57,730, which are highly anticipated to act as downside magnets 🧲 for price.
⚡ Execution & Confirmation Strategy:
We are closely tracking 🕵️♂️ the lower timeframes for a confirmed shift in character or an impulsive bearish candle closure to validate a reversal setup. If the market maintains its bearish rejection from this current sweep zone, a downward expansion 🌊 toward the lower targets is expected.
⚖️ Risk Disclaimer:
This technical analysis is strictly based on institutional order flow probabilities and market structure confluences for educational purposes. Always use proper risk management 🛡️.
$DOT May Be Forming The Same Structure That Led To A 50x RallyMIL:DOT May Be Forming The Same Structure That Led To A 50x Rally
#DOT Is Currently Trading Below Bearish Breakdown Level. A High Risk Accumulation Zone Following A ~99% Macro Correction From Its ATH, Positioning Price At A Critical Accumulation vs Invalidation Level.
Technical Structure
✅ Previous Cycle ATH: $55+ (Macro High)
✅ Macro Correction: -99% From ATH Into Current Accumulation Range
✅ Multi-Year Descending Channel Compression Near HTF Demand
✅ HTF Accumulation Zone: $0.80 - $0.50
✅ Consistent Lower Highs And Lower Lows Since 2021 Cycle Top
✅ Breakdown Below Key Horizontal Support At $3.2 Confirmed Bearish Structure Shift
✅ Weak Consolidation Near Lows With No Bullish Structure Break Yet
✅ Bullish Structure Valid Only On Reclaim And Hold Above $1.44
✅ Risk Invalidation: Weekly Close Below $0.50
Cycle Context
➡️ 2020-2021 Expansion: Massive Rally To $55+ ATH
➡️ 2022-2026: -99% Corrective Accumulation Phase
➡️ Dynamic Trendline Resistance Rejecting Price At Every Retest
Key Levels
👉 HTF Demand: $0.80 - $0.50 (High Risk Accumulation Zone)
👉 Breakdown Confirmation: Weekly Close Below $0.50
👉 Trend Reclaim: $1.44 (Descending Channel Breakout Confirmation)
Bull Cycle Targets $2/$5/$10/$20
Invalidation: Weekly Close Below $0.50
The $0.80–$0.50 Region Represents A High-Risk HTF Accumulation Zone For DOT/USDT Ahead Of A Potential Long-Term Expansion Phase.
TA Only. Not Financial Advice. Manage Risk.
Rejection at Resistance Hints at Further DownsideBitcoin is showing signs of weakness after rejecting a key intraday resistance zone on the 1-hour timeframe. Price failed to sustain above the Ichimoku cloud and sellers quickly regained control, suggesting the recent recovery may only have been a corrective bounce within a broader bearish structure.
The highlighted 59,700–59,950 resistance area remains the first obstacle for bulls. As long as BTC stays below this zone, bearish momentum is likely to remain intact. A stronger supply zone is located around 60,500–60,900, where previous swing highs and heavy selling pressure make it a major resistance level.
The current price action indicates a possible continuation lower after the rejection. If sellers maintain control, Bitcoin could first decline toward Target 1 at 58,895, which aligns with recent support. A confirmed break below this level may accelerate the sell-off toward Target 2 at 58,325, where buyers could attempt another defense.
A bullish scenario would require price to reclaim and hold above the first resistance zone. Until then, rallies into resistance may continue to attract sellers.
Key Levels
Resistance: 59,700–59,950
Major Resistance: 60,500–60,900
Target 1: 58,895
Target 2: 58,325
Conclusion:
The overall short-term bias remains bearish while BTC trades below resistance. Traders should watch for bearish confirmation around the highlighted supply zones, with downside targets remaining in focus unless buyers reclaim the resistance levels.
ETHUSDT Sellers Keep Control Below $1,600Ethereum is still struggling below the $1,590–1,600 resistance zone. Every recovery attempt is being absorbed, which shows that sellers remain active and buyers are not strong enough yet.
Unless ETH reclaims this resistance, the bearish continuation setup remains valid.
Trade Setup:
Sell Zone: $1,590 – $1,600
Stop Loss: $1,630
Take Profit 1: $1,550
Take Profit 2: $1,500
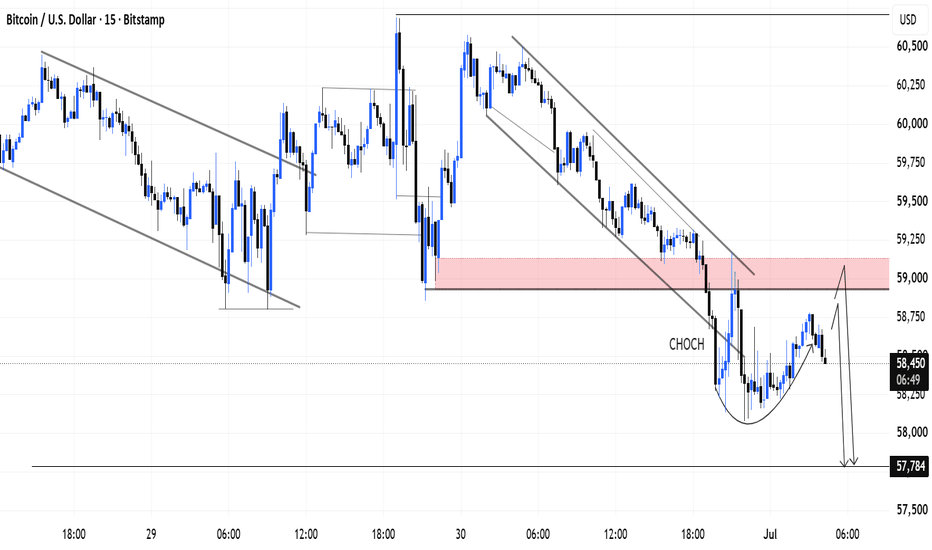
BTCUSD ANALUSIS 🔍 BTCUSD | 15M SMC Analysis
Price has printed a clear CHOCH after breaking the intraday bearish channel, suggesting a potential short-term shift in order flow. 📊
The current recovery is approaching a key supply zone, where I'll be watching for bearish confirmation before considering continuation toward the next liquidity area. 🎯
As always, patience and confirmation remain key. This is my personal technical view based on SMC concepts, not financial advice. ⚡
💬 Share your view below.
#BTCUSD #Bitcoin #SMC #PriceAction #Crypto #TradingView #TechnicalAnalysis
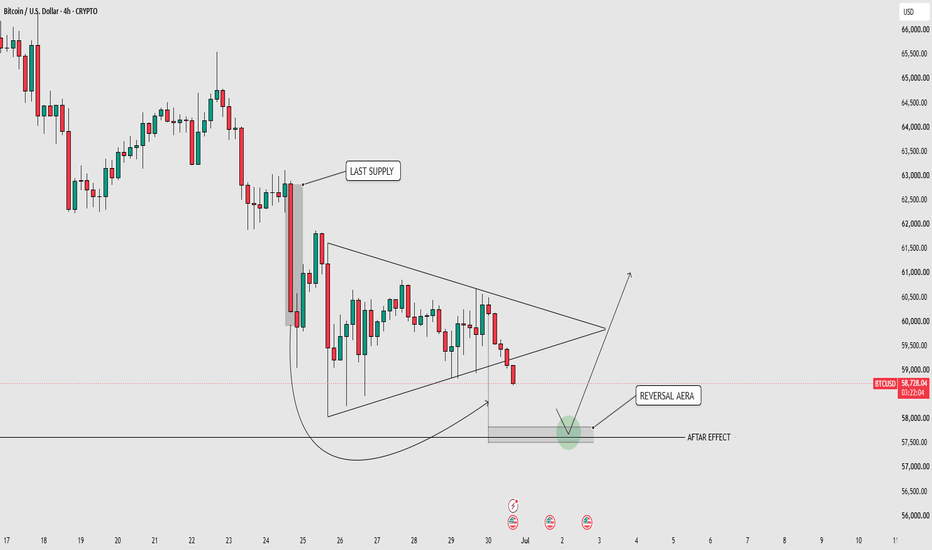
BTCUSD 4H AnalysisThe market has been rotating inside the same range for almost a week, and during this period it has developed a Pennant-type structure. In my view, the first breakout may not be the real move. Instead, I’m expecting an FMFR (First Move Fake Then Reverse) scenario before the actual trend begins.
To understand the structure, I copied the last major supply zone because it was the final supply area before the market entered a long sideways phase. After measuring the previous supply and demand movement, I identified a high-probability reversal zone where price has reacted in the past.
If the market gives a fake breakdown into the reversal zone, sweeps liquidity, and fails below the After Effect line, I will look for a strong Bullish Engulfing, Positive CCP, or any strong bullish confirmation candle. That would be my signal that the fake move has completed and the real bullish move may begin.
There are multiple reasons supporting this idea:
FMFR (First Move Fake Then Reverse) structure.
. The market is approaching a major bottom area, where fake-outs are common.
. Previous supply and demand measurements point to the same reversal zone.
. A liquidity sweep would help fill the remaining lows before the market reverses.
. Historical price action shows bullish reactions from similar zones.
For now, I’m waiting for confirmation inside the reversal zone rather than entering early. If the market confirms with a strong bullish candle after the fake breakdown, it can start a meaningful move to the upside.
Note: This analysis is based on the MMC Concept by Candle King.
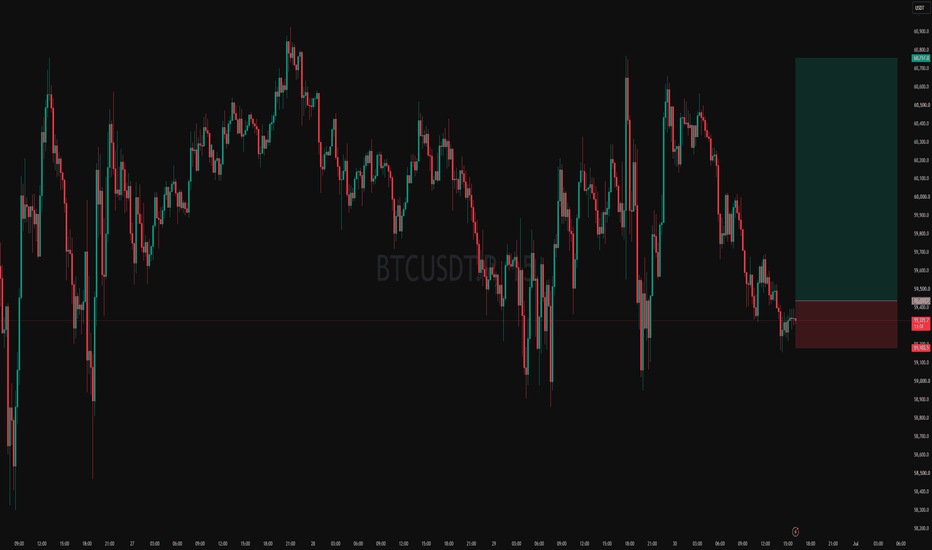
Intraday Long Setup | June 30th 2026 | Valid Until Daily ClosePrice has retraced to a strong pivot zone.
Structure remains bearish but with potential for reversal after pullback.
Tight risk control.
Watch for price reaction within the red zone. Entry only if confirmation appears
The setup expires at end of the daily candle close.
Bitcoin chart analysis JUNE 29Hello
It's a Bitcoin Guide.
My analysis is optimized for TradingView.
If you press the Replay button, you can check real-time movements.
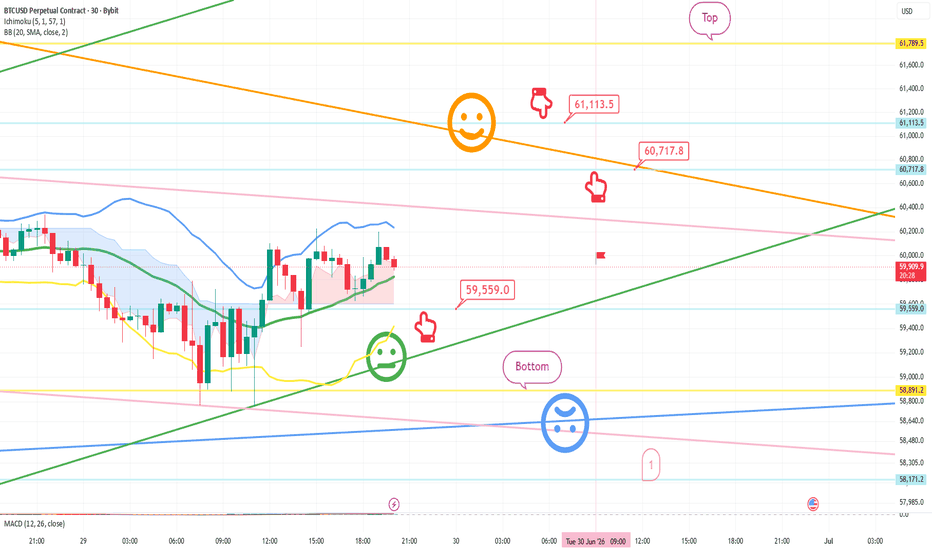
This is the Bitcoin 30-minute chart.
Currently, a MACD Golden Cross is in progress on the 12-hour and daily charts.
(Although not visible on the screen,
I have entered a long position at $58,032.3 in the bottom left corner and am currently maintaining it.
Please check if it breaks the light blue support line.)
*Long Position Strategy (Following the red finger movement path)
1) $59,559 Long Position Entry Zone / Stop Loss if Green Support Line is broken
2) $61,113.5 Long Position 1st Target -> $60,717.8 Long Position Re-entry Zone
3) Top Zone Final Target Price
From the point where the green support line is broken,
the Bottom zone is open up to Zone 1 at the bottom.
If the light blue support line is broken today,
the $58,032.3 long position entry zone entered on the 25th will be
processed as a stop loss.
Please use my analysis post only for reference and practical application.
I hope you operate safely by strictly adhering to trading principles and stop loss rules.
thank you.
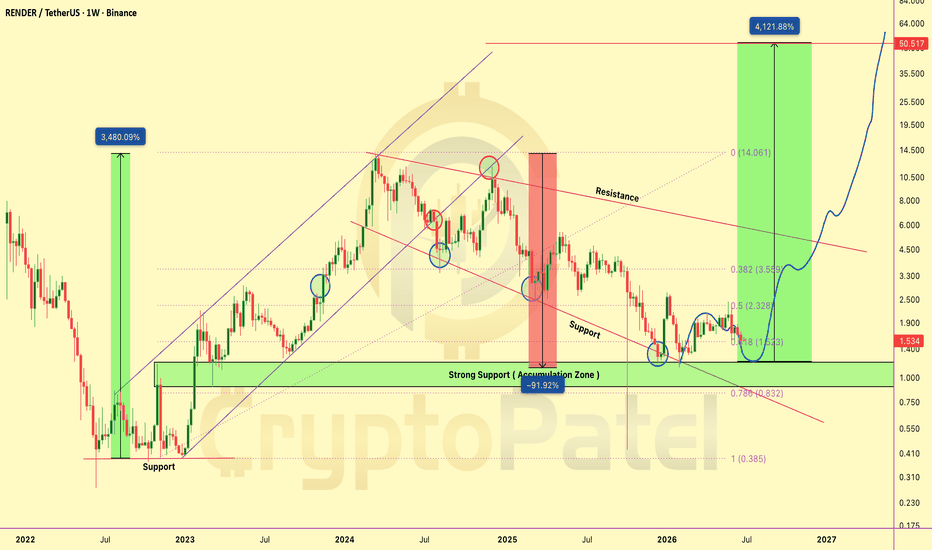
Why $RENDER Could 25x To $50 This Cycle Down 92% While Fundamentals Hit ALL-TIME HIGHS: Why CRYPTOCAP:RENDER Could 25x To $50 This Cycle 🚀
#RENDER Is Currently Positioned Within A HTF Bullish OB After Experiencing ~92% Macro Drawdown From Its ATH, Placing Price At A Key Accumulation vs Breakdown Zone.
Technical Structure
✅ Prior Cycle ATH: $13.83 (Macro Top)
✅ Macro Pullback: −92% From ATH Into Present Accumulation Area
✅ Multi-Year Descending Channel Compression Near HTF Demand
✅ HTF Bullish OB: $1.20–$0.80
✅ 0.786 Fibonacci Level: $0.83 (Optimal Accumulation Zone)
✅ Potential Liquidity Grab Below $1 Before Expansion
✅ Bullish Bias Holds While $0.83 Sustains On HTF Closing Basis
✅ Invalidation (Aggressive): HTF Close Below $0.83
Cycle Context
➡️ 2022–2023 Rally: +5,000% Move From $0.274 → $13.83
➡️ 2024–2026 Phase: −92% Corrective Accumulation Range
Key Levels
👉 Primary HTF Demand: $1.20–$0.80
👉 Secondary Support Zone: $0.60–$0.40 (If $0.80 Breaks)
👉 Trend Confirmation: $2.71 (Breakout From Descending Channel)
Bull Cycle Targets: $2.70 → $5.50 → $13.00 → $28+
Invalidation: Weekly Close Below $0.80
The $1.20–$0.80 Range Continues To Act As A Major HTF Accumulation Zone For RENDER/USDT Ahead Of A Potential Next Expansion Leg.
TA Only. Not Financial Advice. Manage Risk.
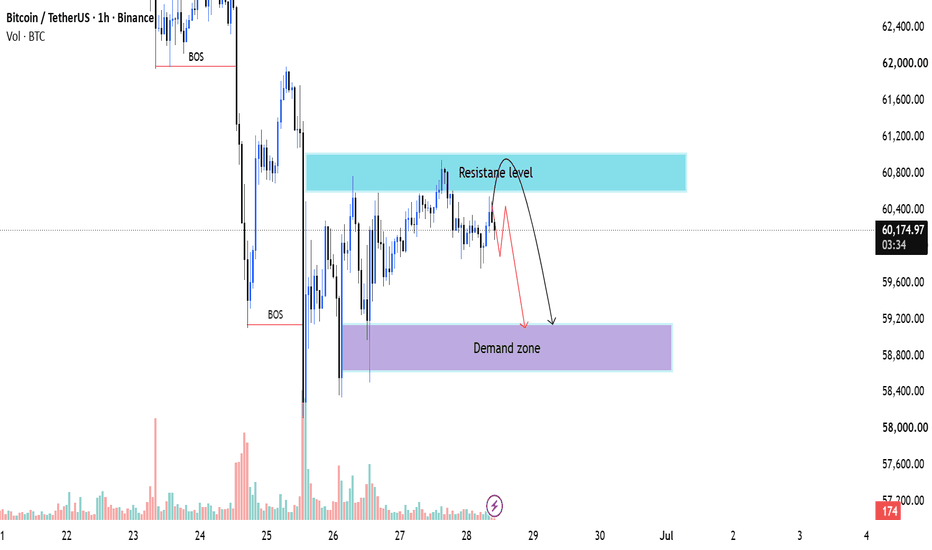
Bearish Rejection Could Trigger a Drop Toward Demand ZoneBTCUSDT is currently trading below a significant resistance zone around 60,600–60,900, where sellers have repeatedly defended price. The market structure remains cautious as price struggles to establish a higher high after the recent recovery.
The highlighted resistance area aligns with previous supply, making it a key level to watch for bearish confirmation.
Bearish Scenario
If Bitcoin fails to break and close above the resistance zone, a rejection could lead to a fresh bearish move. A lower high formation followed by bearish momentum may push price toward the highlighted demand zone around 58,900–59,200.
This demand area represents the next major support where buyers could attempt to regain control.
Key Levels
Resistance: 60,600 – 60,900
Current Price: ~60,140
Target (Demand Zone): 58,900 – 59,200
Trading Plan
Wait for bearish confirmation (rejection candle or lower high) inside the resistance zone.
Conservative traders may wait for a break below the recent swing low before entering.
The demand zone can be monitored for potential profit-taking or a possible bullish reaction.
Conclusion
BTC remains trapped below a strong resistance area. Unless buyers reclaim the highlighted supply zone with a convincing breakout, the probability favors a move lower toward the demand zone. Risk management is essential, as a breakout above resistance would invalidate the bearish outlook.
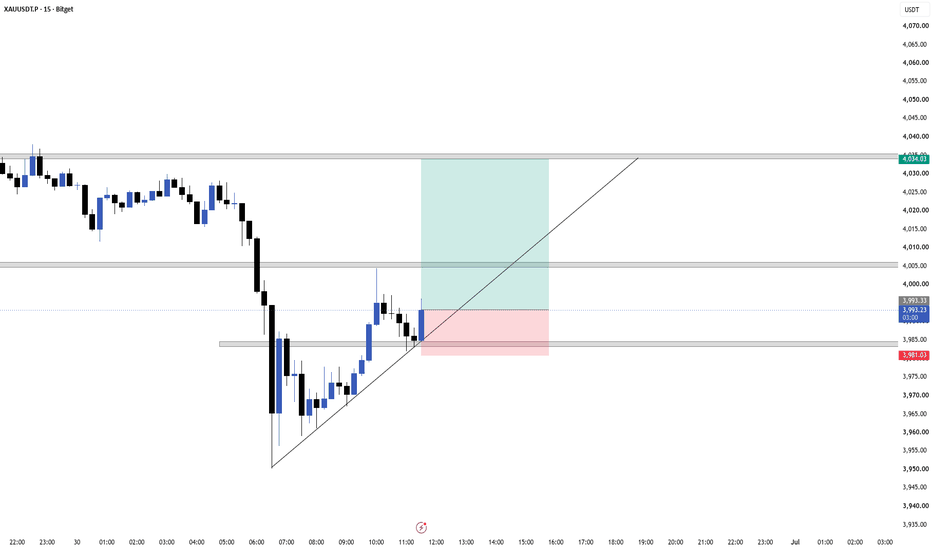
XAUUSDT | 15M Long SetupGold is respecting the ascending trendline after a strong rejection from the recent lows.
Trade Idea:
🟢 Entry: Around 3993
🔴 Stop Loss: Below 3981
🎯 Target: 4034 (Major resistance)
Why I'm bullish:
✅ Price is holding above the ascending trendline.
✅ Support zone is being respected.
✅ Risk-to-reward is approximately 1:3.
✅ Looking for a continuation move toward the next resistance.
Invalidation:
A 15-minute candle closing below the support zone and trendline would invalidate this setup.
Plan:
Patience is key. Waiting for buyers to defend the support before expecting a move toward 4034.
This is my personal analysis, not financial advice.
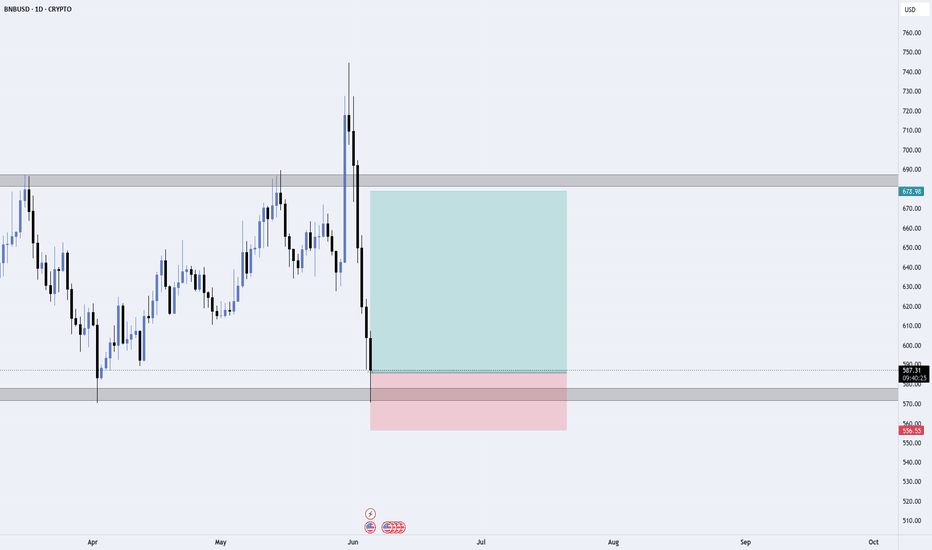
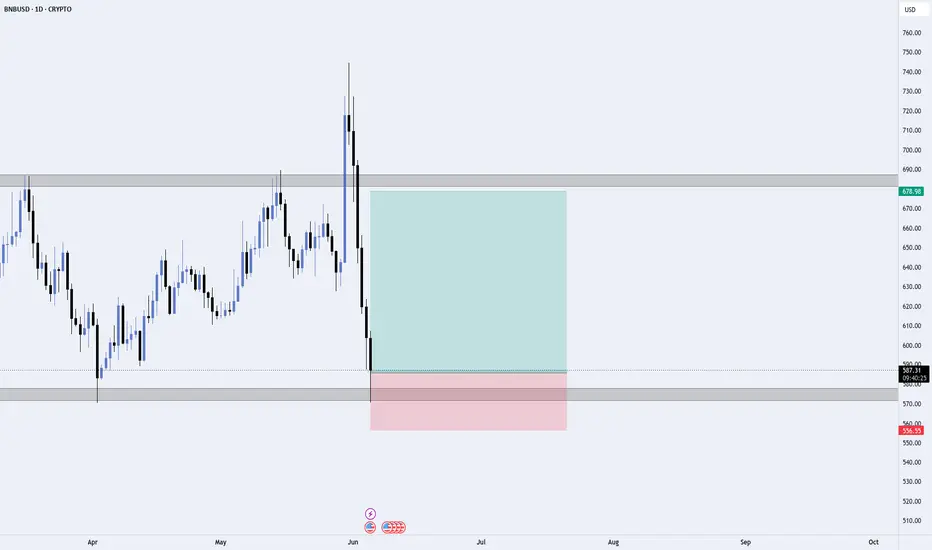
BNBUSD | Daily TimeframeBNB has experienced an aggressive sell-off into a major higher-timeframe demand zone around the $575-$580 region.
My thesis is based on a potential bullish reaction from this key support area:
• Price has reached a previously respected demand zone.
• The current move appears overextended after a strong bearish impulse.
• Risk-to-reward remains attractive with clearly defined invalidation below support.
• A successful defense of this zone could trigger a recovery toward the $675-$680 resistance area.
Trade Idea:
Entry: Current demand zone
Stop Loss: Below $556
Target: $678
This is a reaction-to-support setup, not a prediction. I will be monitoring price action confirmation before adding conviction.
Always manage risk and wait for confirmation.
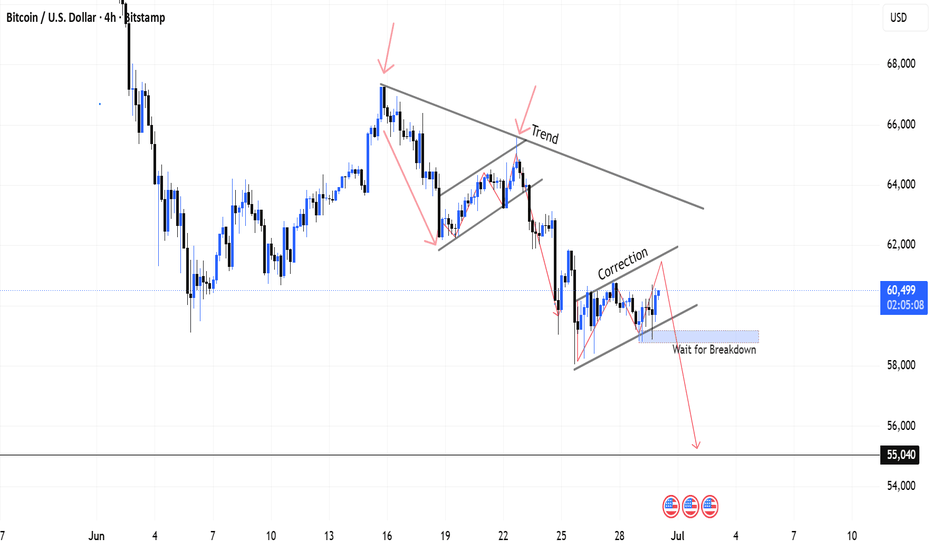
BTCUSD: Structural compression near critical trendline support 📊 Market Structure & Bias Overview:
The macro order flow on BTCUSD remains heavily bound within a dominant bearish regime, respected by the primary descending trendline channel. After undergoing a clear multi-day corrective phase (Ascending Correction), the price action is now demonstrating exhaustion as it compresses tightly against the lower counter-trendline support.
🔍 Technical Confluences & Price Action:
* Trendline Matrix: Price is currently sandwiched between the major overhead resistance trendline and the immediate diagonal support.
* Volatility Compression: The narrowing range indicates that the market is building up order volume, typically leading to a high-probability expansion move.
* Structural Shift: Consecutive lower highs on the lower timeframes indicate that sellers are maintaining control and preventing any bullish structural shifts.
⚡ Execution & Confirmation Strategy:
We are strictly monitoring the market for a clean, impulsive breakdown below this immediate counter-trendline support zone. To avoid fakeouts, it is highly recommended to wait for a sustained candle closure below the support level, followed by a valid retest/mitigation sequence.
🎯 Potential Target Zone:
If the structural breakdown is validated with proper bearish confirmation, the next logical magnet for price expansion will be the lower liquidity pools and demand matrix sitting around the 55,040 level.
⚖️ Risk Disclaimer:
This breakdown analysis is based entirely on structural probabilities and technical alignment for educational purposes. Always utilize strict risk management rules.
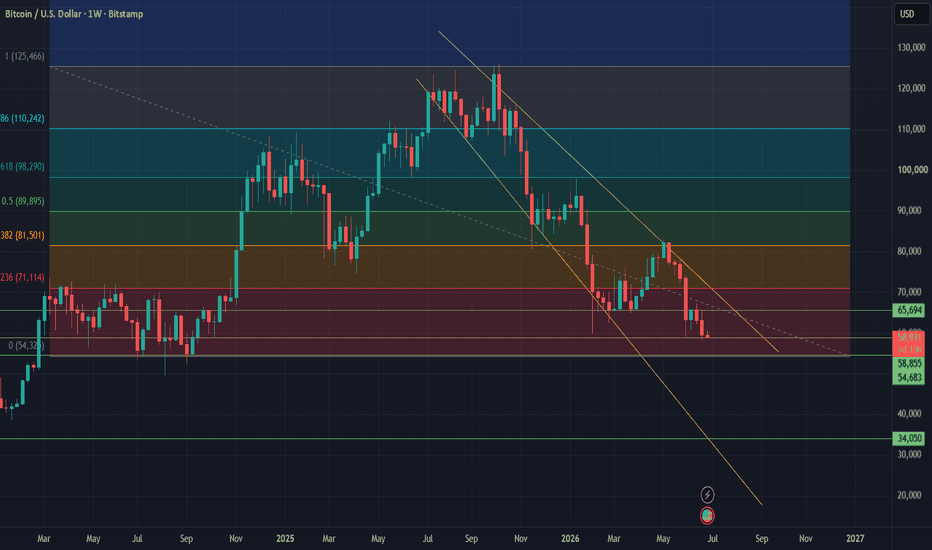
Multi Time Frame Analysis BTCBTCUSD — multi-timeframe:
BTC is trading near $59,200, about 52% below the October 2025 cycle high of $124,500. Price has been inside a descending channel since the top, and is currently testing the lower rail of that channel right where it lines up with the 1.0 Fibonacci retracement of the entire 2025 rally (~$57,000) and a horizontal demand shelf at 58,855. This confluence of channel support, fib level, and prior structure makes the current zone the key area to watch across all timeframes below.
4 Hour scenario:
Price is consolidating inside a descending channel (yellow trendlines). BTC is sitting near $59,200, just above the lower channel support. The 65,694 horizontal level is acting as resistance above. Price action is compressing toward the lower rail, indicating a potential breakdown or reaction bounce soon.
1 Day scenario:
BTC is struggling at the lower boundary of the daily descending channel that has been intact since the October top. The bearish structure remains unless BTC closes above $65,694. Momentum is slowing into support; the 58,855 horizontal is the immediate floor for bulls.
1 Month scenario:
Holding above $57,000 (the 1.0 Fibonacci retracement of the 2025 cycle, also the channel floor) keeps bullish reversal potential alive. If it breaks below $57,000, expect a deeper move toward the $50,000–$45,000 zone.
Disclaimer: The analysis and price levels above are for informational purposes only and do not constitute financial, investment, trading, or legal advice. They are general market commentary based on the chart structure shown and should not be treated as a recommendation to buy, sell, or hold any cryptocurrency or financial instrument.
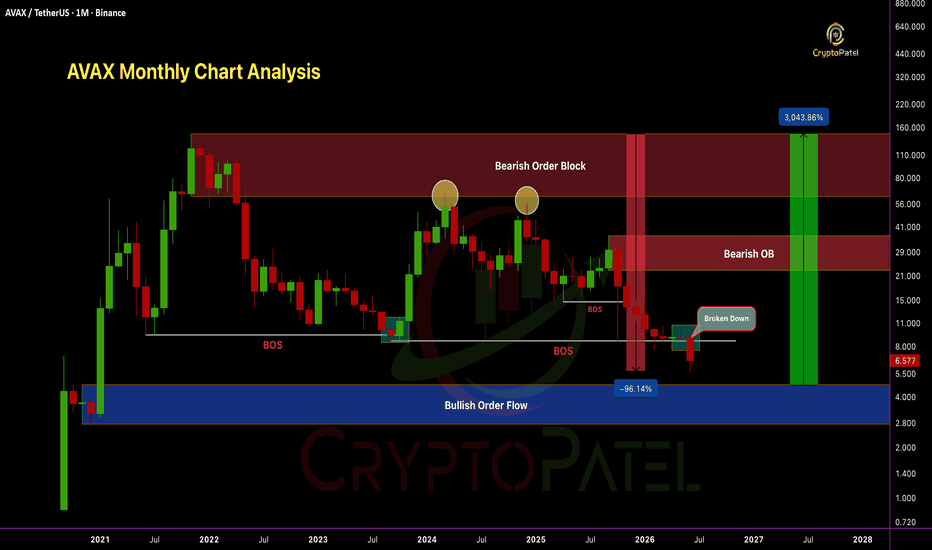
$AVAX May Be Forming The Same Structure That Led To A 30x Rally?BSE:AVAX May Be Forming The Same Structure That Led To A 3,000% Rally 🚀
#AVAX Is Currently Trading Below A Confirmed Bearish Breakdown Level. A High-Risk Accumulation Phase Following A ~96% Macro Correction From Its ATH, Positioning Price At A Critical Accumulation vs Invalidation Level.
Technical Structure
✅ Previous Cycle ATH: $147 (Macro High)
✅ Macro Correction: -96% From ATH Into Current Accumulation Range
✅ Multi-Year Bearish Order Flow Compression Near HTF Demand
✅ HTF Accumulation Zone: $4.70 - $2.75 (Monthly Bullish Order Flow Base)
✅ Consistent Lower Highs And Lower Lows Since 2021 Cycle Top
✅ Monthly Break Of Structure Below Key Support At $8.50 Confirmed Bearish Shift
✅ $8.50 Strong Support Now Flipped Into Strong Resistance
✅ Weak Consolidation At Lows With No Bullish Structure Break Yet
✅ Bullish Structure Valid Only On Reclaim And Hold Above $8.50
Why This Is A Bullish Accumulation Zone
👉 As Per SMC Analysis We Can See Strong Bullish Order Flow At The $4.70 - $2.75 Level. I Am Expecting A Strong Bounce From Here, So This Could Be The Best Accumulation Zone For High Reward And Very Less Risk.
Current Bias
👉 Now That Price Has Broken Down The $8.50 Strong Support And Flipped It Into Strong Resistance, I Am A Bit More Bearish Toward Our Accumulation Zone. But If You Want To Take High Risk, You Can Start Slowly Accumulating Until Price Reaches Our Accumulation Zone.
Cycle Context
➡️ 2020-2021 Expansion: Massive Rally From $1 To $147 ATH
➡️ 2022-2026: -96% Corrective Bearish Order Flow Phase
➡️ Unmitigated Bearish Order Blocks Rejecting Price At Every HTF Retest
Key Levels
👉 HTF Demand: $4.70 - $2.75 (High Risk Accumulation Zone)
👉 Breakdown Confirmation: Price Holding Below $8.50 Resistance
👉 Trend Reclaim: $8.50 (Broken Structure Recovery Confirmation)
Bull Cycle Targets $10 | $30 | $70 | $100
Invalidation: HTF Close Below $2.70 (Risk Is High But Reward Very High If Targets Hit)
The $4.70–$2.75 Region Represents A High-Risk HTF Accumulation Zone For AVAX/USDT Ahead Of A Potential Long-Term Expansion Phase.
TA Only. Not Financial Advice. Manage Risk.
Bitcoin chart analysis JUNE 26Hello
It's a Bitcoin Guide.
My analysis is optimized for TradingView.
If you press the Replay button, you can check real-time movements.
This is the Bitcoin 30-minute chart.
In the bottom left, marked with a purple finger, I have connected the strategy exactly at the entry point of the long position I entered on June 25th, which is $58,032.3.
I have provided the key plot points and prices.
*For those currently holding a long position:
1) Please pay attention to the purple parallel lines and the green parallel line support lines.
2) A vertical rise is expected if the rebound is successful after touching the marked zone 1.
A strong rise is expected if the rebound is successful after touching zone 2.
3) Since the price is open to the final bottom zone of $56,859.1 from the point of breaking the light blue support line, please check the parallel line support lines.
4) Currently, a MACD dead cross is in progress on the daily chart.
Even if it only consolidates without breaking the light blue support line,
it could rise again after tomorrow.
If the signal is ignored, it needs to touch the Top zone very strongly and rise above a "Great" level during the weekend.
5) I have left a rough movement path with the pink finger,
so I suggest you manage your position by utilizing the prices on the right.
Please use my analysis post merely as a reference and for practical use.
I hope you operate safely by adhering to trading principles and mandatory stop-losses.
Thank you for your hard work this week.
Thank you.