TSLA Daily Bearish Continuation OutlookAs highlighted in my previous analysis, Tesla was expected to experience only a temporary bullish retracement, while the broader market structure remained bearish. The recent rebound toward the $415 level appears to have completed that corrective move, with price now resuming its primary bearish trajectory.
From a technical perspective, the downside targets remain unchanged, with the first target positioned at $356 and the second target at $322, as highlighted on the chart.
From a fundamental standpoint, Tesla continues to face mixed sentiment in the market. While the company is aggressively expanding its AI and autonomous driving initiatives, including the rollout of its Robotaxi service in Austin and increased investment in Full Self-Driving (FSD) technology, investors remain concerned about execution risks and growing competition in the autonomous vehicle space. Tesla's Robotaxi expansion has been slower than many expected, and competition from companies such as Waymo continues to intensify.
On the positive side, Tesla has recently reported improving vehicle sales in Europe, supported by stronger EV demand and progress toward broader FSD approvals across the region. However, the market is still closely monitoring whether Tesla can successfully deliver on its long-term AI and autonomous driving ambitions.
Overall, despite short-term bullish corrections, the higher timeframe structure continues to favor a bearish outlook unless price can reclaim and sustain levels above key resistance zones.  Short
Short
The Hidden Logic Behind Stop HuntsMany traders believe stop hunts are designed to target retail traders personally. After getting stopped out, they often watch the market reverse in the direction they originally expected, making it feel as though the market was hunting their position. While this can be frustrating, the reality is usually more about liquidity than manipulation.
Large institutions need enough buying and selling interest to execute their positions efficiently. Areas where many traders place stop-losses naturally become pools of liquidity, making them attractive locations for large market participants. Understanding this concept can completely change the way you view market movements.
1. What Is a Stop Hunt?
A stop hunt occurs when price briefly moves beyond an important high, low, support, or resistance level before reversing. These moves often trigger clusters of stop-loss orders placed by traders around obvious technical levels.
This doesn't necessarily mean the market is targeting individual traders. Instead, these areas contain a large number of pending orders that provide the liquidity needed for larger participants to execute their trades.
2. Why Liquidity Matters
Every buyer needs a seller, and every seller needs a buyer. Institutions trading large positions cannot simply enter the market whenever they want because their orders require enough liquidity on the opposite side.
Stop-loss clusters provide that liquidity. Once enough orders are triggered, institutions can complete larger transactions more efficiently, which is why price often reacts strongly after sweeping these areas.
3. Where Stop Hunts Usually Occur
Liquidity tends to build around previous swing highs, swing lows, trendline breaks, support, resistance, equal highs, equal lows, and psychological price levels. Since many traders learn similar technical concepts, they often place their stop-losses in these same locations.
When price reaches these zones, volatility usually increases as pending orders and stop-losses are activated. Recognizing these areas can help traders avoid entering at the worst possible moment.
4. Don't Rush Into Every Breakout
Many traders see price breaking resistance or support and immediately assume a new trend has begun. This fear of missing out often leads to entering trades just as liquidity is being collected.
Waiting for confirmation after the breakout can improve decision-making. A genuine breakout usually holds above or below the level instead of reversing immediately.
5. Think Beyond the Candle
A single candle rarely tells the whole story. Strong moves above resistance or below support should always be viewed within the context of market structure, trend, volume, and nearby liquidity zones.
Looking at the bigger picture helps traders distinguish between a true breakout and a temporary liquidity sweep, reducing emotional decisions.
6. Avoid Placing Obvious Stop-Losses
Many traders place their stop-losses exactly above swing highs or below swing lows because they seem like logical locations. The problem is that thousands of other traders often do the same thing.
Rather than using identical stop placements every time, consider market structure, volatility, and position size. A well-planned stop should protect your trade without sitting in the most obvious liquidity zone.
7. Patience Beats Prediction
Trying to predict every stop hunt is nearly impossible. Markets are dynamic, and no trader can know exactly when liquidity will be taken or when a breakout will continue.
Instead of predicting, focus on waiting for confirmation. Allowing price to reveal its intentions before entering often leads to higher-quality trades and fewer emotional mistakes.
Conclusion
Stop hunts are not about targeting individual traders—they are a natural consequence of how financial markets find liquidity. Once you understand why price moves beyond obvious levels, you'll begin to see these events as part of normal market behavior rather than unfair manipulation.
The best defense against stop hunts is not avoiding the market but improving your understanding of liquidity, market structure, and risk management. When you stop reacting emotionally and start thinking in terms of order flow, you'll make more confident and disciplined trading decisions.  Education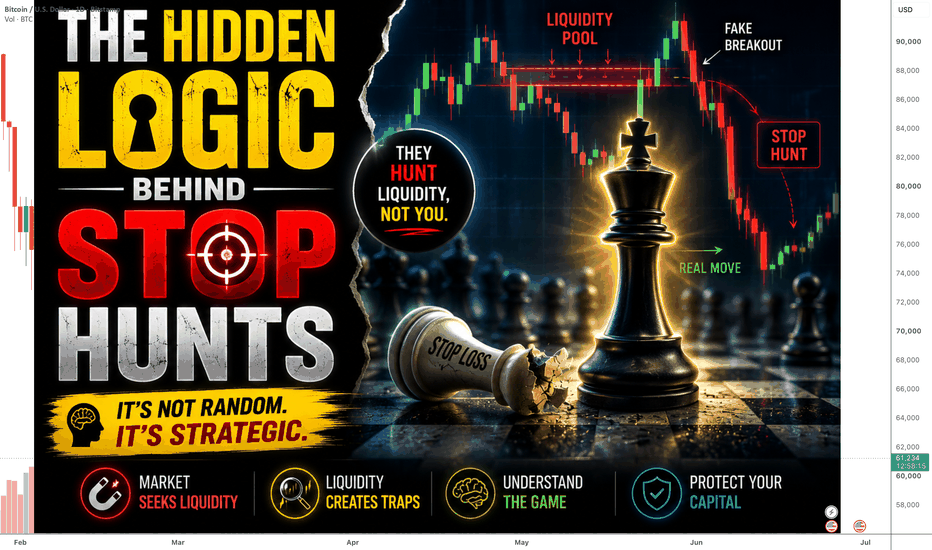
Long 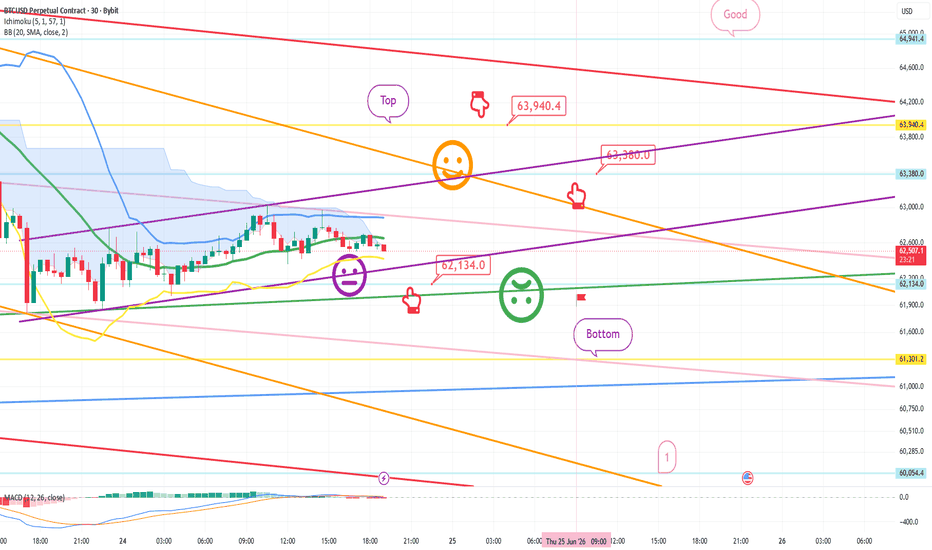
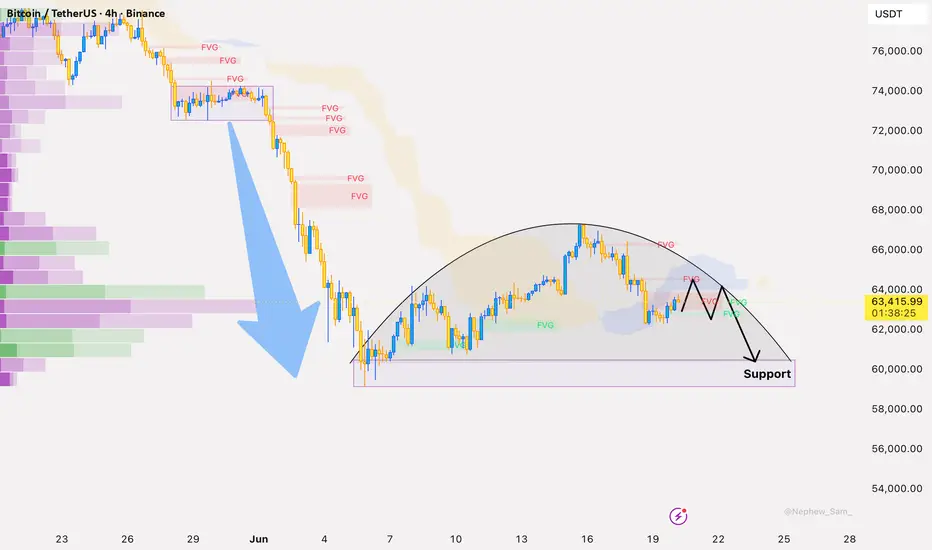
BTCUSDT Bounce Faces Heavy Supply Near $65KBitcoin has bounced back toward $63.5K, but the recovery still looks vulnerable. After the sharp fall from above $74K to the $59K–60K zone, the current move appears more like a resistance retest than a confirmed bullish reversal.
ETF inflows helped the earlier rebound, but crypto sentiment is still not strong enough. With the US Dollar supported by Fed expectations, risk assets may continue to face pressure.
Trade Setup:
Sell Zone: $64,000 – $65,000
Stop Loss: $66,200
Take Profit 1: $62,300
Take Profit 2: $60,800
Take Profit 3: $60,000 Short 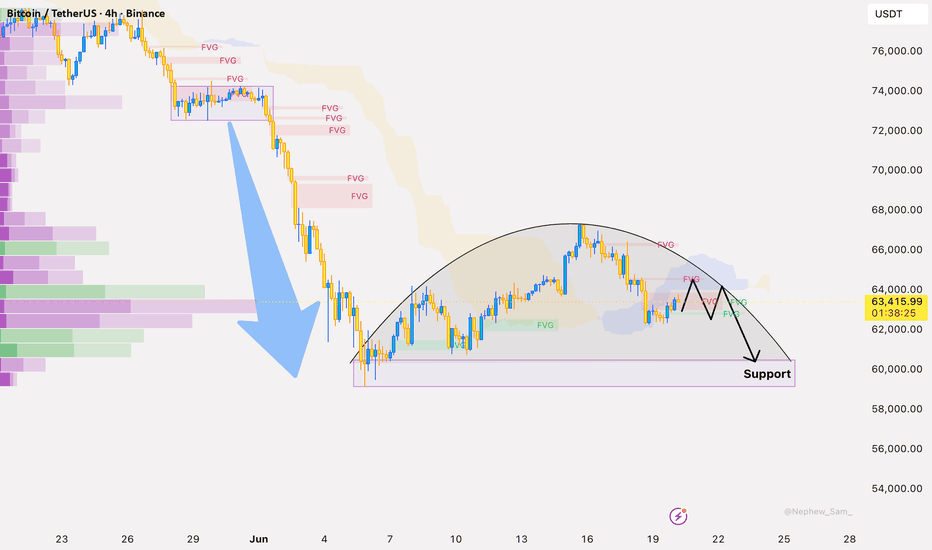
Short 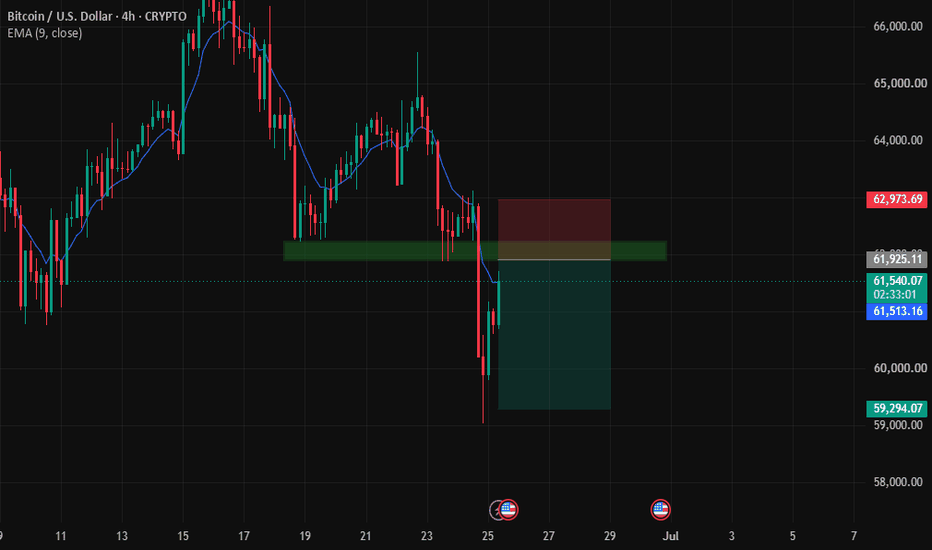
BTC/USDT — Daily & 4H Continuation SetupBTC continues to maintain bullish market structure after reclaiming the mid-range consolidation zone and establishing acceptance above previous resistance. Higher lows continue to form across the 4H timeframe while the daily chart shows ongoing strength following the broader recovery from the 60k region.
Price is currently compressing beneath a major liquidity area near previous highs, suggesting the possibility of another expansion phase if current support continues holding.
📍 Entry Zone:
80,500 – 82,000
🛑 Stop Loss:
74,000 – 75,000
🎯 Targets:
• T1: 88,000 – 90,000
• T2: 94,000 – 96,000
📊 Potential Profit:
• T1: ~8–10%
• T2: ~15–18%
⚖️ Estimated Risk-to-Reward:
Approx. 1:1.5 to 1:3 depending on entries and position management.
The 4H structure continues to show sustained strength with buyers defending pullbacks instead of allowing deep retracements. At the same time, the daily timeframe is approaching a major higher timeframe liquidity zone near previous highs, making this an important region for potential expansion or reaction.
A clean hold above the 78k support region would continue favoring bullish continuation toward the upper supply zones. However, volatility around major psychological levels should still be expected.
Conservative traders may prefer waiting for consolidation or retests before entering after impulsive moves.
Independent opinion based on price action and market structure analysis.
NOT financial advice. Always manage risk properly. Long 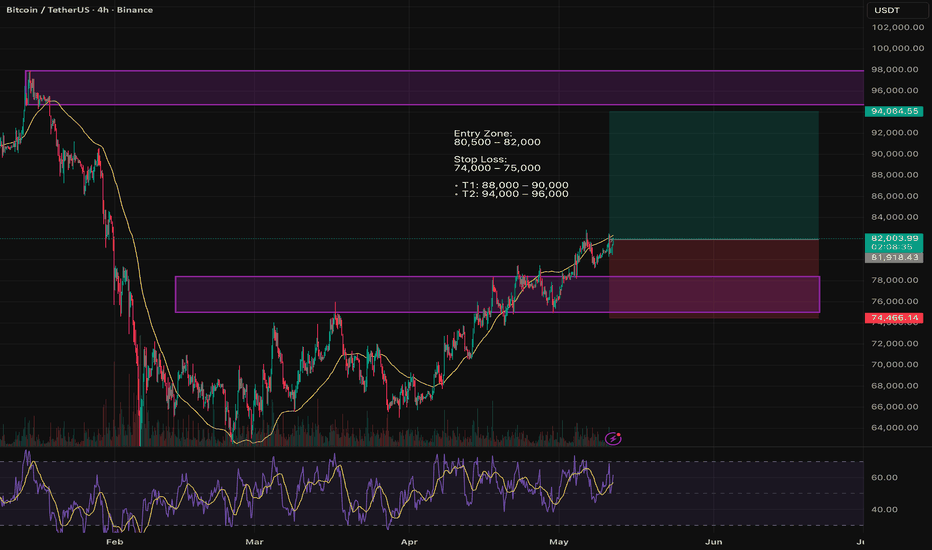
 Long
Long
Short 
Long 
Long 
Short 
Short 
 Short
Short
Long 
The Hidden Cost of FOMOFear of Missing Out, commonly known as FOMO, is one of the most expensive emotions in trading. It often appears when traders see a strong move already in progress and feel pressured to enter before the opportunity disappears. What starts as excitement can quickly turn into poor entries, unnecessary risk, and emotional decision-making.
Many traders buy near market tops or sell near market bottoms simply because they are reacting to price instead of following a plan. The fear of being left behind often causes traders to ignore risk management, abandon patience, and enter trades that do not meet their own criteria.
1. What Creates FOMO?
FOMO usually appears when traders watch a market move without them. Seeing large candles, social media excitement, or traders posting profits can create a sense of urgency that makes opportunities feel limited.
The reality is that markets generate opportunities every day. The feeling that a trade must be taken immediately is often emotional rather than logical.
2. Why Traders Chase Price
When price starts moving aggressively, many traders become afraid of missing potential profits. Instead of waiting for a proper setup, they enter late, hoping momentum will continue.
Unfortunately, late entries often provide poor risk-to-reward ratios. By the time many traders enter, the move is already extended and vulnerable to a pullback or reversal.
3. The Hidden Cost of Emotional Entries
FOMO trades are usually based on emotion rather than analysis. Because the entry is often rushed, traders rarely have a clear plan for risk management or trade execution.
This creates unnecessary stress during the trade and often leads to impulsive decisions such as moving stop-losses, taking profits too early, or holding losing positions too long.
4. Patience Creates Better Opportunities
One of the biggest lessons in trading is understanding that not every move needs to be traded. Missing a setup is frustrating, but forcing a trade is usually much more expensive.
Patient traders focus on waiting for price to come to them instead of chasing the market. This improves decision quality and reduces emotional pressure.
5. Focus on Process, Not Missed Trades
Every trader will miss opportunities. The goal is not to catch every move but to execute a repeatable process consistently over time.
The traders who succeed long term are not those who take every trade. They are the ones who remain disciplined enough to wait for opportunities that align with their strategy.
Conclusion
FOMO is not a market problem; it is a psychological challenge. The market will always create new opportunities, but emotional decisions often lead to unnecessary losses. Learning to stay patient and trust your trading plan can help you avoid one of the most common mistakes traders make.
Remember, successful trading is not about catching every move. It is about taking the right moves at the right time while protecting your capital and maintaining discipline. Education 
 Short
Short
Bitcoin chart analysis JUNE 19Hello
It's a Bitcoin Guide.
My analysis is optimized for TradingView.
If you press the Replay button, you can check real-time movements.
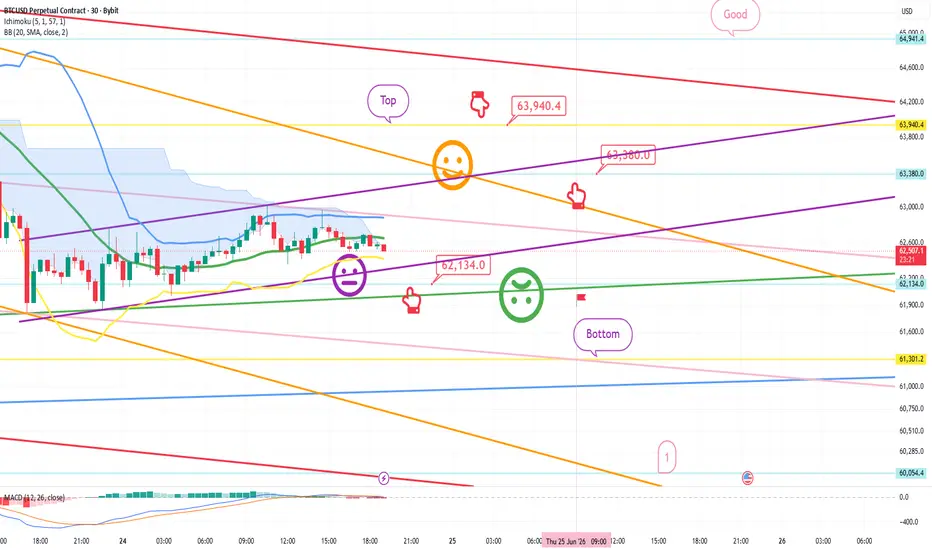
This is the Bitcoin 30-minute chart.
I haven't been able to look at the chart in detail lately because I've been so busy.
The reason Bitcoin has been falling so sharply was due to the MACD Dead Cross on the weekly candlestick.
The pattern has now been imprinted.
Also, the 12-hour chart is currently in progress.
This is very important.
We will check whether the Dead Cross is imprinted on the 12-hour chart at 9:00 AM shortly. If it doesn't rise above "Good" by the end of this week and just consolidates without a significant drop, it could rise starting next week.
Of course, there is one key point, but I will explain that part again next week.
The current position has many turning points, but I have summarized them as simply as possible.
*When the light blue finger follows the movement path, or during a vertical drop,
it is a two-way neutral strategy of switching from Short to Long.
1) Light blue finger: $62,900 short position entry zone / Stop loss upon breakout of pink resistance line
2) Switch to long position at $61,301.2 / Stop loss upon breakout of light blue support line
3) $63,731 Top zone: 1st long position target -> Good 2nd target
- If the rebound is too strong here,
a MACD dead cross could occur again on the weekly chart next week,
so it is best to see moderate sideways movement.
4) If the price fails to touch the light blue finger and falls after touching zone 1, switch to a long position at zone 2 below.
- This is a condition for a vertical decline; you may enter a short position at zone 1, or set a stop loss upon breakout of the pink resistance line -> zone 2 represents the case where the market closes with moderate sideways movement.
5) Upon Touching the Bottom Zone
$58,032.3 is today's major support line. Touching this zone creates the conditions for a continuous rise starting next week without breaking the low.
Please use my analysis merely as a reference and for practical application.
I hope you operate safely by strictly adhering to trading principles and using stop-loss orders.
You worked hard this week.
Have a great weekend.
Thank you. Short 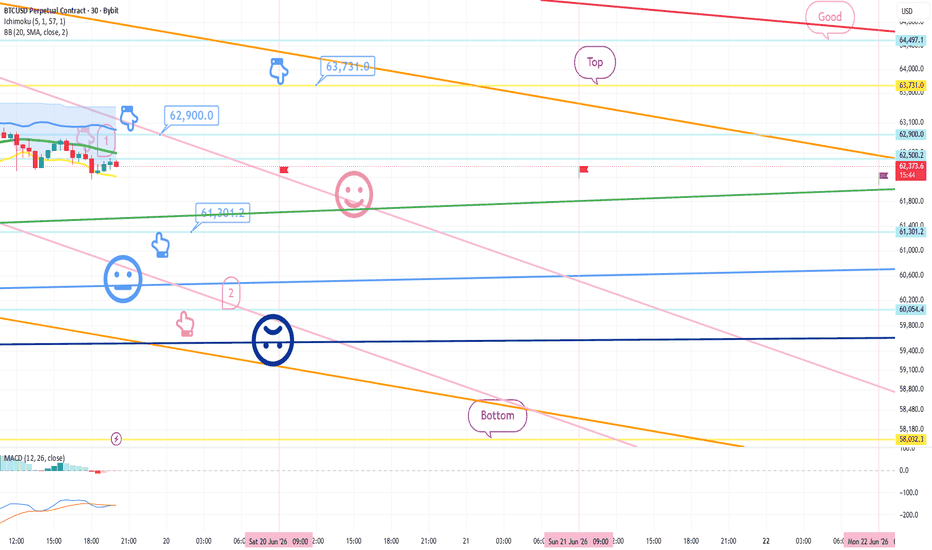
Short 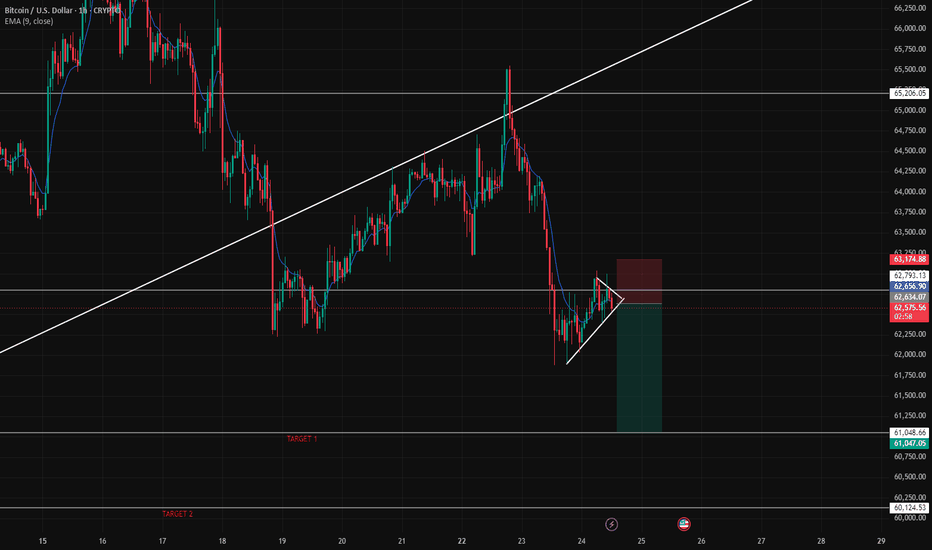
Short