BTCUSDT 1W: Are We Heading to the $49,000 Major Liquidity Zone?Technical Analysis Breakdown
1. Macro Trend Shift - Following a multi-month uptrend peaking at local highs, the market structure has shifted downward. Lower highs and lower lows are forming on the macro view, confirming strong bearish momentum.
2. Immediate Liquidity Sweeps - The price is currently pressuring a vital local support level at $59,767. Multiple wicks indicate ongoing Liquidity Sweeps around this level as buy stops are repeatedly hunted.
3. The Ultimate Support Target ($49,045) - If the $59,767 sweep region fails to spark a sustained bullish reversal, a deeper correction is likely. The next major technical structural level lies at $49,045. This line marks an Important Support & Liquidity Zone representing an older macro breakout point that hasn't been retested.
Trade Scenarios & Outlook
< Bearish Scenario (Higher Probability) - A weekly candle close below $59,700 will trigger a cascading flush down to gravity centers. Expect a drop toward the primary demand zone at $49,000 to collect trapped buy-side liquidity before any long-term recovery.
< Bullish Scenario (Invalidation) - A decisive engulfing bounce off the current liquidity sweep zone could temporarily delay the correction. Bulls must reclaim higher levels to invalidate this macro-downward path.
Disclaimer: Educational analysis only. Not financial or investment advice.
 Short
Short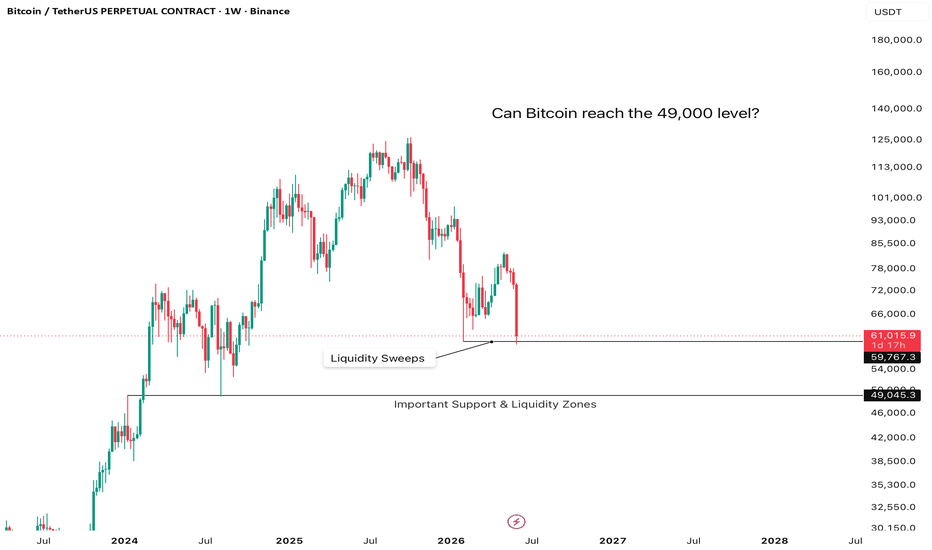
Short 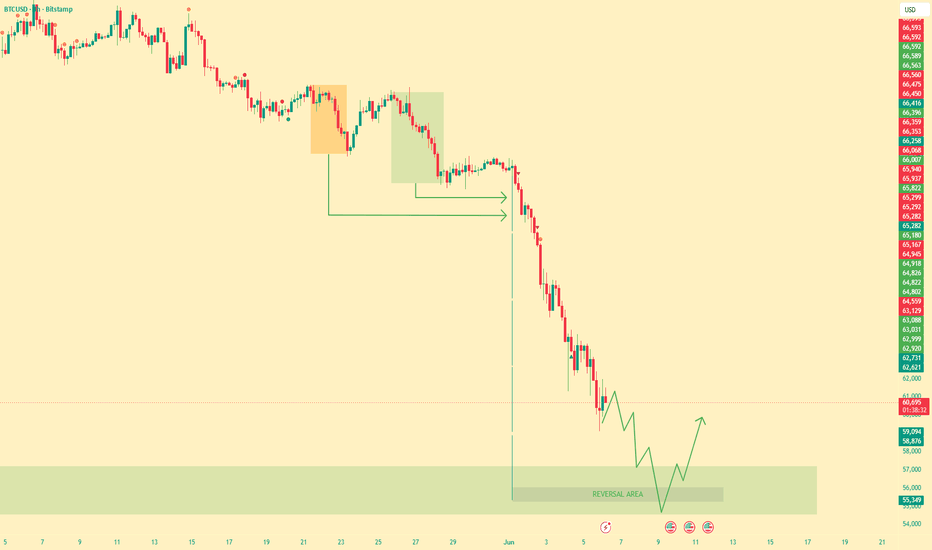
Bitcoin Tests 60K After Heavy BreakdownBitcoin has broken down sharply from 74K toward 61K, with strong volume confirming heavy liquidation pressure.
Buy Setup
Entry: 60,000–59,000 support hold
SL: below 58,000
TP1: 63,000
TP2: 65,000
Sell Setup
Entry: H4 close below 59,000
SL: above 61,000
TP1: 56,000
TP2: 54,000
Current bias: bearish while BTC stays below 65,000. Short 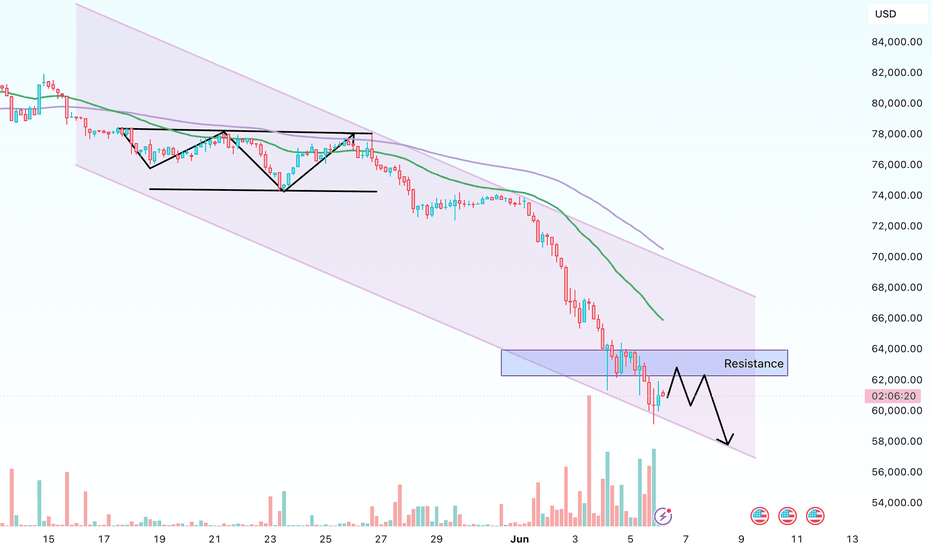
 Long
Long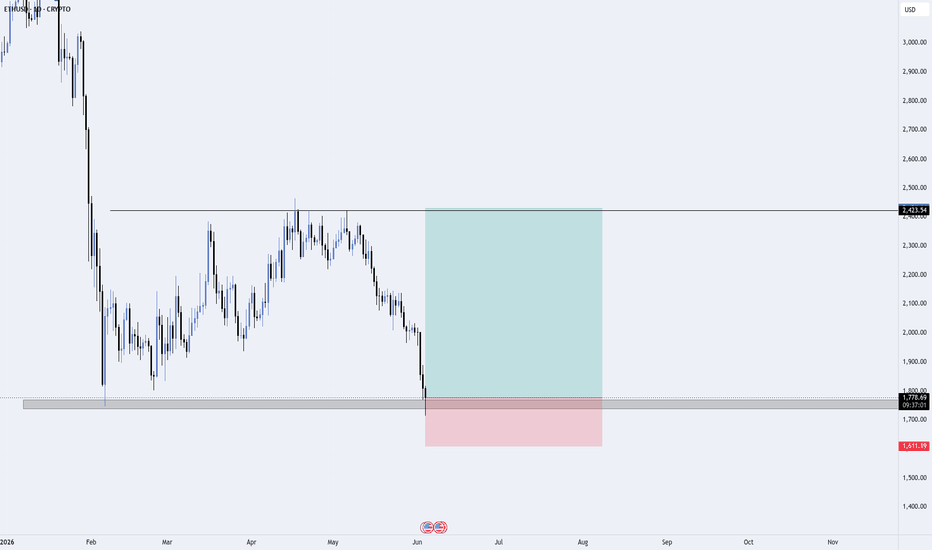
Short 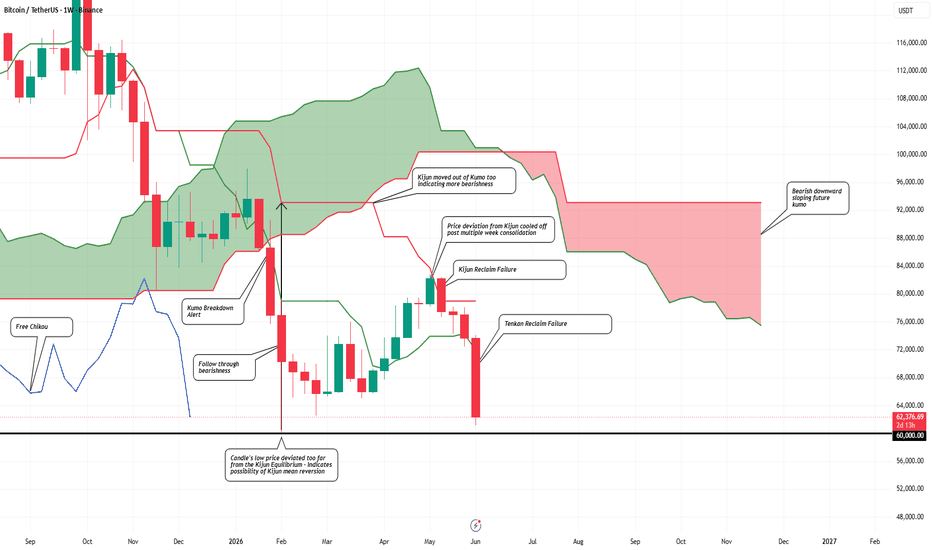
 Short
Short
Long 
BTCUSD (1H) | The Ultimate Shakeout: Two Paths to ReversalHello Traders,
Bitcoin ( BITSTAMP:BTCUSD ) has faced massive bearish pressure in the first week of June 2026, driven by macroeconomic uncertainty, geopolitical risks, and heavy ETF outflows. Following a severe liquidation cascade , BTC is currently hovering near the $62,500 level. We have reached a critical technical juncture on the 1-hour chart.
📊 Technical Breakdown & Context:
The Sell-Off: Bitcoin recently crashed from the $70,000 levels to an intraday low near $61,500 .
Massive Liquidations: This sharp downward move resulted in nearly $1.76 billion worth of leveraged positions being liquidated across the crypto market .
Immediate Support: The first red line on the chart at $61,348 represents the immediate structural support and recent swing low.
Extreme Demand / Psychological Support: The lower red line at $60,043 is a massive psychological and institutional demand zone.
🎯 The Trade Plan (Two Projected Scenarios):
Scenario A (Immediate Reversal): 🏹
If the recent low near $61,500 holds , and price establishes a strong base above the $61,348 line, we can expect a relief rally. The immediate target for this bounce is the supply block around $64,300 - $65,000 to fill the recent market imbalances.
Scenario B (The Final Liquidity Purge): 🦈
Given the current risk-off market sentiment , there is a high probability of one more trap. If the $61,348 support breaks, we expect the price to aggressively sweep the liquidity resting below and tap the $60,043 extreme discount level. Once this final purge happens, look for a strong institutional displacement back to the upside targeting $64,300+.
💡 Execution Tip:
Do not front-run the market. If you are looking for long positions, wait for a confirmed Change of Character (CHoCH) on a lower timeframe (5M/15M) at either the $61,348 or $60,043 level before executing.
If you find this structural price action mapping valuable, please drop a LIKE and hit FOLLOW for more updates.
Disclaimer: This analysis is for educational purposes only and does not constitute financial advice. Always practice proper risk management. Bitcoin Dumped From $126K to $60K as Per Exactly My AnalysisWhen Bitcoin was Between $115K-$110K, I shared a bearish chart setup and said CRYPTOCAP:BTC could eventually revisit sub-$50K levels.
Back then, many ignored the analysis because the timeline was full of "Buy, Buy, Buy" posts. Today, Bitcoin has already dropped to the $59K range and is trading near $62K.
The biggest lesson? Never follow anyone blindly, not influencers, not analysts, not even me. Always do your own research and think independently.
Most people get rich by accumulating during fear, panic, and bearish markets, not by chasing green candles in a bull run.
Personally, I see 2026-2027 as a potential accumulation period, with $50K-$40K remaining a strong long-term spot accumulation zone if reached. No leverage, no gambling, just patience and strategy.
The next major wealth transfer won't happen when everyone is euphoric. It will happen when everyone is scared.
NFA & Always DYOR Long 
BTCUSD (1H) High-Probability Reversal Setups:Retest vs.LiquidityHello Traders,
Following a sharp institutional sell-off from the $73,000+ levels, Bitcoin (BTCUSD) is currently hovering around a crucial turning point near $70,328. As price approaches key discount arrays, we are tracking two high-probability Smart Money Concepts (SMC) paths for a bullish reversal.
Here is the structural breakdown of the two scenarios mapped out on the chart:
📊 Technical Breakdown & Market Structure:
Current State: The market has delivered a heavy bearish impulse, clearing out short-term buy-side liquidity and creating immediate inefficiencies above.
Immediate Support POI: We are currently sitting right on an immediate demand flip zone around $70,000.
Extreme Discount Demand Zone: Further down, a major unmitigated 1H demand block is waiting at the $68,000 psychological level, which represents an ideal area for an institutional liquidity grab.
🎯 The Trading Plan (Two Bullish Scenarios):
Scenario A (The Aggressive Reversal): 🏹
If the current minor support holds, price may see a short-term relief bounce, pull back slightly to form a higher low right around the $70,000 mark, and then accelerate upward to reclaim the premium ranges.
Confirmation: Look for a lower timeframe (5M/15M) Change of Character (CHoCH) around $70,000.
Scenario B (The Deep Liquidity Purge - Higher Probability): 🦈
If the bearish momentum breaches $70,000, do not panic. This will likely turn into a classic engineering of liquidity, dragging the price straight into our extreme discount demand block at $68,000. This area is highly primed for a massive institutional bounce.
Confirmation: Wait for a sharp stop-hunt/sweep of the recent lows into the $68,000 zone, followed by a strong displacement candle to enter long.
💡 Pro Execution Tip:
Do not chase the market in no man's land. Let the price action commit to either establishing structural support at $70,000 or sweeping down into the $68,000 extreme discount block. Protect your capital and manage your risk strictly.
If you find this structural price action mapping valuable, please drop a LIKE and hit FOLLOW for daily high-probability setups
Where do you see BTC heading next? Are we bouncing from $70k or dipping to $68k first? Let's discuss in the comments 👇 BTCUSD (1H) | Bearish Capitulation: Awaiting Structural ReversalHello Traders,
Bitcoin (BTCUSD) is currently undergoing a significant correction, breaking below key support levels as market sentiment remains cautious. With the price hovering near $62,600, we are looking at potential structural shifts on the 1-hour timeframe.
📊 Technical Breakdown:
Current Trend: The market is exhibiting strong bearish momentum, with a clear breakdown of previous consolidation ranges.
Immediate Support: The current price level around $62,600 is being tested; a failure to hold this could trigger further downside.
Extreme Demand Zones: We are monitoring the $60,000–$61,000 range as a primary point of interest (POI) for a potential institutional liquidity grab and structural stabilization.
🎯 The Trade Plan:
We are looking for signs of exhaustion before attempting any long entries.
Scenario 1 (Immediate Bounce): If the price establishes support here, we may see a short-term relief rally back toward the $64,000–$65,000 resistance.
Scenario 2 (Deep Liquidity Sweep - Higher Probability): A further dip toward the $60,000 psychological support level is preferred. We are waiting for a clear Change of Character (CHoCH) on the lower timeframes (5M/15M) at this level before looking for long setups.
💡 Pro Execution Tip:
In this bear-dominated environment, do not "catch a falling knife." Wait for price to reach our discount zones and confirm a structural shift. Always prioritize risk management over entry speed.
If you find this price action analysis helpful, please LIKE this idea and FOLLOW for more updates! What is your outlook for BTC this week? Let me know in the comments below.
Disclaimer: This analysis is for educational purposes only and does not constitute financial advice. Always trade with proper risk management. Short 
Long 
Bitcoin — Weekly Chart Analysis 24May26 COINBASE:BTCUSD Bitcoin is currently showing signs of short-term weakness after facing rejection near the upper resistance zone around $80,000–81,000. The recent weekly candles indicate slowing bullish momentum, while price is struggling to sustain above the breakout region.
The chart structure suggests a possible corrective phase beginning from the first week of June, especially if sellers continue defending the current resistance zone. The rising trendline support remains intact for now, but a breakdown below the short-term demand area could trigger deeper downside movement.
Current Market Structure
Price is trading inside a critical decision zone after a strong recovery rally from lower levels. Recent rejection candles near resistance indicate profit booking and reduced buying strength.
Expected Scenario
A corrective move toward the major weekly support/reversal zone around $63,300–65,500 is possible if bearish momentum increases during the coming weeks.
This region is important because:
* Previous accumulation occurred near this zone
* Higher timeframe support is present
* Trendline confluence strengthens reversal probability
* Buyers may re-enter aggressively from this area
Technical Observations
Weekly RSI is losing momentum near the mid-zone, indicating weakening bullish strength.
Volume participation has reduced during the recent upward move, suggesting possible exhaustion.
Price is currently attempting to hold above short-term support near $75,000–76,000. A breakdown below this region may accelerate selling pressure.
Bullish Invalidation
The bearish correction scenario may weaken if Bitcoin reclaims and sustains above the $81,000 resistance zone with strong weekly closing and rising volume.
Conclusion
Bitcoin remains bullish on the larger timeframe, but short-term price action suggests the possibility of a healthy correction before continuation. The $63,300–65,500 zone remains the key area to watch for potential support and reversal opportunities.
Disclaimer: This analysis is for educational purposes only and not financial advice. Always manage risk properly before taking any trade.
Short 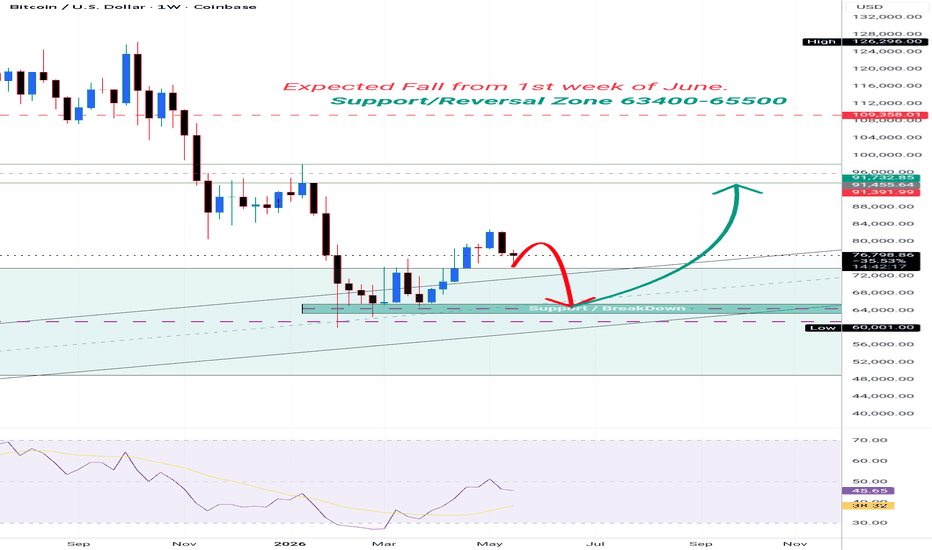
BITCOIN Current Market StructureBitcoin is currently testing a major support zone around $65,000. I'm watching for a liquidity sweep and bullish reaction before considering swing-long positions. If buyers step in, BTC could target $75k, $80k, and potentially $90k in the coming weeks. However, a break below $60k would invalidate this bullish setup. As always, manage risk and wait for confirmation before entering."
This channel is for trading education only. No paid promotions, no referrals, no investment advice. Support the channel by subscribing and learning with the community.
Current Market Structure
✅ Bitcoin has fallen into a major support zone around $65,000–67,000.
✅ The chart suggests a possible liquidity sweep ("stop hunt") below support before a reversal.
✅ Your Elliott Wave projection shows:
Wave (2) completion near support
Wave (3), (4), and (5) targeting higher prices afterward
Key Levels to Watch
🔹 Support Zone: $65,000 – $67,000
🔹 Invalidation Level: Below $60,000
🔹 Upside Targets:
Target 1: $75,000
Target 2: $80,000
Target 3: $90,000+
Swing Trade Plan
📌 Wait for:
Price to sweep liquidity near $65k.
Strong bullish daily candle.
Volume increase on the bounce.
📌 Entry Area:
$65,000 – $67,000
📌 Stop Loss:
Below $60,000
📌 Take Profit:
TP1: $75,000
TP2: $80,000
TP3: $90,000+
Risk Management
⚠️ Never risk more than 1–2% of your trading capital on a single trade.
⚠️ If BTC closes multiple daily candles below $65k, bullish momentum weakens and the setup may fail. Long 
Long 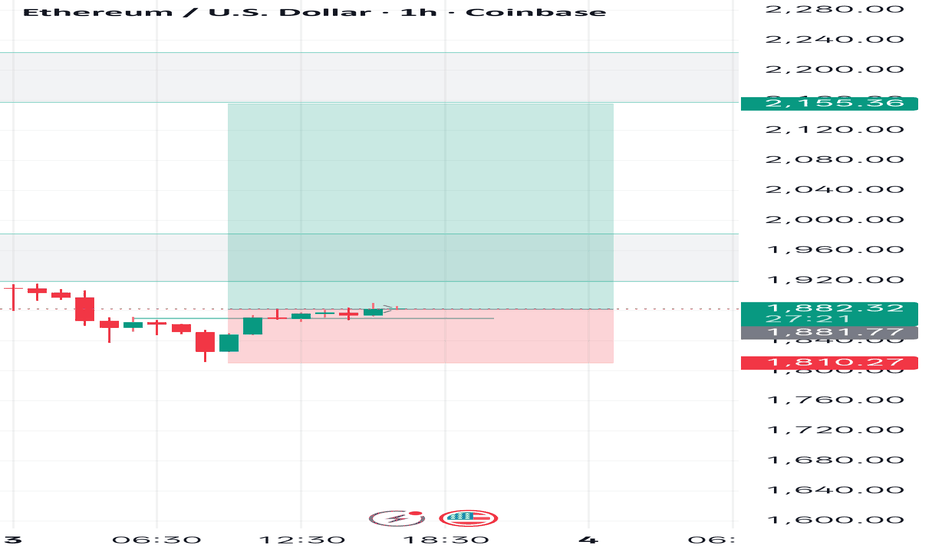
BTCUSD Analysis: Bitcoin Rebounding from Support – Long Setup TaBased on the 1-hour chart for Bitcoin / U.S. Dollar (BTCUSD) from TradingView, the market has recently undergone a sharp corrective decline from its highs near 74,000. However, the selling pressure has stalled as the price found strong buyer interest near a key horizontal support level, paving the way for a potential bullish reversal.
Technical Breakdown
Support Base: The market has rejected lower prices right around the 65,690 - 65,712 zone (marked by the lower yellow horizontal line). This is serving as a strong floor where the price created a local bottom.
Current Price Action: BTCUSD is currently trading at 67,102.60, pushing upward off the support zone with a visible bullish candle development.
Market Structure: Large green upward arrows indicate an expectation of an incoming bullish wave, projecting a zig-zag recovery path (pink line) back toward overhead resistance.
Trade Execution Strategy (Long Position)
A long trade setup is active based on this local support bounce:
Entry Point: Market execution around the current price (~67,102.00).
Stop Loss (SL): Placed just below the recent swing low and support line at 65,712.13 to limit downside risk.
Take Profit (TP): Targeted at the major overhead resistance level of 70,059.99, with potential for an extended breakout past 70,103.47 if momentum sustains.
Educational Note & Disclaimer (English)
⚠️ Educational Purpose Only | Not Financial Advice
This trade setup is shared purely for educational purposes to help you understand market structure, high/low levels, and support zones. This is not financial advice. Every trader should analyze the market independently and trade at their own risk.
Market Tip: Watch the market structure closely here, guys. We are tracking how price bounces from these key highs and lows. We will look for a solid structure or a potential retest before deciding on further extensions. Trade safely and manage your risk! Long 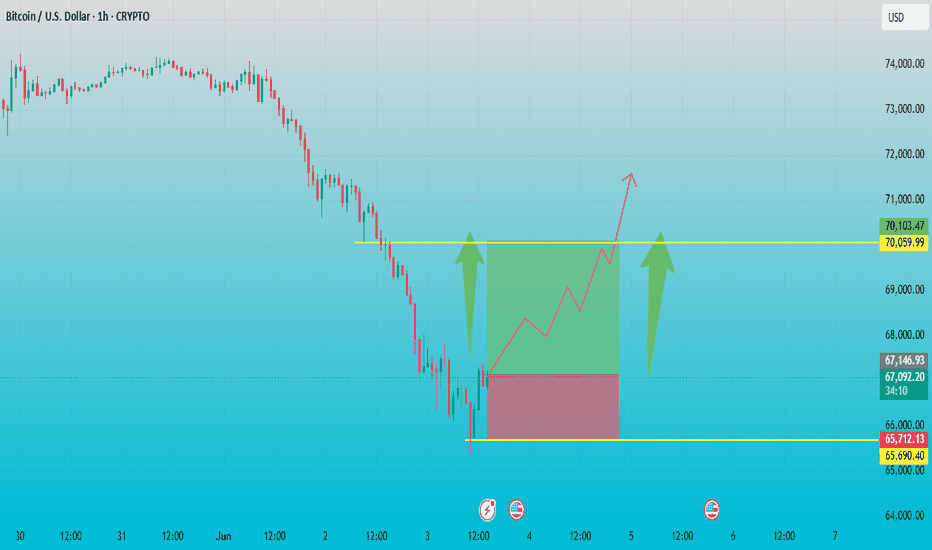
BTCUSDT: Massive 2x Measured Move Completed—Time to Buy?BTCUSDT has completed a massive 2x measured move downward from a premium supply zone and is currently testing a key historical Reversal Area between $65,000 and $65,650.
Market Overview & Structure
1. Supply Zone Distribution
The Premium Block: Price initiated a heavy sell-off from a well-defined distribution range between $77,000 and $78,000.
Institutional Imbalance: This zone represents an aggressive institutional supply imbalance that rapidly shifted market control to sellers.
2. The 2x Measured Move
The 1x Extension: The initial leg down established a definitive momentum benchmark.
The 2x Projection: Sellers completely exhausted the mathematical downside target at 2x Supply, plunging the market perfectly into the lower extreme.
Trading Setup: Long Position Potential
Execution Strategy
Entry Zone: Look for entries within the highlighted Reversal Area ($65,000 - $65,650). Wait for lower-timeframe validation (e.g., a bullish engulfing candle or a change of character on the 15m/1h charts).
Stop Loss (SL): Place strictly below $64,500 to protect against a liquidity sweep of the structural lows.
Take Profit 1 (TP1): $68,500 (Immediate structural resistance).
Take Profit 2 (TP2): $73,000 (Major mid-range supply block).
Long 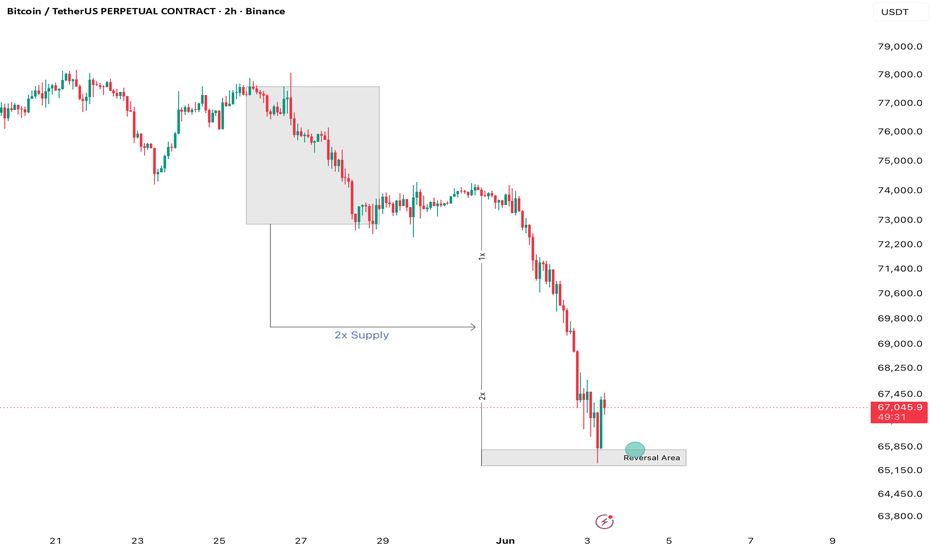
Short 
Short 
ETH Loses 2,000 as Sellers Stay in ControlETHUSDT remains bearish on H4 after losing the 2,000 psychological level. Price is below both EMAs, while the short EMA near 2,030 and the long EMA near 2,085 continue sloping downward.
The key support zone is 1,980–1,960. If ETH fails to hold this area, downside pressure may extend toward 1,920 and 1,880–1,840.
ETH sentiment remains weak, especially after the break below 2,000 and rising futures open interest, which increases the risk of sharp volatility.
Trade Plan
Buy setup: wait for ETH to test 1,960–1,940. If strong rejection or absorption appears, targets are 2,030 and 2,085.
Sell setup: if ETH closes H4 below 1,960, avoid catching the bottom. Targets become 1,920 and 1,880.
Continuation sell: if 1,880 breaks, the next liquidity zone may sit around 1,840.
Invalidation: strong H4 close above 2,085. Short