Long
Long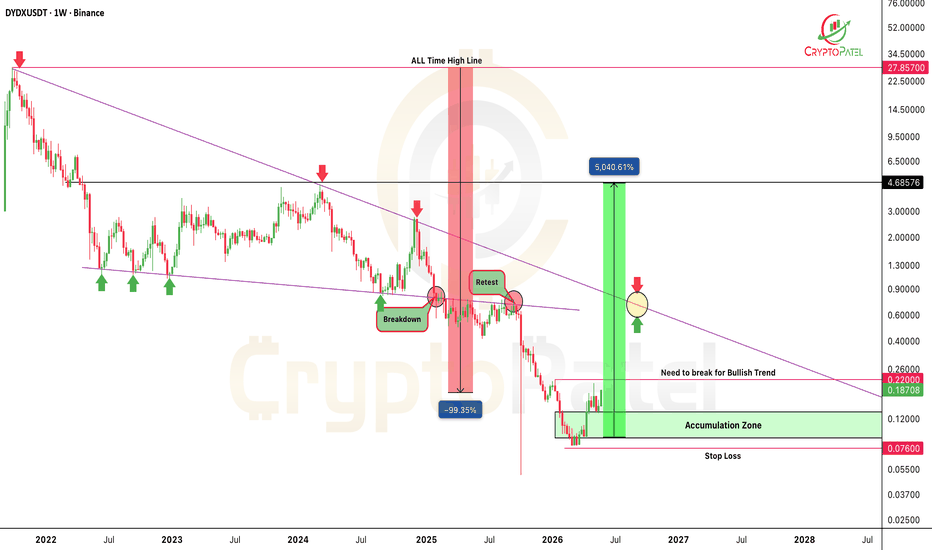
 Long
Long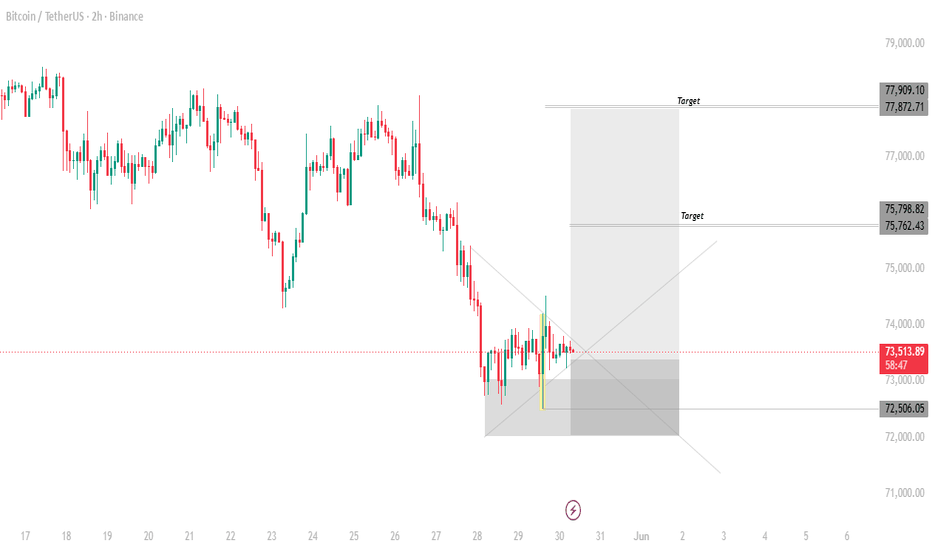
Short 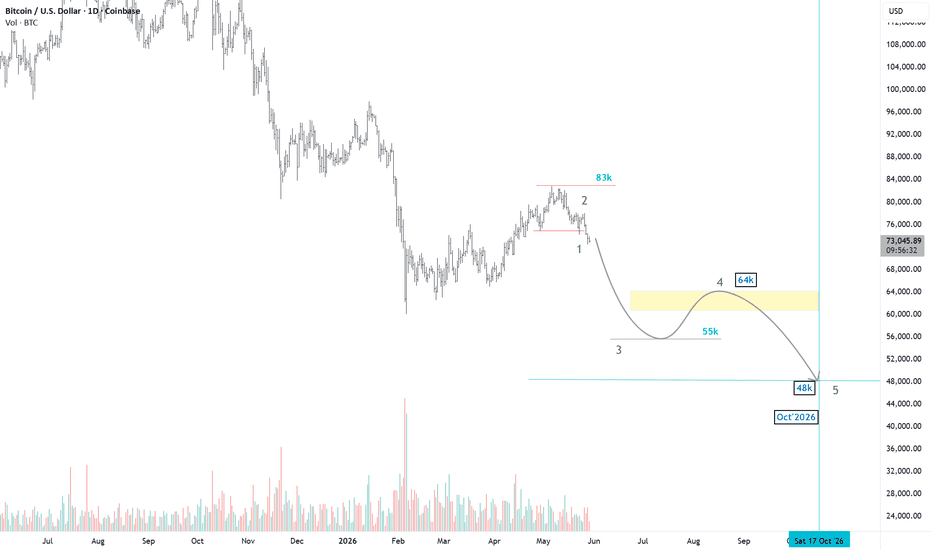
 Long
Long
BTC/USD Technical Analysis: The Power of Confluence
Overview
Looking at the BTC/USD 1-Week (1W) chart, we can observe a fascinating technical setup unfolding. The price action is currently trapped between two distinct structural patterns: a long-term macro ascending channel and a medium-term corrective descending channel. The intersection of these two patterns is creating a highly critical zone for Bitcoin's next major move.
Here is a breakdown of the technical structures in play:
1. The Macro View: Ascending Fibonacci Channel
The broader overarching structure on this chart is an Ascending Fibonacci Channel (represented by the multi-colored diagonal bands).
Trend Continuation: This channel highlights the macro bullish trend of Bitcoin over the last couple of years.
Dynamic Levels: The internal colored lines represent key Fibonacci ratios acting as dynamic support and resistance. Historically, as long as the price maintains its position within the upper tiers of this channel, the macro uptrend remains firmly intact.
2. The Medium-Term View: Descending Parallel Channel
Overlapping the recent price action, we can clearly identify a Normal Declining Channel (the blue downward-sloping parallel channel).
Corrective Phase: This represents a medium-term corrective phase or a "bull flag" structure within the larger macro uptrend.
Price Behavior: Inside this channel, the price has been forming a series of lower highs and lower lows, bouncing between the upper resistance trendline and the lower support trendline.
3. The Confluence Zone: Why It Matters Now
The most important takeaway from this chart is the concept of Technical Confluence—where multiple indicators point to the same crucial area.
Currently, Bitcoin is testing a massive dual-support zone:
It is sitting right at the lower support boundary of the blue descending channel.
Simultaneously, it is testing a crucial diagonal support band of the macro ascending Fibonacci channel.
When price reaches a zone where a macro support level intersects with a micro support level, it creates a high-probability reversal area.
Key Takeaways & What to Watch Next
Bullish Scenario: A strong bounce from this exact confluence zone could signal the end of the medium-term correction. Bulls will want to see the price rally from here and break completely out of the upper boundary of the blue descending channel to resume the macro upward trajectory.
Bearish Scenario: If the price breaks and closes a weekly candle below this dual-support structure, it would invalidate the current setup and likely lead to a deeper correction toward the lower (red) support bands of the larger Fibonacci channel.
Conclusion: We are at a "make or break" decision point. Watch for high volume and a strong weekly close to confirm the market's chosen direction from this critical intersection.
It's just an idea. Long 
BTC Facing Heavy Resistance: Is the Next Leg Down Starting?📊 Market OverviewBitcoin ( BITSTAMP:BTCUSD $) is currently exhibiting a highly technical bearish setup on the lower timeframes, strictly respecting Smart Money Concepts (SMC) structure. After a previous structural shift, the price has rallied back up to mitigate a key premium zone, offering a high-probability shorting opportunity.
🔍 Technical BreakdownBreak of Structure (BOS): Looking at the top left of the chart, price clearly broke swing lows to the downside, confirming a shift from a bullish/ranging environment into a definitive bearish market structure.
Trendline Liquidity / Resistance: A clean, descending trendline has been established. The recent upward price action has retested this trendline, which is acting as a strong dynamic resistance barrier.
H1 Order Block (H1-OB) Confluence: The primary point of interest (POI) is the highlighted H1 Order Block (teal box). Price has efficiently tapped into this institutional supply zone. The confluence of the descending trendline meeting the H1-OB creates a massive "wall" of resistance.
Expected Price Action: As depicted by the red arrow, price is showing signs of rejection from this dual-confluence zone, suggesting institutional sellers are defending this area to push price lower.
🎯 Trade Parameters (The Setup)
Direction: Short / Sell
Entry Zone: Inside the H1-OB teal box area (approx. $73,533$)
Stop Loss (SL): Just above the H1 Order Block high or the descending trendline invalidation level (to protect capital if the structure breaks bullish).
Take Profit / Target: The yellow support line (TARGET), targeting the recent swing lows where sell-side liquidity is resting. Short 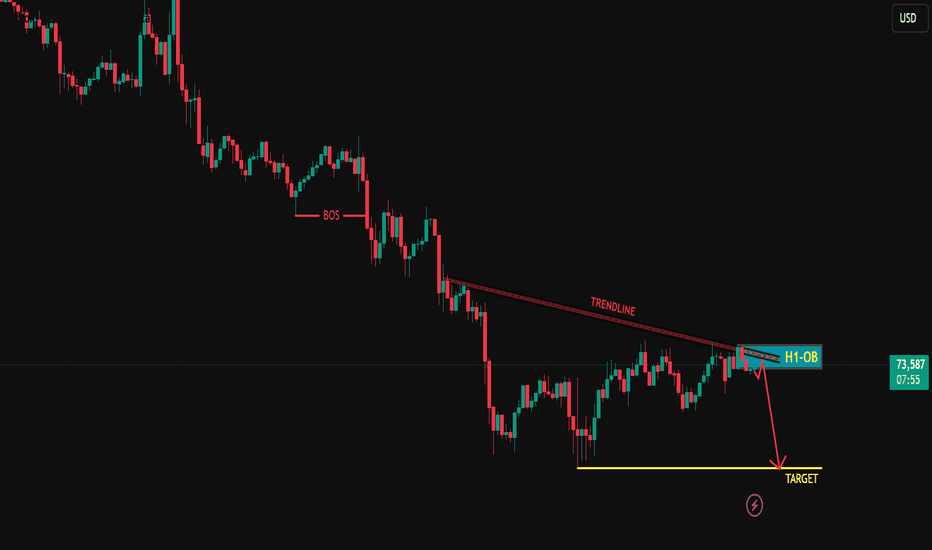
Bitcoin Rebounds Are Still Being SoldBTCUSDT remains weak on H4 after forming lower highs from 82,000 and losing the 76,500–77,000 support zone.
Price is now trading near 73,600 and still below both EMAs. The short-term EMA around 74,800 and the larger EMA near 76,300 are acting as resistance, showing that the market is still in “rally to sell” mode.
ETF demand is also softer, while macro uncertainty and rate expectations keep investors cautious.
Trade Plan
Sell setup: wait for a rebound toward 74,500–74,900. If price rejects below the EMA zone, targets are 72,800 and 72,200.
Continuation sell: if 72,200 breaks, the next liquidity zone is 71,000–70,000.
Buy setup: only consider longs if BTC reclaims 74,900 first, then holds above 76,300 with strong H4 confirmation.
Invalidation: clear H4 close above 76,300.

 Long
Long
Long 
Long 
Long 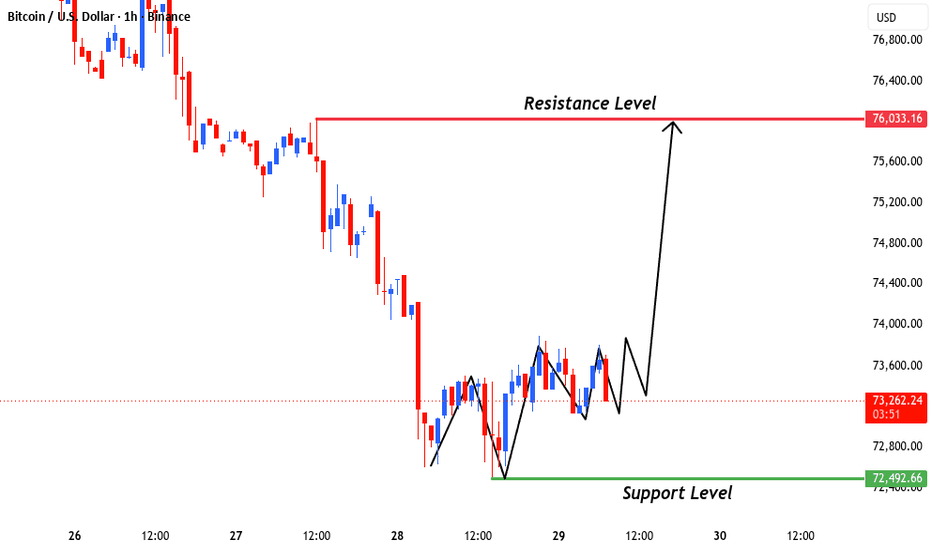
Short 
Stop Counting Pips. Start Measuring Real ProfitStop Measuring Your Trading Performance in Percentages or Pips
Most traders track their performance the wrong way. They obsess over pip counts, celebrate percentage returns, and compare account balances. None of that tells you whether you are actually trading well. Today I want to show you a better way to measure your results, one that professional traders and prop firms actually use.
This article is written for shorter-term traders who typically hold one to three positions at a time. If you manage a diversified stock portfolio or a hedge fund with dozens of assets, this may not apply directly to you. But if you are a retail trader managing your own account, read this carefully because it will change how you look at your performance.
Why Percentages and Pips Are Misleading
Here is the problem with measuring returns in percentages. A 100% return on a $500 account means you made $500. A 20% return on a $50,000 account means you made $10,000. Which trader performed better? The percentage says the first one. The reality says the second one.
Percentages look impressive on paper but they do not reflect the actual skill or risk involved in making those returns.
Pips have the same problem. A trader risking 50 pips to make 20 pips is performing very differently from a trader risking 10 pips to make 30 pips, even if both made the same number of pips in total. The pip count alone tells you nothing meaningful.
Every trader has a different account size, a different risk tolerance, and a different position sizing approach. Comparing performance using percentages or pips between two different traders is like comparing apples to oranges. It does not work.
The Right Way to Measure Performance: R
The most accurate and useful way to track your trading performance is through something called R, which stands for your risk to reward ratio across all your trades.
R is simply your total profits divided by your total losses over a series of trades.
If you made $100,000 in a year but lost $50,000, your R value is 2. That means for every dollar you lost, you made two dollars back. A 3R track record means you made three dollars for every dollar lost.
This number is what actually matters. It tells you whether your strategy is working, whether your risk management is sound, and whether you are making more than you are losing in a way that is sustainable over time.
Here is a real example using 20 trades with fixed risk:
Trade 01: +3R (Winner)
Trade 02: -1R (Loser)
Trade 03: -1R (Loser)
Trade 04: -1R (Loser)
Trade 05: +3R (Winner)
Trade 06: +3R (Winner)
Trade 07: -1R (Loser)
Trade 08: -1R (Loser)
Trade 09: +5R (Winner)
Trade 10: +4R (Winner)
Trade 11: +2R (Winner)
Trade 12: -1R (Loser)
Trade 13: -1R (Loser)
Trade 14: -1R (Loser)
Trade 15: +3R (Winner)
Trade 16: +6R (Winner)
Trade 17: -1R (Loser)
Trade 18: -1R (Loser)
Trade 19: -1R (Loser)
Trade 20: +4R (Winner)
Total Wins: 33R
Total Losses: 11R
Overall R: 3R (33 divided by 11 = 3)
Notice something important in that example. Out of 20 trades, 11 were losers and only 9 were winners. That means this trader lost on 55% of their trades and still came out with a 3R overall result. This is exactly why win rate alone means nothing. What matters is how much you make when you are right compared to how much you lose when you are wrong.
Account Size Does Not Tell the Full Story
Here is something most traders do not think about. Due to leverage, a trader with $1,000 in their account can trade a similar position size to a trader with $20,000 in their account. Account balance is not a reliable indicator of how much risk someone is taking or how skilled they are.
You do not need a large account balance to trade meaningful size. You need a clear understanding of your risk per trade.
For this reason, keeping all your trading capital in one account makes very little sense. Most of it can sit in a separate savings or investment account earning interest while you only keep what you need to trade your desired position size. The account balance your broker sees is not a reflection of your overall financial position or your trading ability.
Risk Tolerance Is Personal
One trader might be comfortable risking $200 per trade. Another might risk $2,000. Neither is right or wrong as long as it fits within their personal financial situation and does not affect their ability to make clear decisions.
A simple rule to check if you are risking too much: if your open trades are keeping you awake at night, your position size is too large.
Risk tolerance grows naturally as your skills and track record develop. A beginner should start small and build confidence over time. An experienced trader with a proven edge can reasonably increase their risk per trade as their results justify it. But that confidence has to be earned through a track record, not assumed.
What Prop Firms Actually Look At
If you ever want to trade someone else's capital or attract outside funding, understanding R becomes even more critical. Prop trading firms do not care about your pip count or your percentage return in isolation. They look at your return relative to the risk you took to achieve it.
A prop trader only gets paid when their R value is above 1. Anything below 1 means they lost more than they made, regardless of how many pips they caught.
Banks, hedge funds, and prop firms all measure performance this way. They want to see that you are generating returns efficiently relative to the risk you are accepting. A long track record showing a consistent R value of 2 or 3 is far more impressive to a serious investor than a flashy percentage return achieved by risking too much on one trade.
One Important Warning
Understanding R does not mean you should start risking more per trade. That would completely miss the point. R is a measurement tool, not a license to increase your position size recklessly.
The goal is to keep your risk fixed and consistent so that your R value accurately reflects your trading edge over time.
If your risk changes from trade to trade, your R number becomes meaningless because you cannot compare the results fairly. Fix your risk, track your R, and let the results show you whether your strategy is actually working.
Final Thought
Stop chasing pip counts. Stop getting excited about percentage returns that look good on paper but mean very little in reality. Start measuring what actually matters, how much you make relative to how much you risk, consistently, over a large series of trades.
A trader with a 3R track record over 100 trades has proven something real. A trader with a 200% return on a $300 account has proven very little.
Track your R. Build your edge. Let the results speak for themselves.
Thank you for reading. I hope this article helped you better understand market behavior, trading psychology, and risk management during volatile conditions.
For more trading education, chart analysis, and market insights, follow:
@Trade-Technique on @TradingView
Education 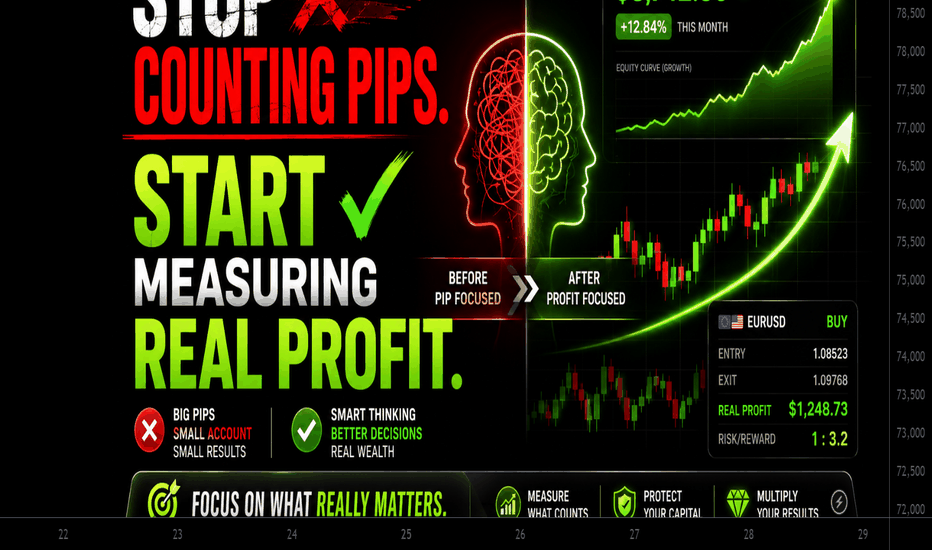

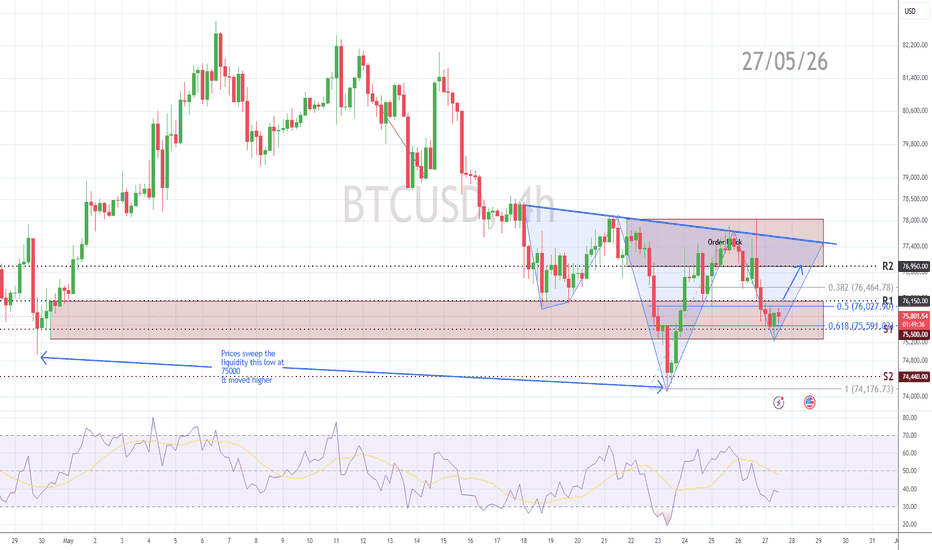
Bitcoin chart analysis May 27Hello
It's a Bitcoin Guide.
My analysis is optimized for TradingView.
If you press the Replay button, you can check real-time movements.
This is the Bitcoin 30-minute chart.
On the left, indicated by the purple finger, I have connected the strategy exactly to the entry point of the long position I entered yesterday, 75.8K (Gap 11).
Currently, a MACD Dead Cross is in progress on the 12-hour chart.
*The red finger long position strategy before and after the touch of the blue finger at the top:
1) After confirming the touch of the blue finger's 1 zone,
the red finger's long position entry point at $75,672.9 at the bottom / Stop loss if the green support line is broken.
2) $76,801.6 long position 1st target -> Top zone 2nd target price.
Although unlikely, please note that if the price rises to 76.8K in one go from the current position,
it may not come back down to the long position entry point.
3) If the price drops immediately without touching Zone 1 at the top:
Zone 2 at the bottom (75.3K) is the entry point for a long position / Stop loss if the green support line is broken.
For those maintaining a long position at 75.8K (indicated by the purple finger),
I suggest you try operating with the same stop loss setting.
From the point where the green support line is broken, the price is open up to the Bottom -> Zone 3 at the bottom, so please exercise caution.
Please use my analysis post merely as a reference and for practical application.
I hope you operate safely by strictly adhering to trading principles and using stop loss settings as a necessity.
Thank you. Long 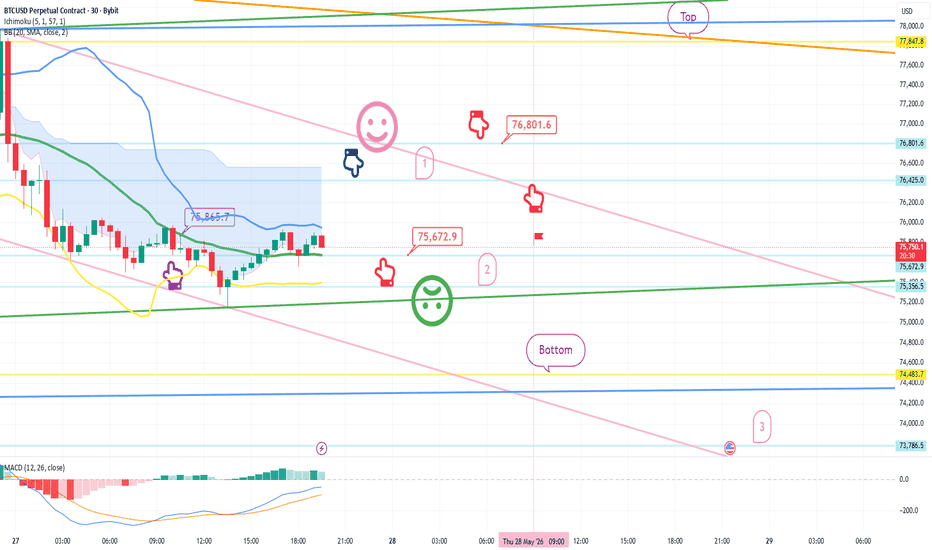
 Long
Long
Short 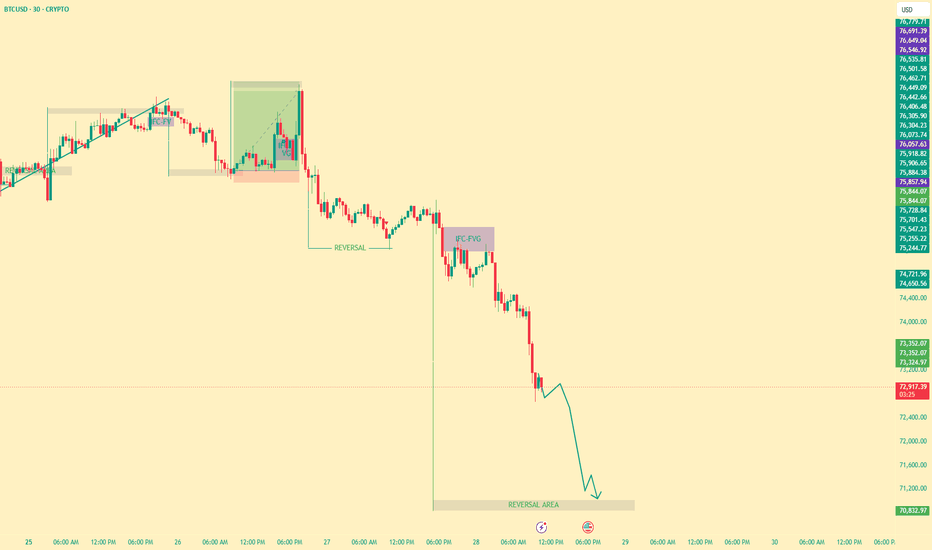
BTCUSDT: Systematic Waves & Momentum DivergenceThis analysis demonstrates a technical case study on the BTCUSDT 1-hour chart near the $78,080 liquidity zone. This layout highlights a structural transition from retail buying exhaustion to downward institutional distribution.
Core Filters
Geometry: Utilizes swing points (HH, LH, HL, LL) to map clean market boundaries.
Elliott Reversal: Tracks the relationship between a Wave (5) completion and a Wave (1) reset failure.
Momentum: Integrates an RSI divergence model to catch slowing buying volume at structural peaks.
15-Bar Window: Uses a mandatory 15-bar verification window to ensure structural candles close fully.
Timing: Optimized for volume expansion during the high-liquidity London and New York Kill Zones.
Multi-Market: Functions universally across Crypto, Forex, Stocks, and Nifty (5-Minute chart).
Analysis
The Peak: During New York hours, Bitcoin established an exact structural high of $78,080
(HH (1) peak).
The Divergence: The RSI registered a clear Lower High. This divergence provided confirmation at the $77,000 level immediately after the trapping candle closed, exactly as per the New York Kill Zone. This framework works systematically during both London and New York Kill Zones across all assets.
The Lock-in: The 15-bar validation window completed its cycle, confirming that sellers defended the resistance zone.
The Move: Following this alignment, the market reacted downward from the peak to the current level of $74,904.
Risk Management (SL & TP)
Dynamic Stop Loss: Calculates volatility over a 14-period window. It projects an invalidation line exactly 2.5 × ATR above the trapping candle high to protect against normal retail noise.
Dynamic Take Profit: Targets a fixed distribution zone projected at 7.5 × ATR below the entry candle close.
1:3 Risk-to-Reward: Because the target (7.5\times{ATR}\)) is exactly triple the risk (2.5\times\{ATR}), the framework enforces a mathematically locked 1:3 Risk-to-Reward Ratio to match active market volatility.
Parameters
Validation Level (Post-Trap): $77,000
Current Price: $74,904
Invalidation Level (2.5× ATR SL): $78,100
Target Zone (7.5× ATR TP): $74,000
Disclaimer
This post is shared strictly for educational and informational purposes to demonstrate market geometry. It does not constitute financial, investment, or trading advice. Trading digital assets involves high risk. Always manage your risk strictly. Short 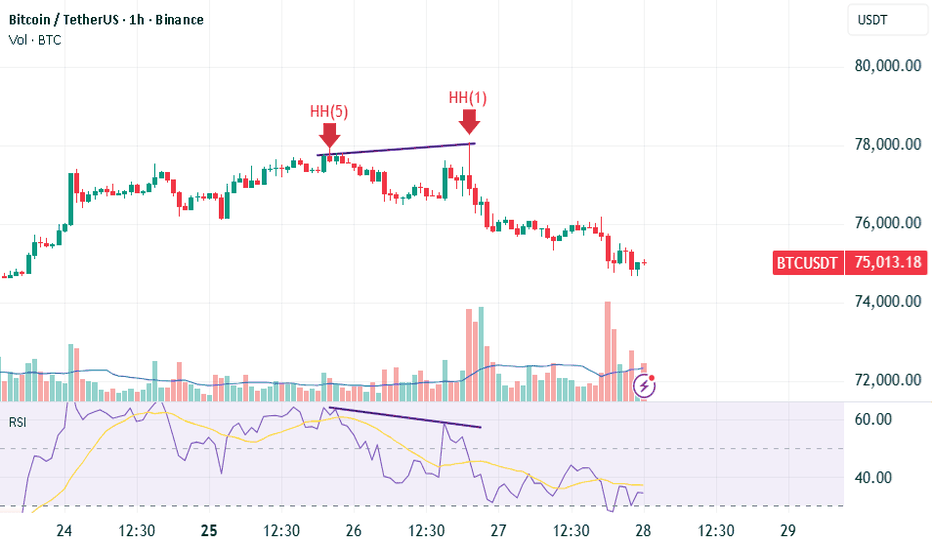
Long