BTCUSD 4H Analysis: Navigating Discount Arrays & Liquidity PoolsMarket Context & Structure
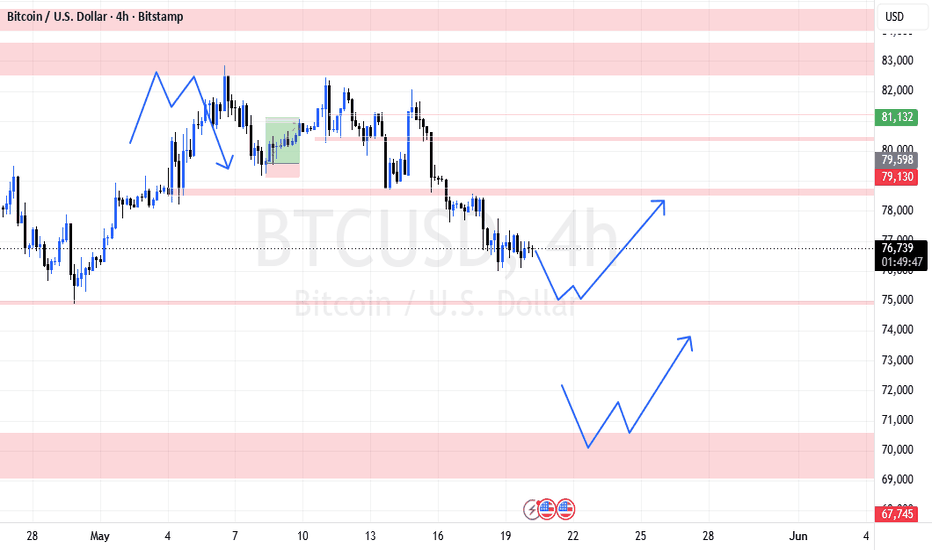
Bitcoin (BTCUSD) recently faced heavy distribution near the $82,000+ region, leading to an aggressive bearish displacement that broke local market structure to the downside. Currently trading around $76,750, price action is consolidating in a transitional zone. Rather than forcing trades in the middle of this range, the most strategic approach is to wait for price to deliver into high-probability discount Points of Interest (POIs) to hunt for accumulation.
Technical Breakdown & Anticipated Scenarios
Based on the mapped demand blocks (red zones), we are tracking two primary paths for a potential bullish reversal, as indicated by the projections:
Scenario 1: The $75,000 Liquidity Sweep & Mitigation
The immediate downside target is the demand zone resting at the $75,000 psychological level. The projected path anticipates a sweep of sell-side liquidity (SSL) just below current consolidation, tapping into this block. If buyers step in to defend this level, we are looking for a structural shift to target the $78,000 - $79,000 supply zone (previous support turned resistance).
Scenario 2: Extreme Discount & Deep Accumulation ($70,000 Zone)
If bearish momentum sustains and slices through the $75k POI, the draw on liquidity will point heavily toward the extreme demand zone near $70,000. This level represents a massive structural floor. A deep plunge into this extreme discount area offers a high-reward macro setup. Accumulation here would provide the fuel needed for a strong rally back toward the $73,000 - $74,000+ fair value levels.
Trading Plan & Execution
Patience is critical. The middle of the range is for observation, the extremes are for execution.
Directional Bias: Macro Bullish, but heavily reliant on finding strong support in discount zones.
Entry Criteria: Set alerts for the $75,000 and $70,000 zones. Do not use blind limit orders. Once price taps these POIs, drop down to the 15m or 1H timeframes. Wait for the algorithm to show its hand via a clear Change of Character (CHoCH), a sweep of lower timeframe liquidity, and energetic displacement to the upside leaving a Fair Value Gap (FVG).
Invalidation: If the extreme $70,000 zone fails to hold and closes aggressively lower on the daily, the macro bullish bias must be reassessed.
Trade the reaction, not the prediction. Manage your risk closely!
(Disclaimer: This analysis is for educational purposes only and does not constitute financial advice. Always wait for your own confirmations before entering the market.)
Crypto market
Trading Oversold MarketsWhat is overbought?
When the market goes up too much, too fast — like it got overexcited. RSI crosses above 70. This means most people who wanted to buy have already bought. Not many buyers left. So the market will likely slow down or fall a bit.
What you do: don't buy now. If you're already in profit, book some of it. Keep your stop loss tight.
What is oversold?
When the market falls too much, too fast — like everyone panicked and sold everything. RSI drops below 30. Most of the panic selling is already done. So a bounce or recovery is likely coming.
What you do: don't rush in all at once. Wait for one green candle or a volume pickup as confirmation. Then buy in small parts.
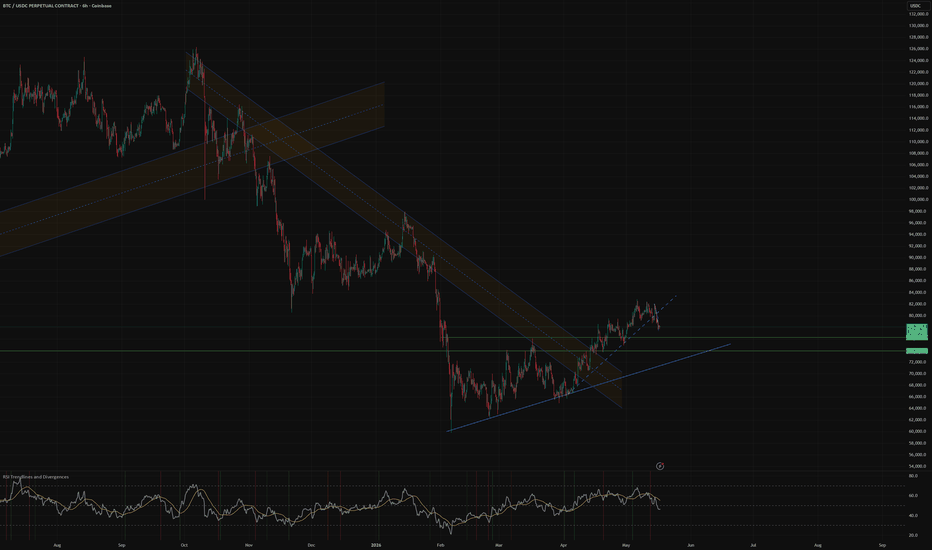
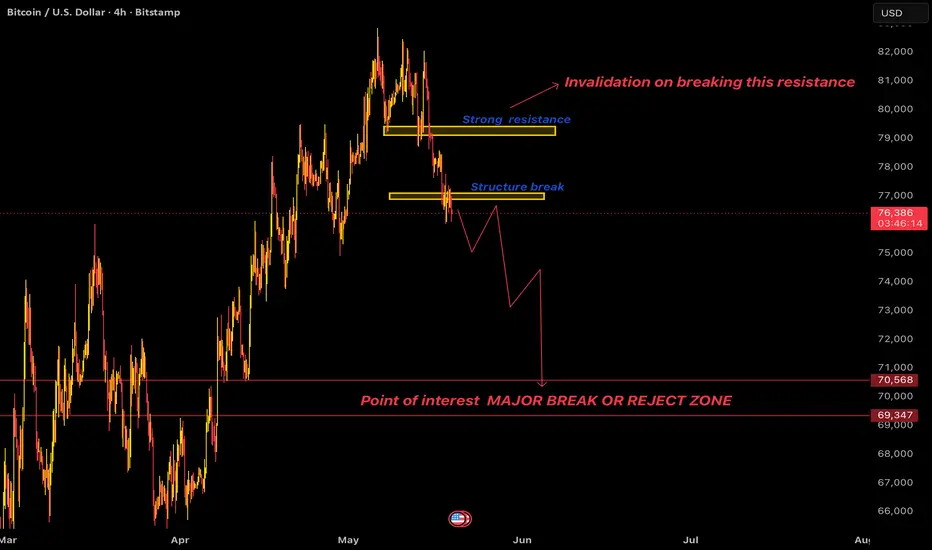
Bitcoin Structure Cracking …Breakdown Pressure Building Weekly .Bitcoin is starting to look weak after multiple failed attempts near the 79K–80K resistance zone. Every bounce is getting sold fast, and buyers are no longer showing the same strength we saw during the rally. The market tried several times to reclaim higher levels, but there’s still no clean acceptance above resistance.
Now the important part is the structure around 76–77K. Price is slowly slipping below support, and the reactions are getting weaker on every bounce. This usually happens before a larger move expands. Instead of continuation, Bitcoin is starting to shift into a corrective phase with lower highs forming across the chart.
As long as price stays below the resistance zone, the downside pressure remains active. The next major area to watch is around 70.5K–69k, which looks like the real make-or-break zone for the next big move. If sellers stay in control, Bitcoin can easily slide toward that region faster than most expect.
Right now this doesn’t look like strong accumulation. It looks more like distribution at highs before a deeper move. Bulls only regain control if Bitcoin reclaims and holds above the resistance zone with strength. Until then, rallies may continue getting faded. Trade safe.
Bias: Bearish below 79K
Invalidation: Strong breakout above 80K
Major Support: 70.5K – 69k
Watch Zone: 76.5K structure area …
BTCUSDT:Testing Key Downward Trendline at Critical Reversal ZoneIf the 2H trendline breaks, then the market direction goes upside.
Bitcoin is trading inside a key reversal zone after a prolonged corrective phase, currently testing a major descending trendline for a potential bullish breakout.
Market Structure: Bearish market structure on the 2H chart characterized by a sequence of lower highs and lower lows.
Trendline Resistance: Price action is tightly hugging a well-defined descending trendline, compressing just under the diagonal resistance.
Support & Demand: The asset has entered a crucial "Reversal Area" / demand zone between $75,650 and $76,250, showing initial signs of price absorption.
Supply References: A clear historical "Supply 2x" zone remains unmitigated above, acting as a secondary magnet if structural shifts occur.
Trading Scenarios
Bullish Trigger: A clean 2H candle close above the descending trendline confirms a market structure shift to the upside.
Bearish Continuation: Failure to break the trendline may lead to a deeper liquidity sweep below the current reversal area.
Bitcoin chart analysis May 15Hello
It's a Bitcoin Guide.
My analysis is optimized for TradingView.
If you press the Replay button, you can check real-time movements.
This is the Bitcoin 30-minute chart.
*Long Position Strategy based on the movement path of the red finger
1) After confirming the purple finger touch at the top,
the red finger at $80,072.2 is the entry point for a long position at the bottom / Stop loss if the green support line is broken.
2) $81,820 is the first target for a long position -> Target prices will be Good and Great in order over the weekend.
- If it drops immediately without touching zone 1 at the top
The second zone at the bottom, $79,646.3, is the entry point for a long position / Stop loss if the green support line is broken.
If it breaks the Bottom zone at the bottom
The next support line is $78,029.2.
Please use my analysis post only as a reference and for practical application.
I hope you operate safely by strictly adhering to trading principles and stop-loss orders.
Thank you for your hard work this week.
Have a great weekend.
Thank you.
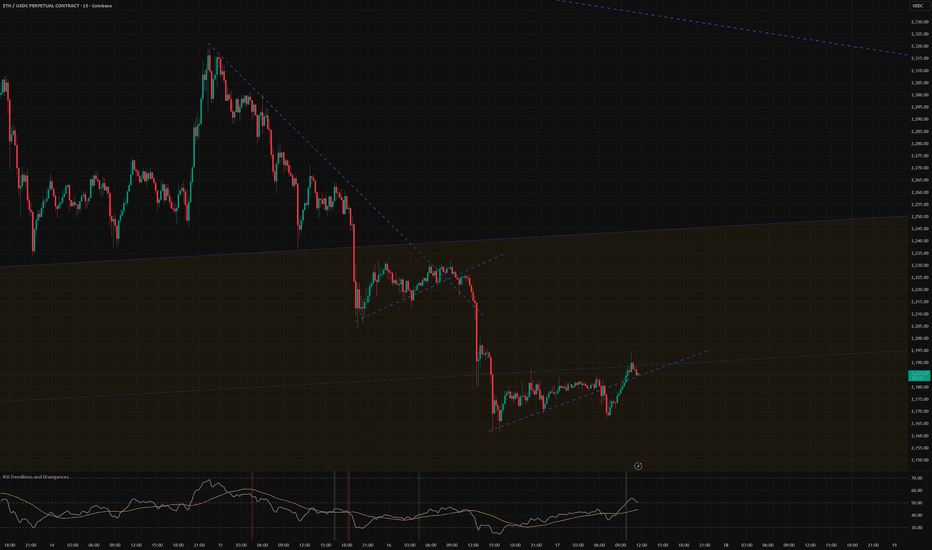
Ethereum Weakens Below Key SupportETH continues showing a bearish structure on the H4 chart after breaking below the 2,300 USD zone.
Price is forming lower highs and lower lows, while recent rebounds remain weak and quickly face selling pressure. After dropping toward 2,080 USD, ETH bounced slightly back to 2,120 USD, but the move still looks like a technical rebound rather than a confirmed reversal.
EMA34 has crossed below EMA89, and both EMAs are sloping downward — a signal that the market may be entering a short-term downtrend or distribution phase.
The key resistance zone is 2,150 – 2,180 USD. If ETH fails to reclaim this area, price could retest 2,080 USD and potentially fall toward 2,000 USD if panic selling accelerates.
Compared with Bitcoin, Ethereum currently looks much weaker, suggesting speculative money is leaving altcoins first.
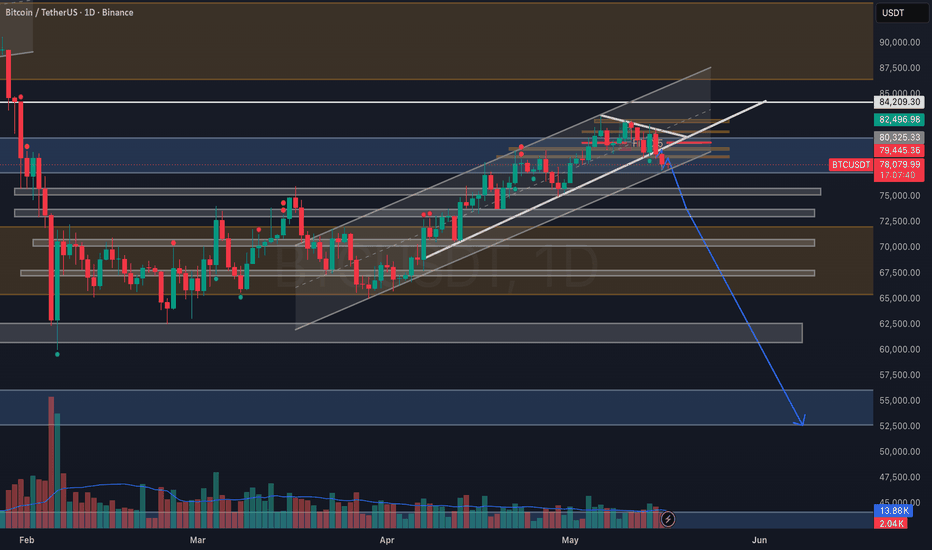
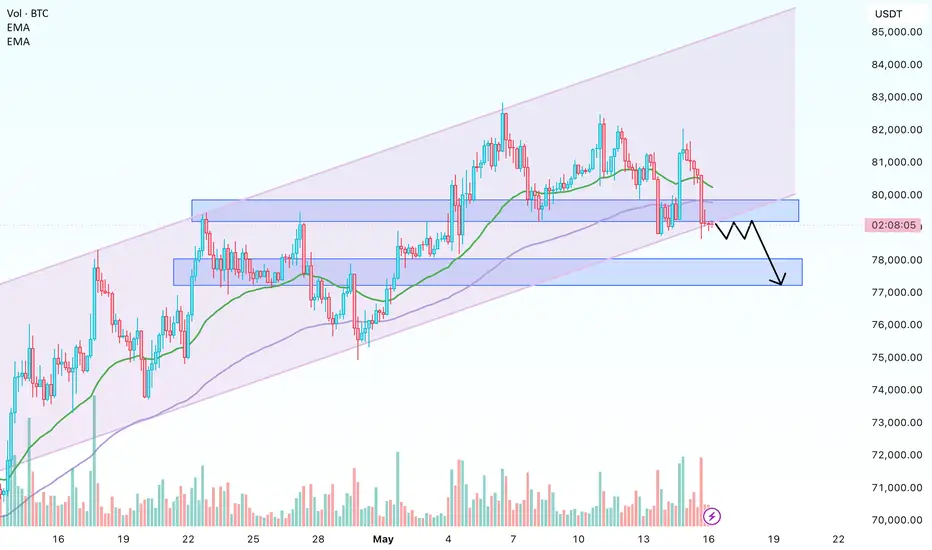
BTCUSD Retest Structure After Channel BreakdownAfter breaking out of the parallel channel structure, the market is continuing toward the downside while respecting the bearish trend. However, I believe the current bearish candle area may still get a retest before the next major move begins.
My expectation is that the market could perform a small pullback and retest the negative candle zone. If price reacts there and forms another bearish confirmation candle, then the downside continuation may become stronger.
At the same time, I also converted the previous demand area into a potential supply zone using the demand-to-supply interchange concept. Because of that, the marked lower zone is now acting as an important reversal area.
If the market reaches this zone and forms any strong positive candle or bullish confirmation, then a temporary upside reaction is also possible from that area.
For now, the market structure still looks bearish overall, but a short pullback before continuation would be completely normal. The reversal zone is already marked, and if proper retesting happens, the setup could become even cleaner.
At this stage, the next reaction around the retesting area will decide whether the market continues lower immediately or creates a short-term recovery move first.
Bitcoin Rejected From 82K ResistanceBitcoin is losing momentum after multiple failed attempts to break above 82,000 USD. On the H4 chart, every recovery is being sold into, while EMA34 is starting to turn down and move closer to EMA89.
BTC has also failed to hold above EMA34, which suggests the market may be shifting into a short-term correction phase. Sellers are now defending the 80,500 – 81,500 USD zone.
If price continues closing below 79,000 USD, BTC could sweep liquidity toward 77,000 USD, with 75,500 USD as the next downside area.
However, this is not yet a major bearish reversal. As long as Bitcoin holds above 75,000 USD, the medium-term bullish structure remains intact.
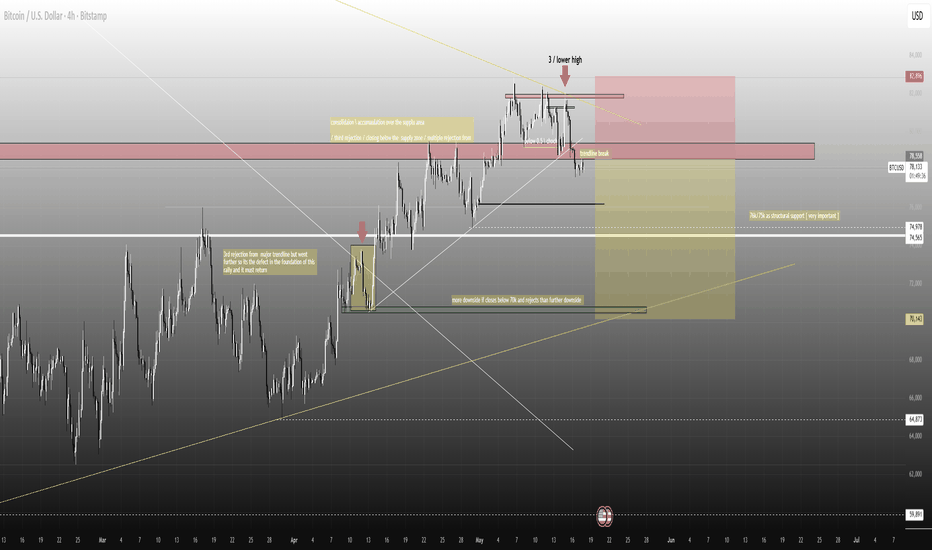
BEARISH TECHNICALS ON BTC/USDprice stopped at the supply zone, spent some days there, and after a long accumulation, has finally closed below the supply area. rejection from a trendline, breaking a trendline, has good liquidity to chase on the downside, overall trend is bearish so it is a very good area for seeing a continuation in trend from here. major hurdle will be the 75000-76000 price levels, but chances of bearish prevail so we can see further downside below 70k.
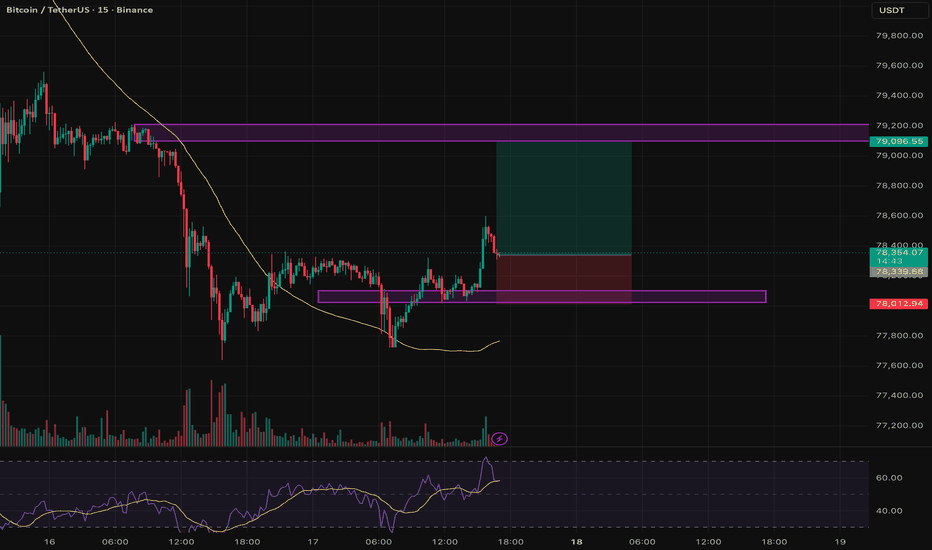
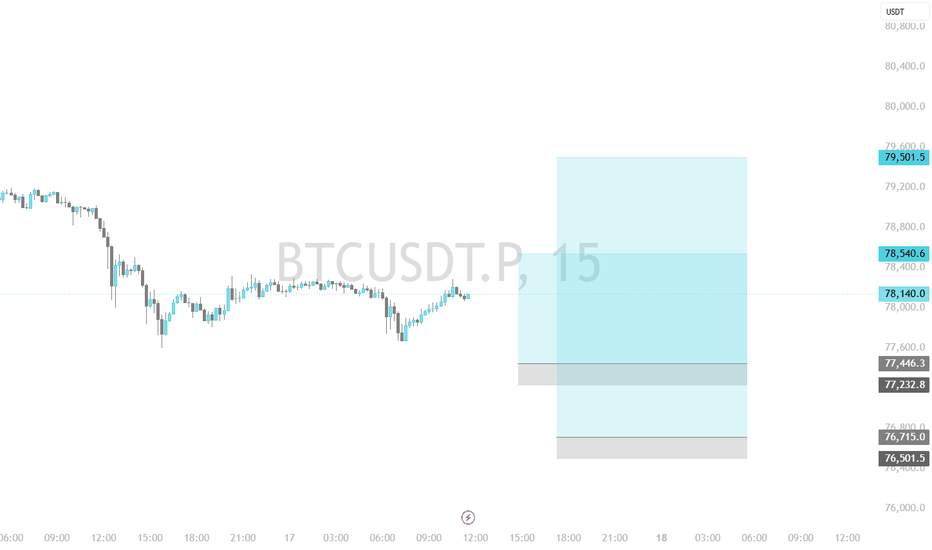
BTC/USDT — 15min Intraday Long SetupBTC is showing short-term bullish continuation after reclaiming local intraday support and establishing acceptance above the recent consolidation range. The current structure suggests buyers are attempting to continue momentum toward the nearby liquidity zone resting around previous highs.
Price is currently holding above the reclaim area while maintaining strength after the impulsive recovery move.
📍 Entry Zone:
78,250 – 78,400
🛑 Stop Loss:
78,000
🎯 Targets:
• T1: 78,800 – 78,900
• T2: 79,000 – 79,200
📊 Potential Profit:
• T1: ~0.6–0.8%
• T2: ~1–1.2%
⚖️ Estimated Risk-to-Reward:
Approx. 1:2 to 1:3 depending on entry execution.
The 15M structure continues to show higher lows forming after the earlier liquidity sweep, while the reclaim zone around 78k remains the key area bulls need to defend for continuation.
Momentum remains constructive in the short term, although lower timeframe volatility and quick liquidity sweeps should still be expected around major psychological levels.
Conservative traders may prefer waiting for pullbacks or retests into the reclaim zone before entering after impulsive candles.
Independent opinion based on price action and market structure analysis.
NOT financial advice. Always manage risk properly.
#BTC #Bitcoin #Crypto #Scalping #TradingView #Binance #PriceAction
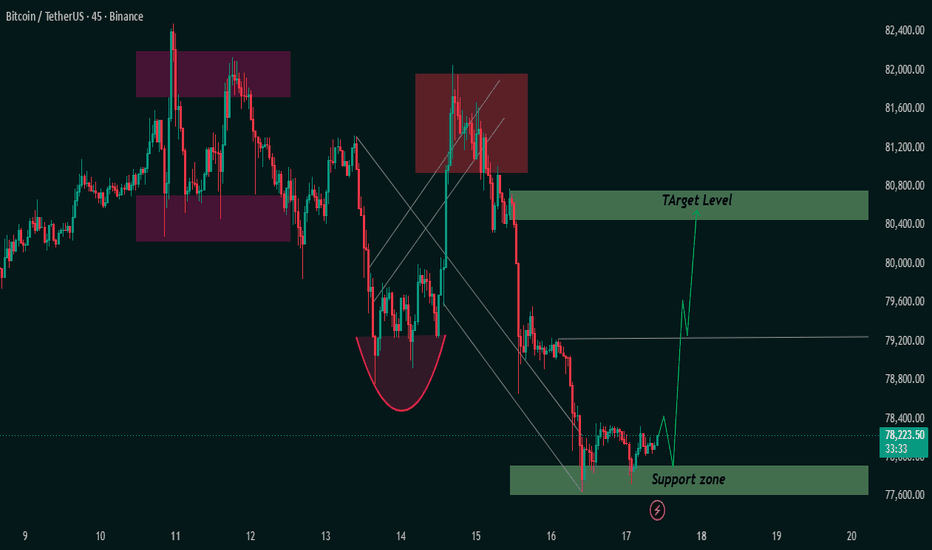
BTC/USDT Bullish Reversal Setup Targeting 80.8K ResistanceKey Observations
1. Descending Channel Breakdown Slowing
Price was moving inside a clear bearish descending channel and recently started stabilizing near the lower boundary.
This suggests the selling momentum is weakening.
2. Strong Support Zone Around 77.6K–77.9K
The highlighted green zone is acting as a demand/support area.
Multiple candle rejections occurred here
Buyers defended the level several times
Price is attempting consolidation above support
This is the most important level on the chart right now.
3. Rounded Bottom Formation
The pink curved structure resembles a rounded bottom / accumulation pattern, often seen before short-term reversals.
This indicates:
sellers losing control
gradual buyer accumulation
possible momentum shift
4. Resistance / Target Zone
The marked target area near 80.5K–80.8K is the next major resistance.
A successful bounce could push price toward this supply zone.
Bullish Scenario
If BTC holds above support and breaks minor resistance around 79.2K:
momentum could accelerate upward
short covering may fuel the move
target becomes the 80.5K–80.8K zone
Potential move structure:
Support hold
Break consolidation
Retest
Expansion toward target
Bearish Risk
If support around 77.6K fails decisively:
bearish continuation becomes likely
price may revisit lower liquidity zones
descending trend structure remains intact
Massive Macro Shift Triggering Global Risk-Off Move | BTC 72K–52A major macro-economic shift is unfolding across global markets, and it’s starting to reflect across nearly every asset class.
Money appears to be rotating aggressively out of risky assets. What’s important here is that not only equities and crypto are under pressure, but even gold is struggling — which signals broader liquidity stress rather than a normal correction.
At the same time, bond markets across multiple countries witnessed a sharp 2–3% single-day rally on Saturday. Moves like this usually indicate capital rapidly flowing into safer assets while liquidity exits high-risk markets.
Another important signal is that big money has already started positioning defensively. Major institutions and legendary investors like Warren Buffett have been reducing exposure to risky assets and increasing cash or defensive allocations over recent months. Smart money often moves early before retail fully understands the macro shift.
Possible reasons behind this sudden market transition:
• Rising global uncertainty
• War and geopolitical tensions
• Expectations of US rate cuts
• Potential changes in US Fed leadership and future monetary policy direction
• Liquidity moving from risk assets into bonds and defensive positions
If this risk-off environment continues, crypto markets could see another major leg down.
Key BTC Levels:
• 72K major support zone
• 62K possible downside target
• 52K extreme bearish scenario if macro conditions worsen
Key ETH Level:
• 1820 critical support area
Markets right now are heavily macro-driven. In such environments, technical setups can fail quickly if liquidity continues leaving risky assets.
Trade safe, manage risk properly, and avoid overleveraged positions in uncertain conditions.
Intraday Long Setup | May 17th 2026 | Valid Until Daily ClosePlan A and Plan B for Intraday setup.
Price can retrace to a strong pivot zone.
Structure remains bearish but with potential for pump back a bit after this pullback.
Tight risk control.
Watch for price reaction within the grey zone. Entry only if confirmation appears
The setup expires at end of the daily candle close.
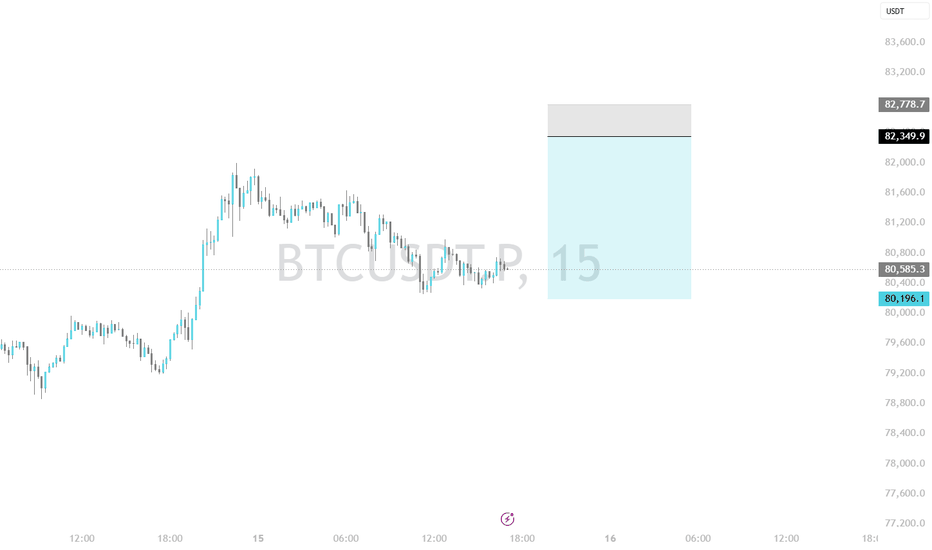
Intraday Short Setup | May 15th 2026 | Valid Until Daily ClosePrice when pushed into a potential intraday Pivot supply zone (red box) where sellers may step in. This trade is based on the expectation of a rejection from this area.
Entry: Red box - a short entry zone aligned with overhead supply
Stop Loss: Above the red zone (invalidates the setup)
Target: Green box - area to consider partial/full exit based on momentum
Risk-reward is favorable with a tight invalidation and clean downside target
Price may stall or reverse near the red box, creating short opportunity
Note:
This is an intraday trade idea that expires at 00:00 UTC (Daily Candle Close). Re-evaluate the setup if price remains indecisive near the entry zone close to that time.
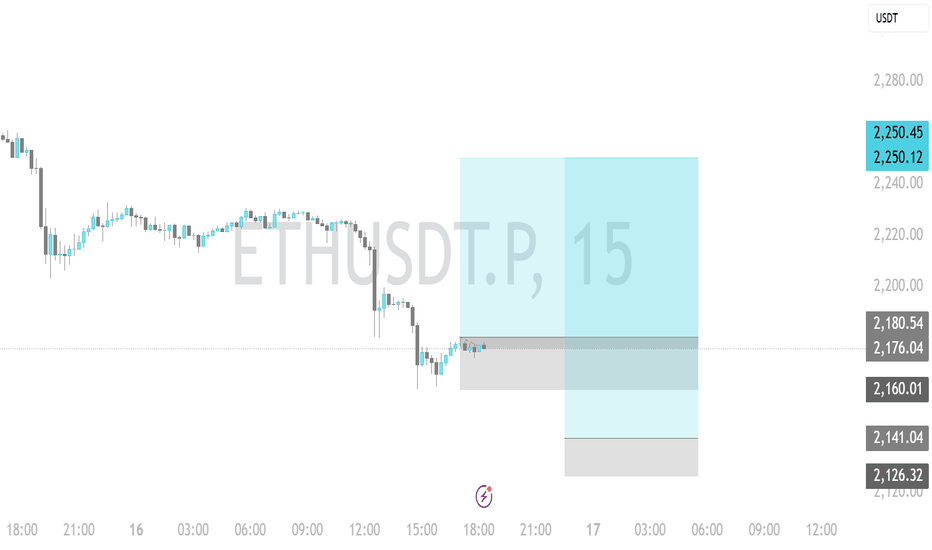
Intraday Long Setup | May 16th 2026 | Valid Until Daily ClosePlan A and Plan B for Intraday setup.
Price has retraced to a strong pivot zone.
Structure remains bearish but with potential for pump back a bit after this pullback.
Tight risk control.
Watch for price reaction within the grey zone. Entry only if confirmation appears
The setup expires at end of the daily candle close.
My BTC Technical OutlookThis is a clean, well-structured 4-hour chart of Bitcoin (BTC/USD) on Bitstamp. mapped out a clear market structure shift from a bearish phase into a textbook bullish expansion, followed by a classic corrective pattern.
The Corrective Pattern & Trendline Weakness
"3 touch make a trendline weak": annotation here is spot on from a liquidity perspective. Retail traders see a descending channel or bull flag and place their stop-losses right above that upper boundary.
By the third touch, that trendline represents a dense pool of Buy Stop Liquidity (BSL). The market naturally wants to magnetize toward these areas to engineer liquidity.
The corrective channel itself looks like a standard bull flag/descending channel, showing a healthy, low-volume contraction after a major impulse move.
The LOC (Level of Commitment / Liquidity) Zone
marked a critical horizontal level at $77,568 (and the current price hovering right around it at $78,019).
This LOC line is beautifully placed because it aligns perfectly with the previous structural swing high formed in late April. In classic technical analysis, this is prior resistance turning into support. In institutional order flow, this is a major mitigation block where buyers are stepping back in to defend the structural higher-low.
Price just swept slightly below the lower boundary of the flag to tap this LOC, effectively flushing out late longs before showing immediate signs of absorption (evidenced by the small green candles and the current teal path projection).
Technical Outlook & Potential Play
The Bounce: Price is currently validating the LOC ($77,568). If the 4-hour candle closes decisively above this level, it confirms a successful retest.
The Breakout: The target of that initial bounce will be to break the "weak" upper trendline. Once that line snaps, the triggering of retail buy-stops should accelerate price rapidly through the 0.5 Fib levels.
The Target: A clean breakout of this flag targets a retest of the recent swing high (~$82,500), with measured move extensions pointing toward psychological resistance at $85,000 and beyond as we head into June.
Key Risk Invalidations: A decisive daily close below the LOC ($77,568) would jeopardize the immediate bullish momentum, likely dragging price down to fill the deeper inefficiency/FVG left behind in the late-April impulse leg down toward $75,000.
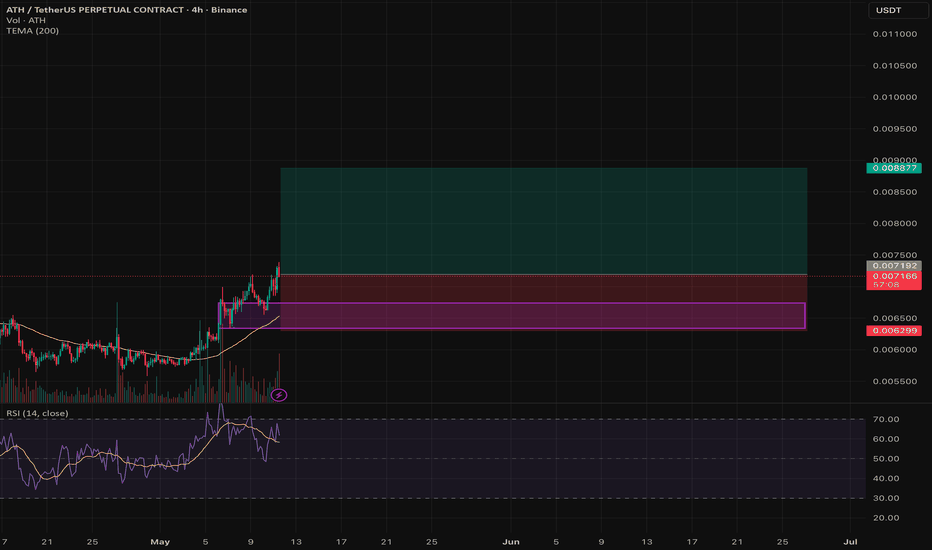
ATHUSDT — 4H Swing Long SetupATH continues to show bullish market structure after a clean reversal from the demand zone. Multiple BOS confirmations combined with strong price acceptance above previous resistance suggest continuation potential toward higher timeframe liquidity.
The recent breakout above local highs shifts momentum further in favor of buyers, while the reclaimed support region around 0.0068–0.0070 remains the key area bulls need to defend.
Setup favors continuation into the weak high / liquidity zone above if current structure holds.
📍 Entry Zone:
0.0070–0.0072
🛑 Stop Loss:
Below 0.0063 structure support
🎯 Targets:
• T1: 0.0085–0.0087
• T2: 0.0091–0.0093
Potential Profit:
• T1: ~18–22%
• T2: ~28–32%
⚖️ Risk-to-Reward:
Approx. 1:2.5 to 1:4 depending on entry execution.
Aggressive entries can be taken on continuation above current highs, while conservative entries may wait for a retest of the reclaimed support zone.
RSI remains in bullish territory and structure still favors higher highs unless key support is lost.
Invalidation occurs on a clean breakdown below the reclaimed demand zone and loss of bullish structure.
Independent opinion based purely on price action, market structure, and liquidity concepts.
NOT financial advice. Always manage risk properly.
#ATH #Crypto #Altcoins #TradingView #Binance #SMC #PriceAction
1000FLOKI/USDT.P — 4H Swing 45% Long Setup1000FLOKI continues to show bullish continuation potential after reclaiming a key support region and holding above the recent breakout area. Price is compressing beneath higher timeframe resistance while momentum remains relatively strong, suggesting possible expansion toward overhead liquidity if support holds.
The current structure favors continuation as long as the reclaimed demand zone remains intact.
📍 Entry Zone:
0.0365 – 0.0370
🛑 Stop Loss:
0.0338 – 0.0342
🎯 Targets:
• T1: 0.042 – 0.045
• T2: 0.055 – 0.060
📊 Potential Profit:
• T1: ~15–22%
• T2: ~45–60%
⚖️ Estimated Risk-to-Reward:
Approx. 1:2 to 1:4 depending on entries and position management.
The higher timeframe chart is beginning to show compression below a major resistance region while buyers continue defending higher lows. A successful hold above the reclaim zone could lead to a stronger move into the daily supply area.
Conservative traders may prefer waiting for retests of support before entering, especially considering meme coin volatility and potential liquidity sweeps.
Independent opinion based on price action and market structure analysis.
NOT financial advice. Always manage risk properly.
#FLOKI #1000FLOKI #Crypto #Altcoins #TradingView #Binance #PriceAction
1Long
ENS/USDT.P — 40% Daily Breakout Continuation SetupENS is showing strong bullish continuation after reclaiming a major consolidation range and establishing acceptance above previous resistance. Momentum and volume expansion suggest buyers are beginning to regain higher timeframe control after months of compression.
Price is now attempting to build continuation toward the next major liquidity zones overhead while holding firmly above the reclaimed support region.
📍 Entry Zone:
7.20 – 7.45
🛑 Stop Loss:
6.68
🎯 Targets:
• T1: 8.20 – 8.50
• T2: 10.50 – 10.80
📊 Potential Profit:
• T1: ~12–18%
• T2: ~40–48%
⚖️ Estimated Risk-to-Reward:
Approx. 1:2 to 1:4 depending on entry execution and position management.
The higher timeframe structure continues to strengthen as price holds above the breakout area instead of immediately rejecting. Volume expansion and RSI strength also support the possibility of further continuation if the reclaim zone remains protected.
Conservative traders may prefer waiting for short-term consolidation or retests before entering, especially after the recent impulsive move.
Independent opinion based on price action and market structure analysis.
NOT financial advice. Always manage risk properly.
#ENS #EthereumNameService #Crypto #Altcoins #TradingView #Binance #PriceAction
ZEC/USDT — 15% 4H Countertrend Short SetupZEC is showing signs of short-term exhaustion after an aggressive vertical expansion move. Price is currently reacting inside a higher timeframe supply zone while momentum begins cooling following the recent impulsive rally.
The setup focuses on a possible mean reversion move back toward the reclaim area if sellers continue defending the current resistance region.
📍 Entry Zone:
565 – 585
🛑 Stop Loss:
620
🎯 Targets:
• T1: 525 – 530
• T2: 480 – 490
📊 Potential Profit:
• T1: ~7–10%
• T2: ~14–18%
⚖️ Estimated Risk-to-Reward:
Approx. 1:1.5 to 1:3 depending on entries and position management.
Despite the strong higher timeframe momentum, price is beginning to slow beneath a key liquidity zone after an extended move upward. RSI is also cooling while price remains elevated, which can sometimes precede short-term retracement or consolidation.
This remains a high-volatility setup due to the recent expansion phase, so active management and partial profit-taking may be important.
Independent opinion based on price action and market structure analysis.
NOT financial advice. Always manage risk properly.
#ZEC #Zcash #Crypto #TradingView #Binance #PriceAction