Crypto market
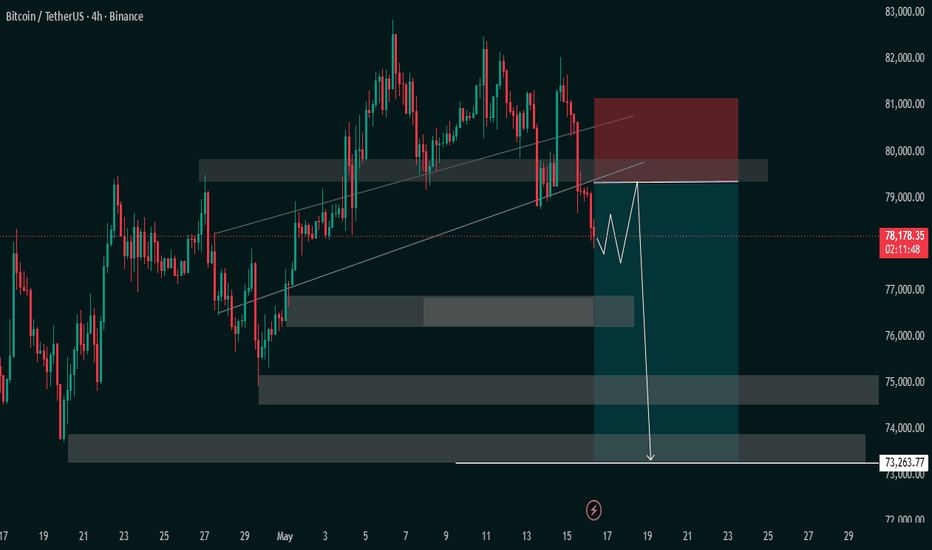
BTCUSDT 4H Bearish Breakdown Setup — Liquidity Sweep Before MajoThis 4H BTCUSDT chart is showing a bearish continuation structure after rejection from a key supply zone around 79.5k–80k.
Key Observations
Price respected the ascending trendline for several days but has now broken below momentum support.
The grey zones represent:
Supply / resistance near 79.5k–80.5k
Demand zones around:
76.3k
74.8k
73.2k (major liquidity target)
The white projected path suggests:
Small bounce/retest into resistance
Failure to reclaim 79k–80k
Strong selloff toward lower liquidity pools
Market Structure
The structure currently favors bears because:
Lower highs are forming after the rejection near 82k
Recent candles show aggressive downside displacement
Price lost short-term trend support
Retest area aligns with previous support turned resistance
Trade Idea Shown on Chart
The risk-reward box indicates:
Entry Zone: ~78k–79k
Stop Loss: Above 80.8k–81k
Target: ~73.2k
Approximate setup:
Risk: ~2%
Reward: ~6–7%
Roughly a 1:3 R:R setup
Important Levels
Resistance
79.5k
80.8k
82k
Support / Targets
76.3k
74.8k
73.2k
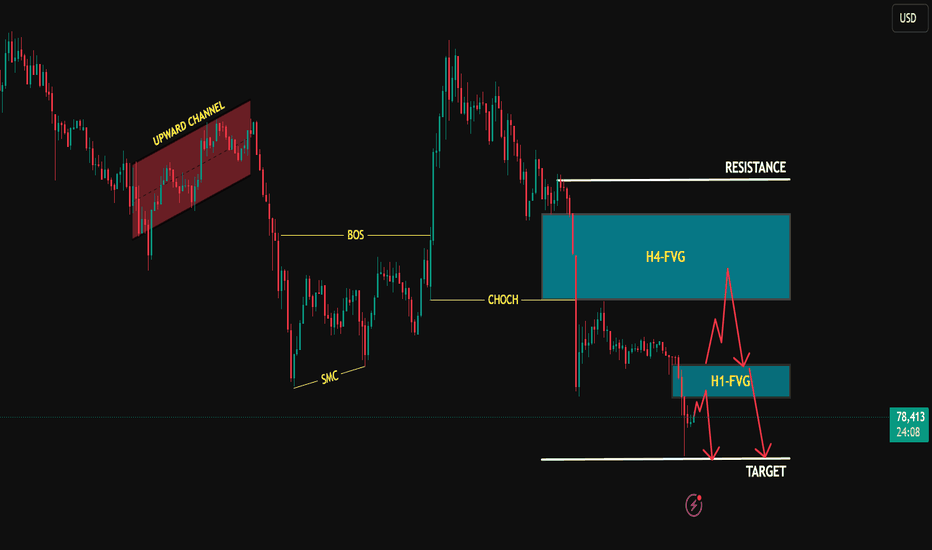
BTCUSD: Bearish Continuation After CHOCH | Target Retest AheadTechnical Breakdown
Market Structure Shift (CHOCH): The recent aggressive sell-off broke below the previous higher low, confirming a Change of Character. This invalidates the short-term bullish momentum and opens the door for further downside.
Resistance & Imbalance: Above current price action lies a major H4-FVG (4-Hour Fair Value Gap) and a clear Resistance line. This entire zone serves as a heavy supply area where sellers are waiting.
Immediate Price Action (H1-FVG): Price is currently hovering just below a smaller H1-FVG. The drawn-out path outlines two primary bearish scenarios based on how price reacts to these imbalances.
Trading Scenarios
📉 Scenario A: Immediate Rejection (Conservative Target)
If price experiences a minor pullback into the H1-FVG and fails to break above it, expect a swift continuation downward to test the immediate liquidity pool at the TARGET line.
🔄 Scenario B: Deep Retest & Fill (Premium Short)
If buyers push price higher to fill the H1-FVG, a deeper retracement into the H4-FVG / CHOCH level is likely. This would offer a highly favorable risk-to-reward (R:R) short entry as price mitigates the premium supply zone before reversing toward the ultimate TARGET.
Key Levels to Watch
Current Price: ~$78,383
Invalidation / Major Resistance: Upper boundary of the H4-FVG / Resistance line.
Downside Target: The structural swing low marked as TARGET.
Oversold MarketsWhat is overbought?
When the market goes up too much, too fast — like it got overexcited. RSI crosses above 70. This means most people who wanted to buy have already bought. Not many buyers left. So the market will likely slow down or fall a bit.
What you do: don't buy now. If you're already in profit, book some of it. Keep your stop loss tight.
What is oversold?
When the market falls too much, too fast — like everyone panicked and sold everything. RSI drops below 30. Most of the panic selling is already done. So a bounce or recovery is likely coming.
What you do: don't rush in all at once. Wait for one green candle or a volume pickup as confirmation. Then buy in small parts.
ETH/USD - Liquidity Sweep Into DemandEthereum is currently showing a Bearish Market Structure on the 30-minute timeframe after a decisive Break of Structure (BOS) below $2,228. However, price has now entered a major Demand Zone ($2,210 – $2,230) where it is currently hunting for liquidity.
The Bear Case: Price remains below the BOS line and the 200-EMA, keeping the primary trend downward. Heavy institutional selling and recent ETF outflows support this bearish pressure.
The Bull Case (Liquidity Sweep): The price is currently "sweeping" the weak lows near $2,212. If it rejects this level and closes back above $2,230, it confirms a Change of Character (CHoCH), signaling a potential reversal.
Sell Signal: If price fails to reclaim $2,228 and breaks below $2,205.
Buy Signal: If price closes a 30-minute candle above $2,230 after sweeping the lows.
Intraday Long Setup | May 12th 2026 | Valid Until Daily ClosePrice might retrace to a strong pivot zone.
Structure remains bullish with potential for continuation after pullback.
Tight risk control.
Watch for price reaction within the grey zone. Entry only if confirmation appears
The setup expires at end of the daily candle close.
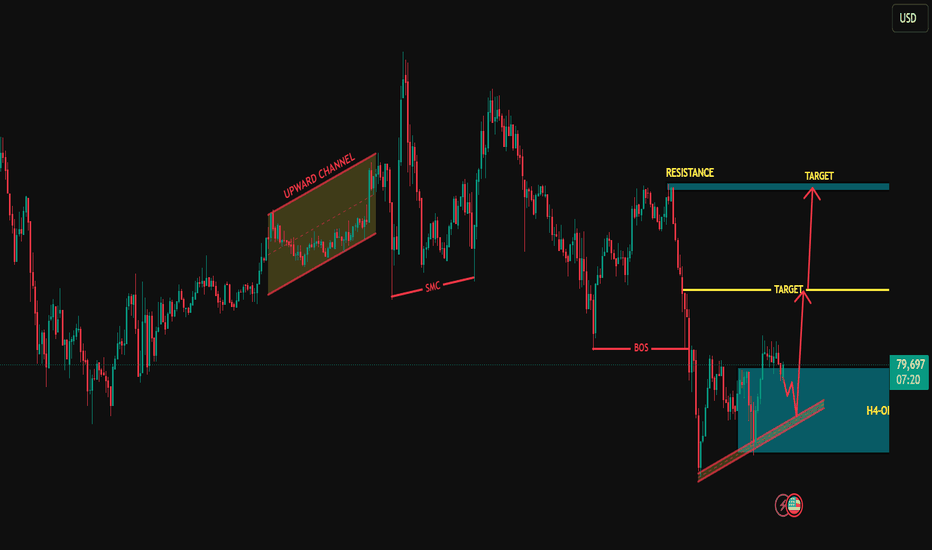
Bitcoin chart analysis May 14Hello
It's a Bitcoin Guide.
My analysis is optimized for TradingView.
If you press the Replay button, you can check real-time movements.
This is the Bitcoin 30-minute chart.
I have been experiencing difficulties recently due to timing issues.
In margin trading, you must not lose the battle of momentum.
Since the price has reached a level I recognize and a major rebound zone,
*Follow the movement path of the red finger
Chase the price and enter a long position strategy.
1) $79,153 is the entry point for the long position / Stop loss if the green support line is broken.
2) 80.4K is the 1st target for the long position -> Top is the 2nd target.
Please refer to the movement path and prices in between.
If the green support line is broken,
the bottom marked at the bottom
is open up to zone 1, so please exercise caution.
Please use my analysis post merely as a reference and for practical application.
I hope you operate safely by adhering to trading principles and strictly using stop-loss orders.
Thank you.
PREDICTION ON BTCUSD 30 MIN TFCRYPTO:BTCUSD is in a major structural change compared to the previous bearish setup.The earlier bearish continuation scenario successfully played out with a strong downside move, but the current reaction from the lower reversal zone suggests that the market may now be transitioning into a bullish recovery phase.
The earlier downside move successfully cleared liquidity resting below support and trapped late sellers into the breakdown. However, instead of continuing downward with momentum, price rapidly reclaimed internal structure and produced a strong impulsive bounce. This behavior often signals institutional accumulation rather than genuine bearish continuation.
The descending channel structure visible on the chart represents weakening bearish momentum. Sellers were able to push price lower temporarily, but they failed to sustain pressure below the demand zone. The sharp rejection from support indicates that buyers are actively defending discounted prices.
The highlighted IFC-FVG area is currently acting as the most important support region in the setup. Price reacted aggressively after entering this imbalance zone, implying that unfilled institutional orders may have existed there. In Smart Money methodology, these reactions frequently occur before a larger expansion move toward premium liquidity areas
BTCUSD currently shows signs of a Smart Money-style reversal after completing a downside liquidity sweep. The market appears to be shifting from bearish pressure into a bullish recovery structure, with upside liquidity now becoming the primary attraction.
BTC Rebound Setup From Key Support ZoneBitcoin faced a sharp rejection after completing the bearish harmonic structure near the 82K resistance area, leading to strong downside momentum. Price has now entered a critical demand zone around 78.7K where buyers are starting to react.
Current candles show signs of stabilization after the aggressive sell-off, suggesting that bearish pressure may be weakening in the short term. If BTC manages to reclaim the 80.5K resistance area, bullish continuation toward higher levels becomes more likely.
However, failure to hold the current support region could trigger another bearish wave toward the 77.7K support zone. For now, the market is showing early recovery signals from a strong technical support area.
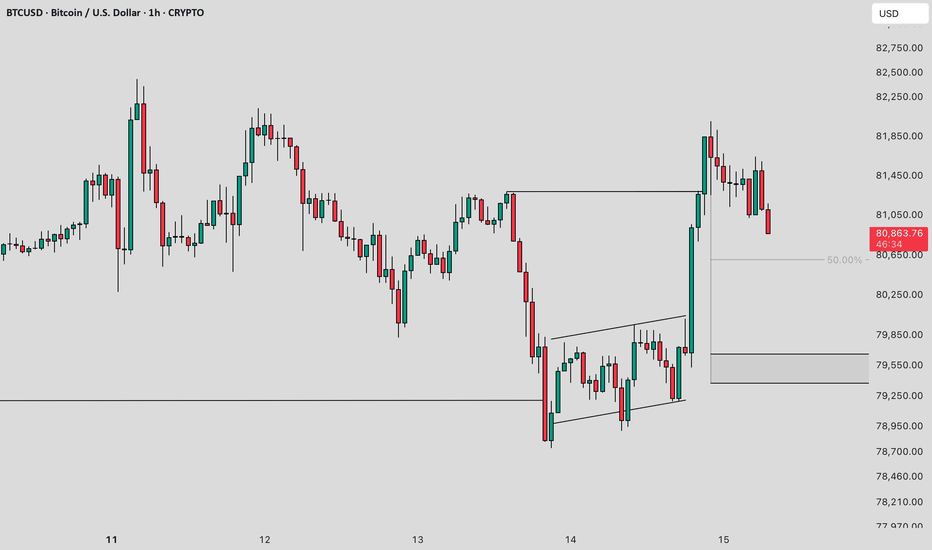
BTCUSD 1HChart Concept & Observation :
The highlighted box in this chart represents a potential support and resistance zone, where price has historically reacted and may continue to do so.
If any bullish or bearish price action pattern / candlestick formation appears near the upper or lower boundary of this box, it may indicate a possible reversal opportunity.
In some cases, the market may also respect the midpoint (50% level) of the box. Therefore, any significant price action signal forming around this level can also lead to a potential reversal.
Additionally, if liquidity zones/lines are marked above or below the box, price may be drawn toward those areas before reacting.
For better reversal confirmation, lower timeframe analysis can also be used to refine entries.
This framework helps in identifying key reaction zones, but it should always be used in conjunction with proper confirmation and risk management.
Disclaimer :
This chart is shared purely for educational and journaling purposes only. It reflects my personal market observations and thought process.
I am not a SEBI-registered financial advisor.
This is not a buy/sell recommendation, trading signal, or investment advice.
No calls or tips are being provided here.
I am simply documenting what I observe and how I interpret the market.
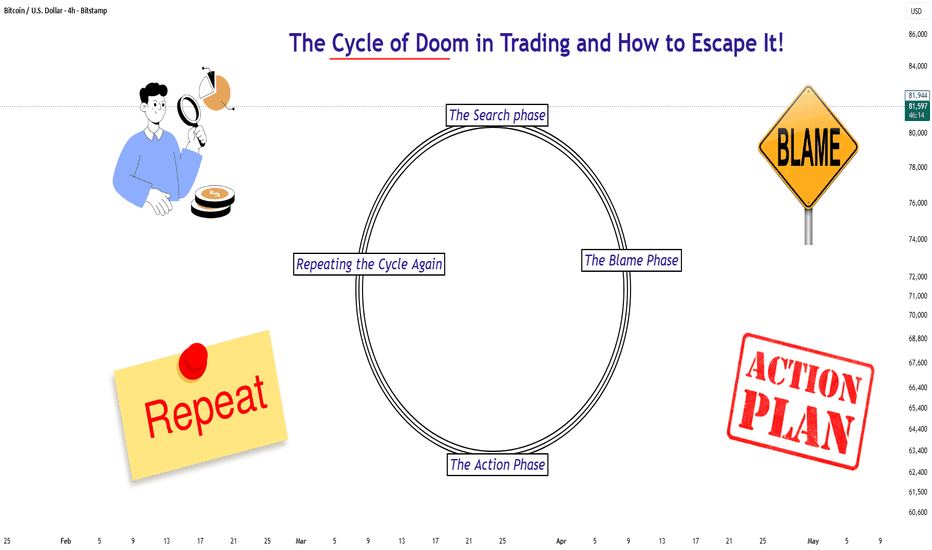
The Cycle of Doom in Trading and How to Escape It!One of the best concepts I learned from Naked Forex was the Forex Cycle. What I understood is that many traders keep making the same mistakes again and again without realizing it. Most people think they are losing because of the strategy, but the real problem is usually the trader’s mindset, emotions, and lack of consistency.
1. The Search Phase
This is the stage where traders keep searching for a trading strategy. They watch videos, read books, join trading groups, and try different indicators, hoping to find the perfect setup. Every time they see a new strategy, they feel excited and think, “This one might finally work for me.”
I think most beginners spend too much time in this phase. For example, if one strategy gives a few losses, they quickly leave it and move to another one. Instead of learning deeply about one system, they keep changing methods again and again. What I understood from this phase is that traders often believe the strategy is the key to success, while things like patience, discipline, and practice are ignored.
2. The Action Phase
This is the phase where traders finally start using the strategy in the market. At this stage, confidence becomes very high because the strategy looks good and exciting. Sometimes, traders even start making profits in the beginning, which makes them believe they have found the right system.
The problem is that most people start trading without proper testing. They enter trades with big expectations and sometimes even increase risk too early because of excitement. For example, after winning a few trades, a trader may start risking more money, thinking the profits will continue easily.
But after some time, losses and drawdowns appear. This is normal in trading, but many traders are not mentally prepared for it.
3. The Blame Phase
When losses start happening continuously, traders begin blaming the strategy. The same setup that looked perfect before suddenly feels useless. Frustration starts growing, and emotions take control.
Instead of accepting that losses are part of trading, traders think the whole system is bad. Some blame the market, some blame bad luck, and some lose confidence completely. I personally think this happens because traders expect quick success and become impatient when things don’t go their way.
This stage is dangerous because traders stop focusing on improving themselves. They immediately think the solution is to find another strategy.
4. Repeating the Cycle Again
After losing confidence in the strategy, traders go back to searching for another system, and the same cycle starts again. They find a new setup, feel excited, start trading it, face losses, blame the system, and repeat everything once more.
This was the biggest thing I understood from the chapter. Many traders are stuck in this loop for years without realizing it. They keep changing strategies but never work on discipline, patience, risk management, or emotional control.
One thing I learned from this concept is that profitable trading is not about finding a perfect strategy every month. It is more about sticking to one system, understanding it properly, managing risk, and staying consistent even during losses.
How to Save Yourself from This Cycle
The best way to avoid this cycle is by stopping the habit of changing strategies after every loss. No strategy works all the time perfectly, and losses are a normal part of trading. Instead of searching for something new again and again, it is better to spend time understanding and improving one system properly.
I also understood that patience and discipline matter more than excitement. Many traders become emotional after a few wins or losses and start making random decisions. For example, after losing trades, people often switch strategies immediately without even giving the system enough time.
Proper risk management is another important thing. Risking too much money creates pressure and emotional trading. Keeping risk small helps traders stay calm and think clearly.
The main lesson I learned is that consistency in trading comes more from the trader than the strategy. A calm mindset, patience, and discipline are what really help in the long run.
We will return soon with more trading lessons, psychology insights, and new learning experiences. Stay connected!
@BrightRally_Research
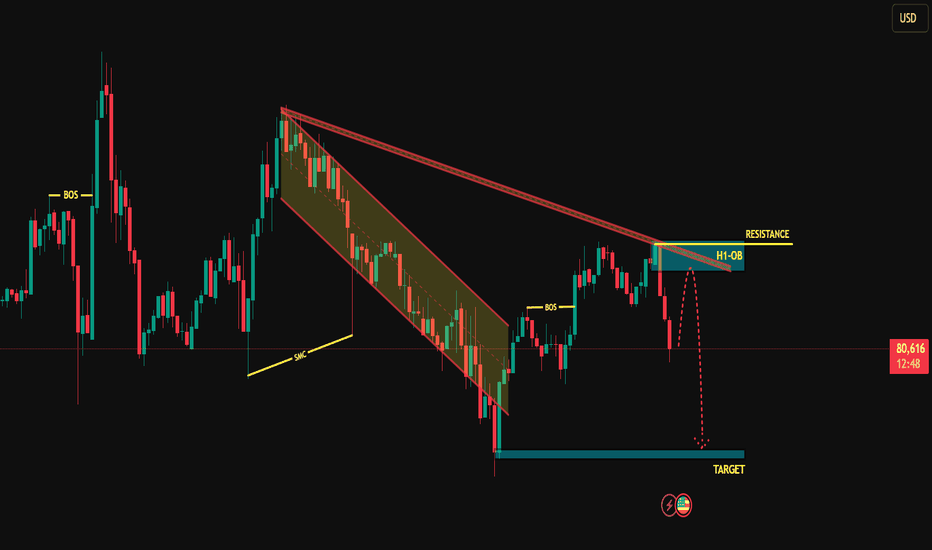
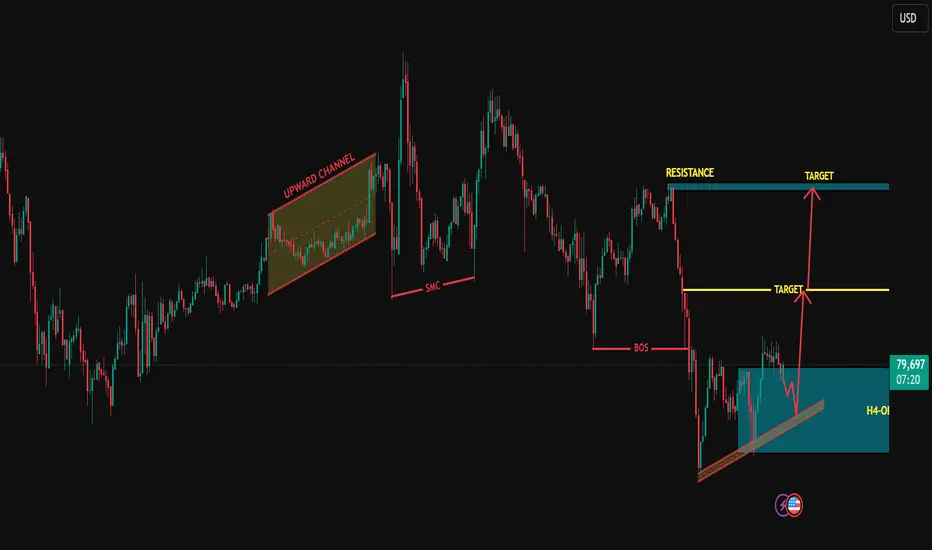
BTCUSD Facing H1 Resistance: Bearish Rejection at OB ?Key Technical Observations:
Descending Channel Breakout: Price action previously moved within a tight descending channel (highlighted in orange). While it broke out to the upside, it is now encountering heavy supply.
H1 Order Block (H1-OB): Price has rallied into a highlighted bearish Order Block on the 1-hour timeframe. This zone is acting as a primary Resistance level.
Market Structure Shift: We see multiple "BOS" (Break of Structure) labels. While the recent minor trend was bullish, the rejection at the H1-OB suggests a potential shift back to the bearish side.
SMC Logic: The "SMC" trendline indicates the underlying liquidity drive. The current setup anticipates a "Stop Hunt" or a rejection from the premium supply zone.
The Setup:
The projected path (indicated by the red dashed line) suggests a brief retest of the Resistance zone followed by a sharp move downward.
Entry Zone: 80,700 – 80,850 (Inside the H1-OB)
Invalidation (SL): A sustained candle close above the yellow "RESISTANCE" line.
Primary Target: The blue "TARGET" liquidity zone at the recent swing lows (approx. 79,800 - 80,000).
SOL Approaching Key Support — Long Swing Setup SOL is now approaching an important support zone around $91–$92, and this area could provide a good opportunity for a long swing setup. Price has pulled back, but if buyers defend this level, we may see a recovery move toward the next resistance zones.
Trading Levels:
Entry Zone: $91 – $92
Take Profit 1: $97
Take Profit 2: $106
Stop Loss: $86
Trade Type: Long Swing Trade
Risk Level: Medium
BTCUSD 1HChart Concept & Observation :
The highlighted box in this chart represents a potential support and resistance zone, where price has historically reacted and may continue to do so.
If any bullish or bearish price action pattern / candlestick formation appears near the upper or lower boundary of this box, it may indicate a possible reversal opportunity.
In some cases, the market may also respect the midpoint (50% level) of the box. Therefore, any significant price action signal forming around this level can also lead to a potential reversal.
Additionally, if liquidity zones/lines are marked above or below the box, price may be drawn toward those areas before reacting.
For better reversal confirmation, lower timeframe analysis can also be used to refine entries.
This framework helps in identifying key reaction zones, but it should always be used in conjunction with proper confirmation and risk management.
Disclaimer :
This chart is shared purely for educational and journaling purposes only. It reflects my personal market observations and thought process.
I am not a SEBI-registered financial advisor.
This is not a buy/sell recommendation, trading signal, or investment advice.
No calls or tips are being provided here.
I am simply documenting what I observe and how I interpret the market.
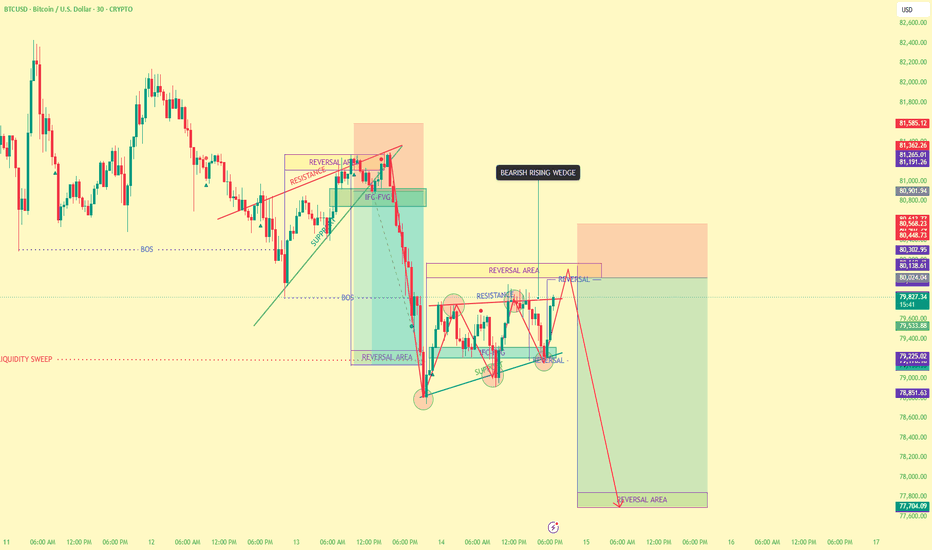
PREDICTION ON BTCUSD 30 MIN TFThe chart is showing a corrective bullish retracement inside a broader bearish environment. Price initially respected the ascending support trendline, but after the strong sell-off from the previous resistance zone, market structure shifted into a more cautious and distribution-based phase.
The current movement appears to be forming a bearish rising wedge, which is generally considered a weakening bullish structure. Buyers are still attempting to push price upward, but momentum is fading near repeated resistance zones.
The highlighted IFC-FVG (Fair Value Gap) zones are important inefficiency areas.
There is still resting liquidity above the recent equal highs near the reversal zone.
Once price breaks support decisively, the market could seek those liquidity pools rapidly.
BTCUSD currently appears to be in a distribution phase inside a bearish rising wedge.
The market is repeatedly rejecting from premium zones while compressing structurally, which often precedes a major directional move.
Bitcoin Flashing a Major Warning SignCRYPTOCAP:BTC is currently forming a rising wedge pattern, a structure that often signals weakening momentum before a breakdown.
📉 If support fails, Bitcoin could easily see a 20% correction from current levels.
Right now, price is still holding… but the structure is becoming increasingly dangerous.
The higher BTC pushes inside the wedge without a breakout, the bigger the risk of a sharp flush lower.
This is not the zone for complacency.
Bitcoin chart analysis May 13Hello
It's a Bitcoin Guide.
My analysis is optimized for TradingView.
If you press the Replay button, you can check real-time movements.
This is the Bitcoin 30-minute chart.
A MACD Dead Cross is currently in progress on the Nasdaq 12-hour chart.
It appears the direction will be determined by today's correction.
*Long Position Strategy based on the movement path of the red finger
1) $80,446.7 is the entry point for a long position / Stop loss if the green support line is broken
2) $81,687.6 is the first target for a long position -> Top and Good target prices after tomorrow
If the strategy is successful, the red finger at $81.2K serves as a re-entry zone for the long position.
If a strong correction occurs on the Nasdaq,
the bottom zone is today's major support line.
(6+12 pattern, the level targeted yesterday)
Please be cautious, as the market could fall to zone 1 depending on the correction.
Please note that a strong rise is possible starting tomorrow following today's correction.
Please use my analysis merely as a reference and for practical purposes.
I hope you operate safely by strictly adhering to trading principles and implementing stop-loss orders.
Thank you.
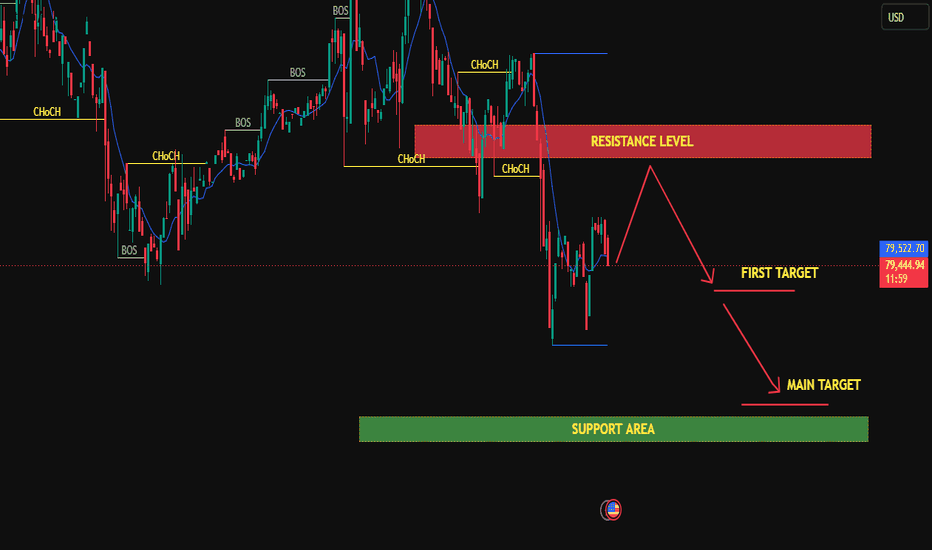
BTC/USD Bearish Retest from ResistanceBitcoin is showing a strong bearish structure after multiple ChoCH (Change of Character) confirmations and a sharp rejection from the highlighted resistance zone. The recent breakdown suggests sellers remain in control while price struggles to reclaim higher levels.
📊 Market Analysis
Price failed to sustain bullish momentum near resistance.
Multiple bearish structure shifts indicate continuation to the downside.
The highlighted resistance zone is acting as a key supply area.
Current price action suggests a possible retest before another bearish leg lower.
🎯 Downside Targets
🔻 First Target: Near short-term liquidity below current lows
🔻 Main Target: Major support area highlighted in green
⚠️ Invalidation
A strong bullish breakout and close above the resistance zone could invalidate the bearish setup.
🧠 Trading Idea
📌 Watch for rejection candles inside the resistance zone
📌 Sellers may target liquidity resting below recent lows
📌 Risk management is essential during volatile BTC moves
🚨🐻📉 “Smart money often retests resistance before continuing the real bearish expansion.”
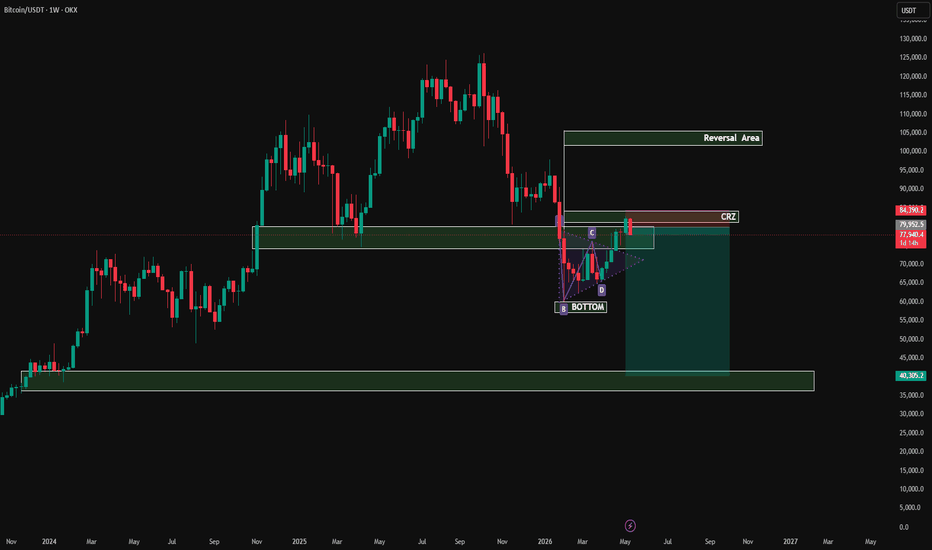
BTCUSD Bearish Reversal Zone SetupThe overall market structure is currently bearish, so I am maintaining a downside bias and preparing for a bearish continuation setup.
Looking at the structure, demand is gradually becoming weaker while supply pressure is entering the market more aggressively and with stronger momentum. This imbalance shows that sellers are currently controlling the structure.
The previous demand zone has already shown signs of exhaustion, and price is now approaching an important reversal zone. If the market forms any strong negative candlestick pattern inside this area, it could trigger another downside move.
For now, the main focus is on bearish confirmation around the reversal zone. If sellers react strongly from this level, the market may continue pushing lower and follow the existing bearish structure.
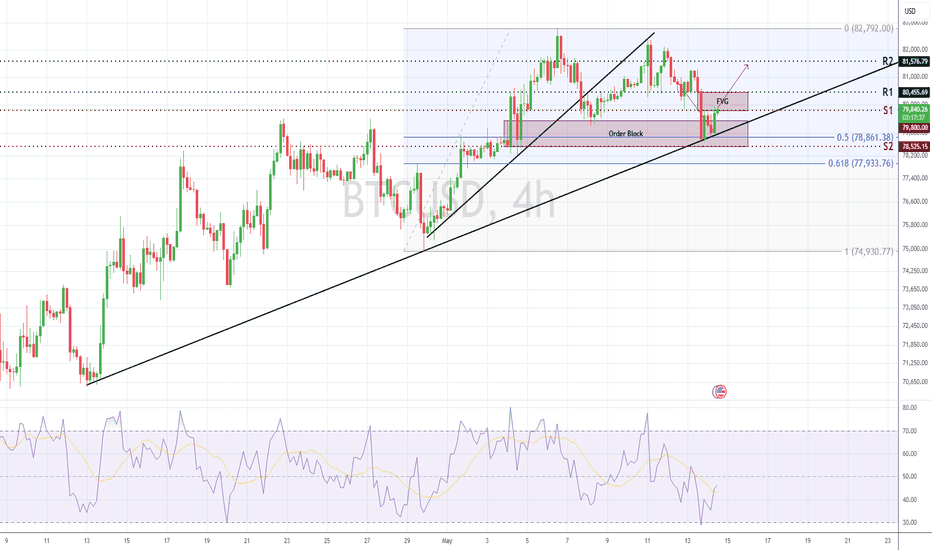
Bitcoin AnalysisThe primary trend of Bitcoin is bullish.
It is currently bouncing after taking support of the ascending trendline and the order block.
However, the FVG is acting as a crucial resistance, a breakout of which will drive prices to higher resistance zones.
Key Levels: R1 : 80450 R2 : 81500
S1 : 79800 S2 : 78500
Alternative Scenario: If price fails to hold above 80,450, but fall below 79800. Then bearish momentum may increase toward lower support zones.
BTCUSD: Bearish Rejection at H1 Order BlockTechnical Breakdown
H1 Order Block (H1-OB): Price has mitigated a clear 1-hour bearish order block, which aligns with the structural RESISTANCE line.
Break of Structure (BOS): We have observed multiple "BOS" markers on the chart, indicating a shift in momentum. The most recent rejection at the H1-OB suggests the current bullish retracement is losing steam.
Trend Alignment: The overall narrative follows the "SMC" (Smart Money Concepts) logic, where the price seeks liquidity. The failure to break above the identified resistance suggests a "lower high" is being formed.
Price Action: The red dotted projection shows an expected path: a brief retest of the supply zone followed by a sharp impulsive move downward.
Trade Parameters
Entry Zone: Re-entry on a lower timeframe (LTF) confirmation within the H1-OB (approx. 80,700 - 80,800).
Stop Loss: Placed just above the recent swing high and the yellow RESISTANCE line to invalidate the bearish thesis.
Take Profit (Target): The primary liquidity draw is the TARGET zone marked at the previous swing lows (approx. 80,400 area).
(BTCUSDT.P) 45-Min — Curved Distribution Into Reversal ZoneMarket gives the bullish momentum when the (curve line) breaks
The current market structure on the 45-minute chart suggests that BTC is completing a classic curved distribution pattern, where price gradually loses bullish momentum before accelerating into a liquidation-driven selloff.
What makes this setup technically important is the proportional decline behavior:
1) The first leg down established the initial impulsive move (1x).
2) The second expansion leg extended approximately 2x the initial displacement, confirming bearish momentum acceleration.
3) Price is now approaching a major reaction zone around 78.6k–78.8k, where liquidity and short-term demand are likely concentrated.
Reversal area should not immediately be interpreted as a guaranteed bottom. Instead, traders should monitor for confirmation signals such as:
A)absorption wicks,
B)bullish displacement candles,
C)reclaim of short-term structure,
D)or volume expansion on rebounds.
As long as BTC remains below the descending curve resistance and intraday lower highs continue forming, bearish pressure technically remains dominant.
Key Levels
Resistance: 79.8k → 80.6k
Intraday Supply: 81.0k → 81.8k
Reversal Demand Zone: 78.6k → 78.8k
Breakdown Risk Below: 78.5k
Patience and confirmation remain essential while BTC trades inside this accelerated bearish curve structure.
BTC Pulls Back but 78K Remains Key SupportBitcoin is correcting after facing strong selling pressure near the 82,000 USD resistance zone. Price is now trading around 79,300 USD, with the 78,000 – 79,000 USD area becoming the most important short-term support.
If BTC holds this zone and selling volume continues to fade, a recovery toward 82,000 USD remains likely. A stronger breakout could later open the path toward 85,000 USD.
The main pressure comes from stronger US inflation data, which has kept Treasury yields and the dollar elevated. With markets reducing expectations for Fed rate cuts this year, risk assets like crypto are facing more cautious capital flows.
Oil prices rising due to Iran tensions also add inflation risk, pushing some funds to lock in profits from Bitcoin and Nasdaq.
Still, spot Bitcoin ETF flows remain relatively stable, while long-term institutional accumulation continues to support BTC’s broader structure.