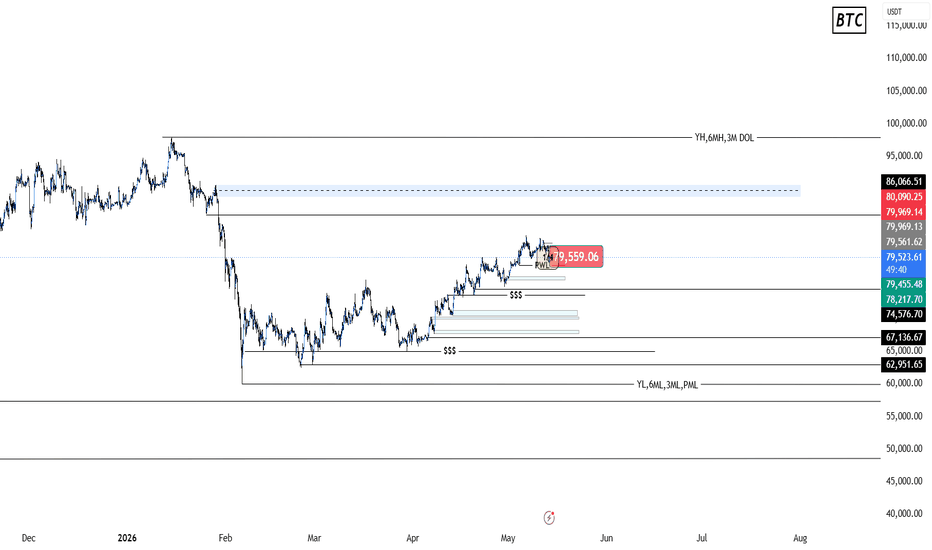
next price of btc move like i draw on my chart according to menext price of btc move like i draw on my chart according to menext price of btc move like i draw on my chart according to menext price of btc move like i draw on my chart according to menext price of btc move like i draw on my chart according to menext price of btc move like i draw on my chart according to menext price of btc move like i draw on my chart according to menext price of btc move like i draw on my chart according to me
Crypto market
eth next zone to see price to tap and respect these areaeth next zone to see price to tap and respect these area according to my analsysis eth next zone to see price to tap and respect these area according to my analsysiseth next zone to see price to tap and respect these area according to my analsysiseth next zone to see price to tap and respect these area according to my analsysis
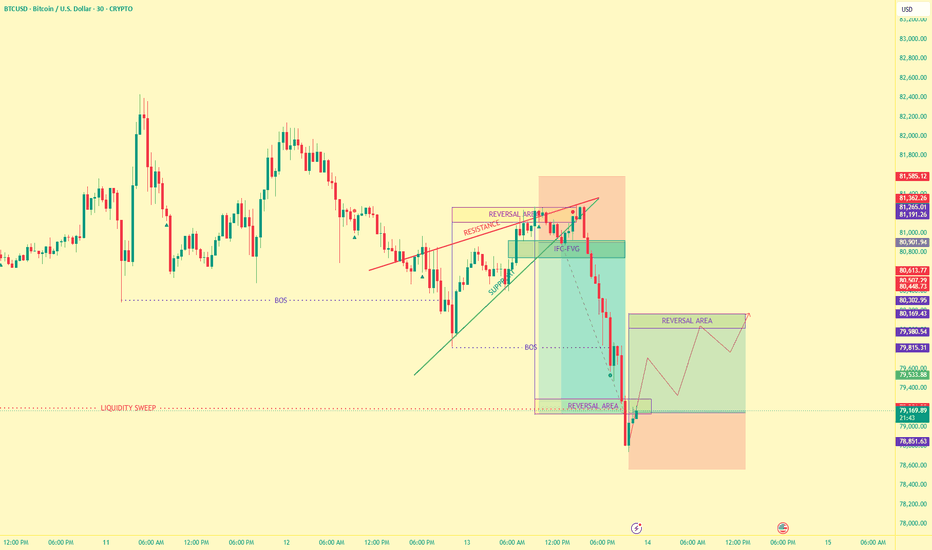
PREDICTION ON BTCUSD 30 MIN TFBTCUSD delivered a very clean setup on the 30-minute timeframe. The market first created bullish confidence, trapped breakout buyers near resistance, and then aggressively sold off after taking liquidity from the top.
Initially, BTC was forming higher lows and slowly pushing upward with bullish momentum. The trendline support and rising structure made traders believe that the market was preparing for a breakout toward higher prices.
Before the drop happened, BTC moved into the reversal area and IFC-FVG zone.
This area acted as a premium pricing zone where institutions usually look for sell entries.
Price entered the zone multiple times but failed to sustain above it. Every bullish candle inside the area showed weak continuation and lack of strong buying pressure.
BTC finally reached the major downside liquidity area near 79,000
BTCUSD has completed a bearish setup with a clean liquidity sweep, IFC-FVG rejection, bearish BOS, and strong downside delivery into sellside liquidity.
Now it can give a short buyside pullback
BTCUSD 30MChart Concept & Observation :
The highlighted box in this chart represents a potential support and resistance zone, where price has historically reacted and may continue to do so.
If any bullish or bearish price action pattern / candlestick formation appears near the upper or lower boundary of this box, it may indicate a possible reversal opportunity.
In some cases, the market may also respect the midpoint (50% level) of the box. Therefore, any significant price action signal forming around this level can also lead to a potential reversal.
Additionally, if liquidity zones/lines are marked above or below the box, price may be drawn toward those areas before reacting.
For better reversal confirmation, lower timeframe analysis can also be used to refine entries.
This framework helps in identifying key reaction zones, but it should always be used in conjunction with proper confirmation and risk management.
Disclaimer :
This chart is shared purely for educational and journaling purposes only. It reflects my personal market observations and thought process.
I am not a SEBI-registered financial advisor.
This is not a buy/sell recommendation, trading signal, or investment advice.
No calls or tips are being provided here.
I am simply documenting what I observe and how I interpret the market.
Bitcoin chart analysis May 12Hello
It's a Bitcoin Guide.
My analysis is optimized for TradingView.
If you press the Replay button, you can check real-time movements.
This is the Bitcoin 30-minute chart.
The CPI indicator will be released shortly at 9:30.
The MACD Dead Cross on the daily chart, which I explained yesterday, is becoming established.
A correction is also underway on the Nasdaq.
Based on the Gap 10 at the bottom, I made my move around the 6+12 zone.
*Long Position Strategy (Following the red finger movement path)
1) $79,763.4 Long Position Entry Zone / Stop Loss if Green Support Line is broken
2) $81,184.8 Long Position Target Price -> Target prices in the order of Top, Good after tomorrow
If the strategy is successful, you may use $80.7K after tomorrow as a re-entry zone for the long position.
However, please be cautious, as a break below the green support line could lead to a Bottom -> a drop up to Zone 1.
Please use my analysis merely as a reference and for practical purposes.
I hope you operate safely by strictly adhering to trading principles and implementing stop-loss orders.
Thank you.
BTCUSD FMFR Setup Inside Parallel ChannelThe market is currently trading inside a parallel channel structure, and price action is showing weakening demand over time. Buyers are gradually losing momentum, while supply is entering the market more aggressively and with stronger reactions.
At the moment, the overall structure remains range-bound inside the channel.
The market recently broke the previous high, and on the 1H timeframe a negative candle has already appeared. However, that candle is still considered an inside candle, and inside candlestick patterns often fail without a proper breakout confirmation.
For now, the real move will likely begin only after price breaks outside of this range structure.
My main focus is on an FMFR setup — First Move Fake Than Reversal. Ideally, I want to see the market first create a fake move toward the upside, trap breakout buyers, and then form a strong negative candle inside the marked reversal zone. If that confirmation appears, the market could start moving toward the downside.
Another important point is the current bearish candle inside the zone. If sellers want to maintain control, then the market needs to close below the body of that bearish candle on the 1H timeframe. Only then would the downside continuation become more reliable.
For now, price is still reacting inside the structure, and the next confirmed breakout will likely decide the true direction of the market.
BTCUSDT Analysis 15 Min : Rounded Top & Support Reversal PlayPattern: Well-defined "Arc" or Rounded Top formation following a strong early-morning bullish rally.
Current State: Price is breaking down from the curved resistance dome, demonstrating short-term bearish momentum up to Reversal Area.
Key Technical Zones
Immediate Support: Major demand zone identified between 80,800.0 – 80,850.0 (Reversal Area).
Upside Target: Projected resistance and take-profit liquidity zone located around 81,420.0 – 81,480.
Trading Strategy
The Play: Look for a liquidity sweep into the lower Reversal Area to exhaust sellers.
Execution: Confirm bullish price action (e.g., pin bars, engulfing candles) at the Reversal Area before entering longs.
Risk Management: Follow the Risk to Reward Ratio Atleast 1:2, Use only 1% of your total capital.
PEDICTION ON BTCUSD 30 MIN TF BTCUSD is reacting from a major premium reversal zone after sweeping short-term liquidity and tapping into an institutional supply area. The chart structure suggests a potential bearish continuation scenario as price fails to sustain above the IFC zone.
The market has already swept upside liquidity and mitigated institutional zones. The remaining objective appears to be the collection of sellside liquidity resting beneath recent lows.
One of the biggest reasons this setup remains bearish is the amount of untapped sellside liquidity resting below current price.
BTCUSD currently remains bearish below the IFC premium zone. The recent liquidity sweep combined with repeated rejection from reversal areas suggests smart money may continue distributing positions toward lower liquidity targets.
A clean breakdown below short-term support could accelerate downside delivery into the 79K region.
ETH Approaching Major Order Block Support — Bounce Setup in PlayEthereum is currently approaching a strong higher timeframe order block near the 2250 support zone. This area has previously shown strong buyer interest, and price reacting from this level could trigger a solid short-term recovery move.
The current setup suggests a potential bounce opportunity if ETH manages to sustain above the support region after tapping the order block.
Key Levels
Support / Order Block Zone: 2250
Target 1: 2343
Target 2: 2435
Outlook:
If buyers defend the 2250 zone successfully, Ethereum could see bullish momentum build over the next several days. The structure remains valid as long as support holds and price confirms strength after the reaction.
Expected move duration: within the next 10 days depending on overall market conditions and momentum.
As always, wait for confirmation and manage risk properly in volatile crypto conditions.
#ETH #Ethereum #Crypto #PriceAction #OrderBlock #SupportAndResistance #TradingView #TechnicalAnalysis #Altcoins
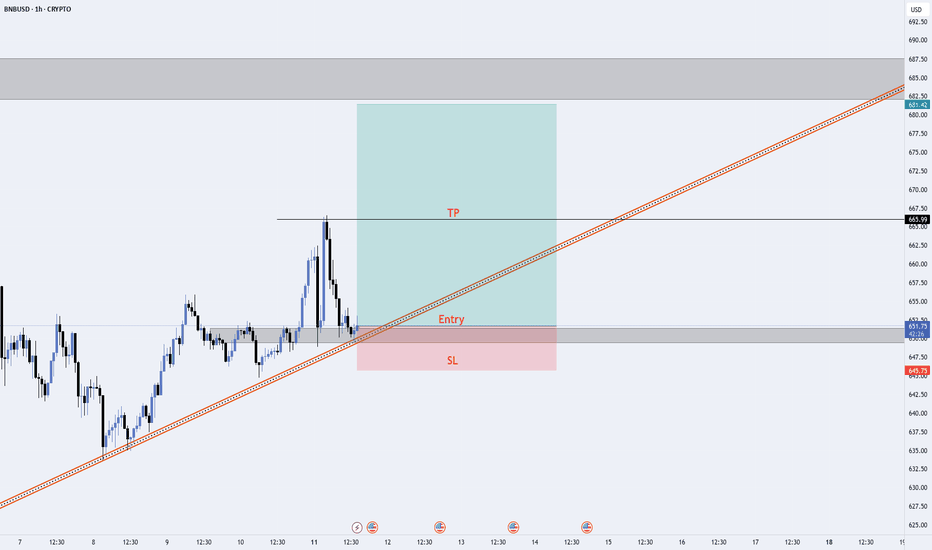
BNB Bullish Continuation SetupBNB is currently reacting from a strong ascending trendline support on the 1H timeframe.
Confluences:
Higher low structure intact
Trendline retest holding
Horizontal support zone respected
Good risk-to-reward opportunity
Trade Plan:
Entry around support reclaim
Stop loss below structure
Targeting continuation toward previous highs
As long as price holds above the trendline, bulls remain in control.
Risk management is key.
“This is not financial advice. Always manage risk properly.”
ETH/USD Bearish Continuation Idea | Descending Channel Rejection📌 Overview
ETH is currently trading inside a well-defined descending channel on the 1H timeframe, showing signs of weakness after rejecting from the upper trendline resistance.
Price failed to sustain bullish momentum and is now reacting from a key dynamic resistance area, suggesting a possible continuation toward lower levels.
This setup is based on a bearish continuation scenario within the existing downtrend structure.
📍 Analysis
🔹 Descending Channel Structure
ETH continues to respect the bearish channel formation, with price reacting cleanly from both upper and lower boundaries.
The recent rejection from the upper channel trendline strengthens the bearish outlook.
🔹Market Structure
Overall lower high formation remains intact
Sellers defended resistance aggressively
Price failed to break above channel resistance
Momentum appears weak near supply zone
🔹 Entry Logic
A short position is considered from the current rejection area, anticipating continuation toward the lower channel support.
The setup aligns with the prevailing short-term bearish structure.
🎯 Trade Setup
🟥 Short Position Idea
Entry: Near current resistance reaction
Stop-Loss: Above recent swing high / channel resistance
Take-Profit: Lower channel boundary and nearby support zone
The setup offers a favorable risk-to-reward opportunity if bearish momentum continues.
⚠️ Risk Management
Risk only a small portion of capital per trade
Setup becomes invalid if price breaks and closes above channel resistance
Conservative traders may wait for additional bearish confirmation before entry
📌 Final Thoughts
ETH remains under pressure while trading inside the descending channel structure. As long as price stays below resistance, bears may continue pushing toward lower support levels.
Publishing this setup to track market reaction and overall price behavior.
ANALYSIS OF BTCUSD 30 MIN TF BTCUSD is currently positioned within a high-probability in reaccumulation zone after completing another aggressive liquidity sweep below the 80.5K region. The recent sell-off appears less like true bearish continuation and more like engineered liquidity collection designed to rebalance price before a potential expansion toward higher external liquidity pools.
From my perspective, BTCUSD still appears to be in a bullish reaccumulation phase despite the recent bearish pressure. The overall structure does not yet look like a complete bearish reversal. Instead, the market seems to be repeatedly engineering liquidity below short-term lows while maintaining higher-timeframe bullish intent.
At the moment, I still lean cautiously bullish because:
liquidity sweeps continue getting reclaimed,
mitigation zones are holding,
and bearish continuation lacks strong follow-through.
The market currently feels more like it is building fuel for another move higher rather than entering aggressive distribution.
However, if BTC decisively breaks below:
80.40K
then the bullish structure would weaken significantly and the market could transition into deeper redistribution.
Overall, from my perspective, BTCUSD still appears to be respecting bullish continuation behavior despite the recent volatility. The repeated liquidity sweeps, immediate reclaims, and mitigation reactions suggest that smart money may still be accumulating positions before targeting higher external liquidity zones.
BTC/USD Bullish Recovery Setup — Support Holding Strong📊 Market Analysis:
BTC/USD is currently reacting from a major support area after a corrective pullback from the resistance zone. Price action suggests buyers are gradually regaining control as the market forms higher lows near support while respecting Fibonacci retracement levels.
🔍 Key Observations:
Strong Support Area holding the recent decline.
Multiple BOS (Break of Structure) confirmations indicate bullish intent.
Price retraced into the FVG zone and is attempting stabilization.
Fibonacci retracement levels are acting as dynamic reaction zones.
Current setup hints at a possible bullish rebound toward resistance.
🎯 Bullish Targets:
Target 1: 81,120 – 81,370
Target 2: 81,620 – 81,900
Target 3: 82,200+ 🚀
⚠️ Invalidation Zone:
A sustained move below the support area could trigger additional bearish pressure.
💡 Trading Bias: Bullish Recovery Continuation 📈
#BITCPOIN crash is coming 🚨🪙📊 Bitcoin – Flat Correction Update
🔄 After hitting a low of 63K on 28 Feb, Bitcoin started its corrective rise. The A wave unfolded in 3 sub‑waves, signaling a Flat Correction (B wave retraces > 61.8%).
📉 B wave: Formed on 29 Mar with a low of 65K
📈 C wave: Currently unfolding in 5 sub‑waves:
1️⃣ Wave 1: Completed on 10 Apr 📉💹
2️⃣ Wave 2: Bounce completed on 13 Apr 🔼📊
3️⃣ Wave 3: Sharp rally to 79,482 🚀💰
4️⃣ Wave 4: Flat cooling, completed on 29 Apr 🧊📉
5️⃣ Wave 5: Now continuing — any confirmation in price is a short signal 🐻⚡📉, with potential downside towards 60K 💥💹
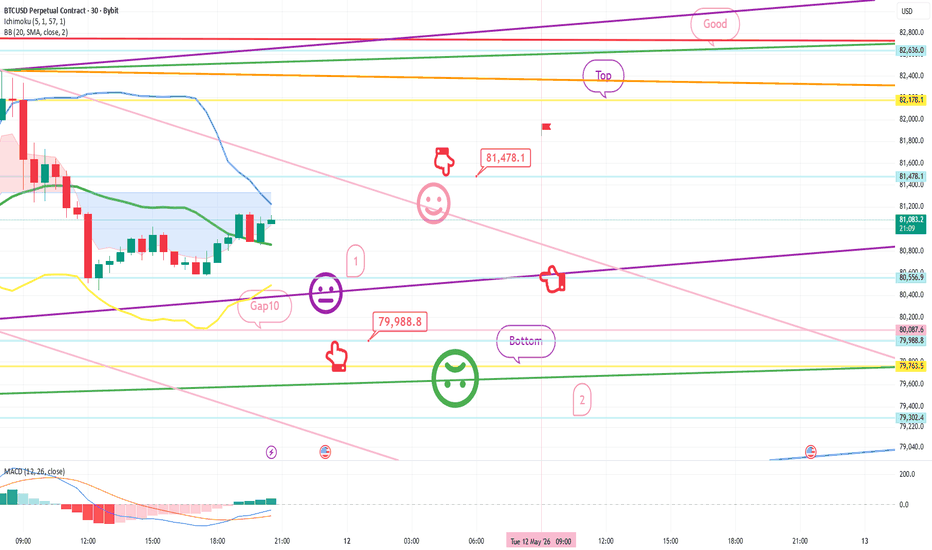
Bitcoin chart analysis May 11Hello
It's a Bitcoin Guide.
My analysis is optimized for TradingView.
If you press the Replay button, you can check real-time movements.
This is the Bitcoin 30-minute chart.
Currently, a MACD Dead Cross is in progress on the 4-hour and daily charts.
*Long Position Strategy based on the movement path of the red finger
1) Entry point for a long position at $79,988.8 / Stop loss if the green support line is broken
2) 1st target for a long position at $81,478.1 -> Target prices in order of Top and Good
If the price successfully rebounds from zone 1 without breaking the purple parallel line, there is a low probability of a vertical rise.
Please be cautious, as the price may fluctuate significantly up and down until the MACD Dead Cross on the daily chart is resolved.
Please use my analysis merely as a reference and for practical application.
I hope you operate safely by adhering to trading principles and strictly using stop-loss orders.
Thank you.
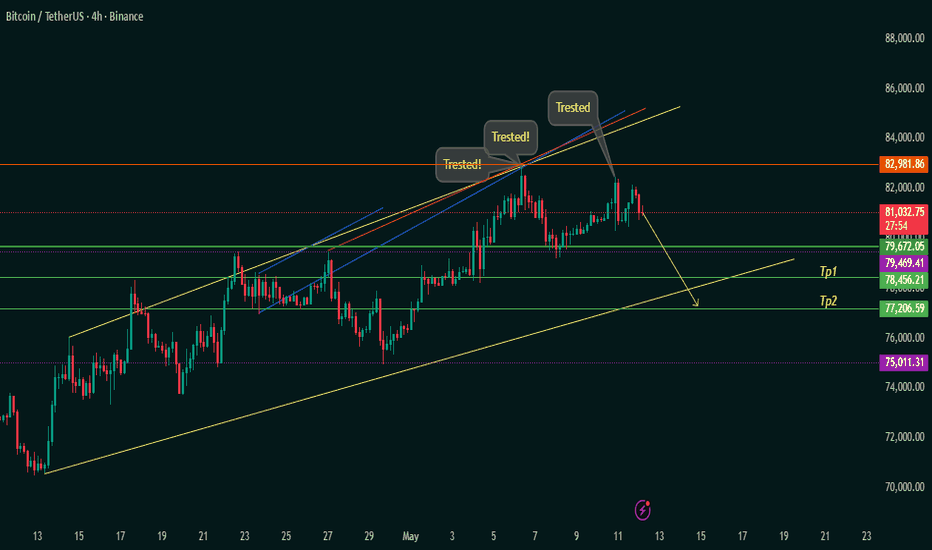
BTC 4H Rising Channel Rejection — Pullback Toward 79KThe chart shows BTC moving inside a large ascending channel with price recently getting rejected near the upper resistance zone around 82.9K multiple times (“Trested!” marks).
That repeated rejection suggests:
Buyers are struggling to push above resistance
Momentum is weakening near highs
Short-term correction risk is increasing
Key Levels
Resistance Zone
82,981 → Major resistance
Price failed here several times
A breakout above this level would invalidate bearish pressure
Current Price
Around 81.1K
Support Levels
TP1
78,456 – 79,469
First major support zone
Likely reaction area
TP2
77,206
Strong lower channel support
Bigger correction target if selling accelerates
Major Macro Support
75,011
Critical bullish structure support
Technical Interpretation
1. Rising Wedge / Exhaustion Structure
The upper trendline is being respected repeatedly while momentum slows.
This often signals:
Distribution phase
Weakening bullish continuation
Possible downward correction before next expansion
2. Lower High Reaction
Recent candles show:
Strong wick rejection
Failure to hold breakout attempts
Sellers entering aggressively near resistance
This increases probability of:
Pullback toward TP1
Sweep into lower liquidity zones
3. Trend Still Bullish Overall
Even with a correction:
BTC remains inside the larger ascending channel
Higher lows are still intact
Macro structure remains bullish unless 75K breaks decisively
Probable Scenario
Bearish Short-Term Path
Rejection from 82.9K
Move toward 79.4K
Possible continuation into 77.2K support
Bullish Invalidation
If BTC:
Closes strongly above 83K
Holds above resistance
Then:
New highs toward 85K–86K become likely
PREDICTION ON BTCUSD 30 MIN TF BTCUSD is currently trading inside a critical mitigation phase after completing multiple engineered liquidity sweeps below short-term structure lows. The chart reflects a market transitioning from aggressive volatility into controlled bullish continuation, with price repeatedly respecting institutional reversal areas and IFC mitigation zones.
Current Critical Zone:
81.05K – 81.25K
This is the most important active area on the chart.
The IFC zone currently acts as:
. Fair value equilibrium
. Bullish mitigation support
. Institutional decision point
. Internal liquidity rebalance
From my perspective, BTCUSD appears to be entering a speculative expansion phase after completing a deep liquidity engineering cycle below the 80.3K region. The current structure suggests that the market may be preparing for another aggressive move higher, with institutions potentially using the ongoing pullback into IFC as a final mitigation phase before targeting external liquidity.
The repeated defense of reversal areas and the lack of sustained bearish continuation indicate that sellers are gradually losing control despite short-term volatility. Price is currently trading within a high-interest institutional zone where liquidity is likely being redistributed before the next directional move.
However, the current structure still carries speculative risk. A failure to hold the mitigation region near 80.85K could invalidate the bullish continuation setup and trigger a deeper redistribution phase toward lower liquidity zones.
Overall, the market currently appears biased toward bullish continuation, with smart-money behavior favoring gradual repricing higher rather than immediate bearish reversal. The ongoing consolidation may simply be the market building fuel before another expansion leg into premium liquidity regions
BTCUSD Pennant Structure | Waiting For FMFR SetupThe market is currently trapped inside a pennant structure, creating a compressed price range where both sides are active.
My main expectation here is an FMFR setup — First Move Fake Than Reversal. In this type of structure, the first breakout move is often a fake move before the market reverses strongly in the opposite direction.
Because of that, I am not measuring the full move yet. First, I want to see which side the market chooses for the initial fake breakout. Once that fake move appears, I can then calculate the expected reversal move based on the first expansion of the pennant structure.
For now, price is still moving inside the structure without a confirmed breakout.
Inside the pennant, I identified an important reversal area where supply has reacted twice already, creating a 2x supply reaction zone. Along with that, I also marked a reversal zone where I want to see any strong positive candle or bullish confirmation.
If buyers react positively from this area, the market could deliver a short-term upside move while still remaining inside the overall structure.
At the moment, the focus remains on how price reacts around the reversal zone before the market reveals its true direction.
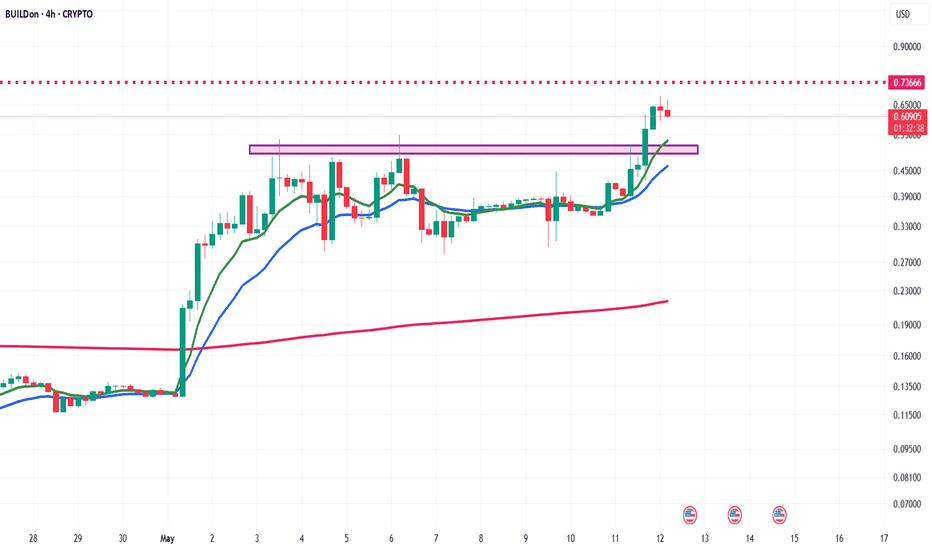
#Happy Trading#Crypto Trading #BUSD# Inflation data at 6.00 PM We have analysed BUSD where it is giving breakout which is supported by strong volumes, shifting of sector rotations in altcoins and meme coins which is again supported by Altcoin and memecoin Season Index.
Take care of the volume you're trading as Inflation data at 6.00 PM today can ruin everything.
#Happy Trading #Crypto Trading #BUSD# Inflation data at 6.00 PM Today
ETH Pullback Could Be Setting Up Bullish ContinuationEthereum is undergoing a short-term correction after falling from around 2,407 USD to near 2,279 USD in just a few sessions. The heavy volume during the decline suggests the market may be clearing liquidity before the next major move.
Despite short-term weakness, ETH has not invalidated its medium-term uptrend yet. The most important support remains around 2,260–2,240 USD.
Holding this zone could allow Ethereum to recover toward 2,340 USD and later 2,400 USD+. However, a strong breakdown below support may extend losses toward 2,180 USD.
At the same time, inflation concerns, Fed policy uncertainty, and US–EU trade tensions are increasing volatility across crypto markets this week.
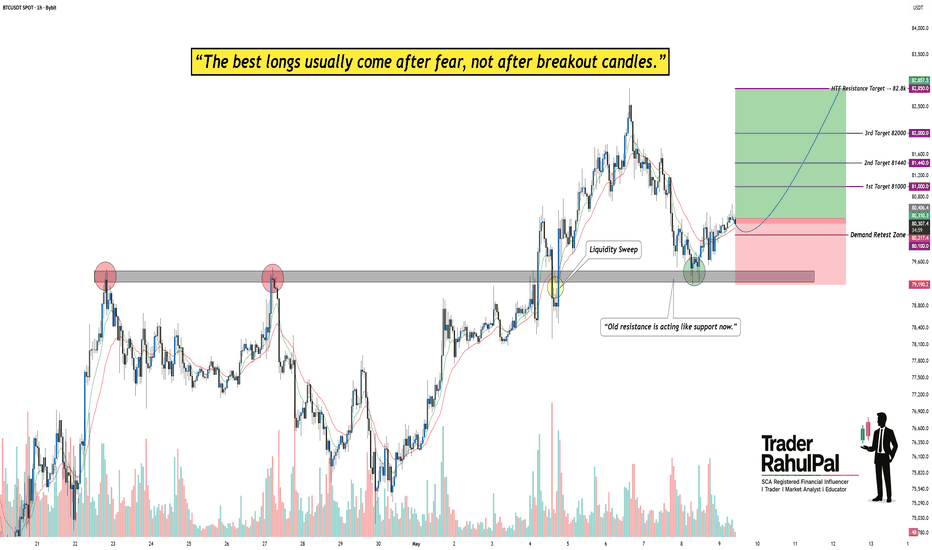
BTC Holding Key Demand Zone – Is $82.8K the Next Target?Bitcoin is once again showing strong bullish intent after successfully defending a major demand zone near the previous resistance area. The recent pullback appears healthy rather than bearish, and buyers are slowly regaining control above support.
The chart clearly shows that BTC respected the same resistance zone multiple times in the past before finally breaking above it. Now that area is acting as support, which is a classic bullish retest structure.
Market Structure Analysis
BTC previously faced rejection twice from the highlighted resistance zone around 79.0K–79.2K, making it an important historical level.
After the breakout, price entered a strong impulsive rally and created higher highs with strong bullish momentum.
The recent correction swept weak hands near support and immediately saw buying pressure return, indicating buyers are still active.
Current price action suggests BTC is attempting to build a new higher low above the breakout zone.
Volume & Momentum Insight
Volume increased heavily during the breakout rally, confirming genuine buyer participation.
During the retracement phase, selling pressure remained relatively controlled compared to the breakout move.
The bounce from support came with renewed bullish candles, showing demand is still present in the market.
Short-term moving averages are slowly curling upward again, supporting bullish continuation possibilities.
Bullish Scenario
If BTC continues holding above the 80K psychological zone, momentum could gradually push price toward the marked upside targets.
1st Target: 81,000
2nd Target: 81,400
3rd Target: 82,000
Final Target: 82,850
A sustained move above recent swing highs could accelerate bullish momentum further.
Bearish Scenario
If BTC loses the highlighted support region decisively, short-term bullish momentum may weaken.
A breakdown below 79.1K could trigger deeper profit booking and volatility.
Traders should avoid emotional entries if support fails to hold.
Rahul’s Insight
Most traders panic during healthy pullbacks inside an uptrend. But experienced traders understand that strong markets often revisit breakout zones before continuation.
The key here is not chasing green candles aggressively. The smarter approach is watching whether buyers continue defending the reclaimed support area.
As long as structure remains intact, dips may continue attracting demand.
If you found this analysis helpful, make sure to like, comment, and follow for more high-quality trading setups and educational content.
Disclaimer:
This analysis is shared for educational purposes only and should not be considered financial advice. Always manage risk properly and do your own research before taking any trade.
— @TraderRahulPal
SCA Registered Financial Influencer (Dubai, UAE)
Chart Analysis — Long Setup Between Support and Resistance Mark
This Bitcoin 45-minute chart shows a short-term bullish recovery after a strong selloff from the 81.6K resistance zone.
Price behavior suggests:
Higher lows forming after the rebound from 79,555 support
Consolidation below resistance
Potential continuation toward upper targets if buyers maintain momentum
The blue 9 SMA is flattening and slightly rising, indicating improving short-term momentum.
Key Levels
Major Support
79,555 → Critical support / stop-loss zone
Buyers reacted strongly here twice
Breakdown below this level would invalidate the bullish setup
Mid Resistance / TP1
80,633
Current price is struggling around this area
Needs strong candle close above for continuation
Major Resistance / TP2
81,590 – 81,602
Previous rejection zone
Sellers entered aggressively here before
Trade Idea (Bullish Setup)
Entry Zone
Around 80,200 – 80,350
Stop Loss
Below 79,555
Targets
TP1:
80,633
TP2:
81,590
Risk-to-reward appears favorable if price holds above 80K psychological support.
Technical Signals
Bullish Signs
✅ Double reaction from 79,555 support
✅ Recovery above SMA 9
✅ Higher low formation
✅ Buyers defending dips
Bearish Risks
⚠ Repeated rejection near 80.6K
⚠ Lower highs still visible from 81.6K peak
⚠ Weak momentum candles near current price
Probable Scenarios
Bullish Scenario
If BTC breaks and closes above 80,633:
Momentum could accelerate toward 81.6K
Potential breakout continuation afterward
Bearish Scenario
If BTC loses 79,555:
Likely move toward 78.5K
Trend structure becomes bearish again
Suggested Chart Title
“BTC Bullish Recovery Setup Above 79.5K Support”
Alternative titles:
“Bitcoin Long Trade Setup with TP1 & TP2”
“BTC Rebound From Key Support Zone”
“BTC 45M Bullish Continuation Pattern”
“Bitcoin Support Hold and Breakout Attempt”