Bitcoin chart analysis May 8Hello
It's a Bitcoin Guide.
My analysis is optimized for TradingView.
If you press the Replay button, you can check real-time movements.
This is the Bitcoin 30-minute chart.
Currently, a MACD Dead Cross is in progress on the 12-hour and daily charts.
*Short -> Long switching based on the movement path of the light blue finger; this is a two-way neutral strategy.
1) Light blue finger: $79,968.4 is the entry point for the short position / Stop loss if the orange resistance line is broken.
2) $78,737.9 is the switch to the long position / Stop loss if the purple support line is broken.
3) $80,464 is the first target for the long position -> Target prices will be set in the order of Top and Good during the weekend.
Since the MACD Dead Cross on the daily chart is still ongoing, sideways movement or a correction may occur until tomorrow.
However, if the Top zone is strongly broken, the signal may be ignored.
- Please note that depending on the rebound from the current position, the movement may connect from the indicated pink finger #1 to #2. Please be cautious, as a break below the purple support line could lead to a drop of up to 77K.
Please use my analysis merely as a reference and for practical purposes.
I hope you operate safely by adhering to trading principles and strictly using stop-loss orders.
Thank you. BNBUSD Could Be Setting Up for Another Heavy FlushBNB is still trading inside a broad range on the daily chart, but the overall structure continues to look weak. Price has been struggling to break above the 100 EMA, and every recovery attempt is getting sold into before a real breakout can happen. The recent bounce from the $570 area was decent, but buyers still failed to build strong momentum above resistance.
Right now, BNB is sitting near the top of the local range, which makes this area important. If the price gets rejected here again and starts losing strength, it would keep the bearish structure active. The chart also shows that the market has been making lower highs since the bigger decline started, which usually points toward sellers staying in control.
The key level to watch is $610 . As long as BNB stays below that zone, the downside outlook remains valid. A rejection from the current area could send the price back toward $570 first.
If selling pressure increases below that support, the next downside targets come in around $480 and $450. Until BNB clearly reclaims the major resistance zone, the chart still leans bearish overall.
We will update further information soon.
BrightRally_Research BTCUSD Bullish Reversal ZoneThe overall market bias remains bullish, so I am currently focused on bullish continuation setups.
After the previous high was broken, I expected the old supply area to return as a retest. To track that possibility, I copied the entire supply range from the left-side structure and projected the same zone into the current market area.
Price is now reacting inside this reversal zone. If the market forms strong bullish confirmation or any positive price action pattern here, it could continue moving toward the upside.
I also marked a “VOL BURST” level below the zone. This area may act as a liquidity sweep zone, meaning price could briefly move below it before reversing, or continue ranging between the VOL BURST level and the reversal zone before the next move begins.
At the moment, the market is showing a repeated supply structure, while demand strength appears relatively slow. Because of that, the sell-side reaction came aggressively.
For now, the bullish bias remains intact unless market structure shifts clearly bearish.
 Long
Long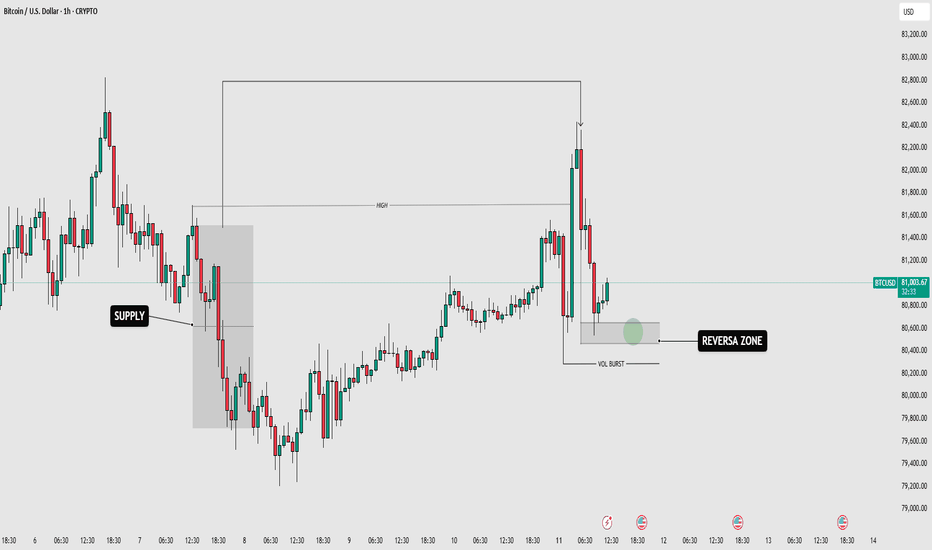
Long 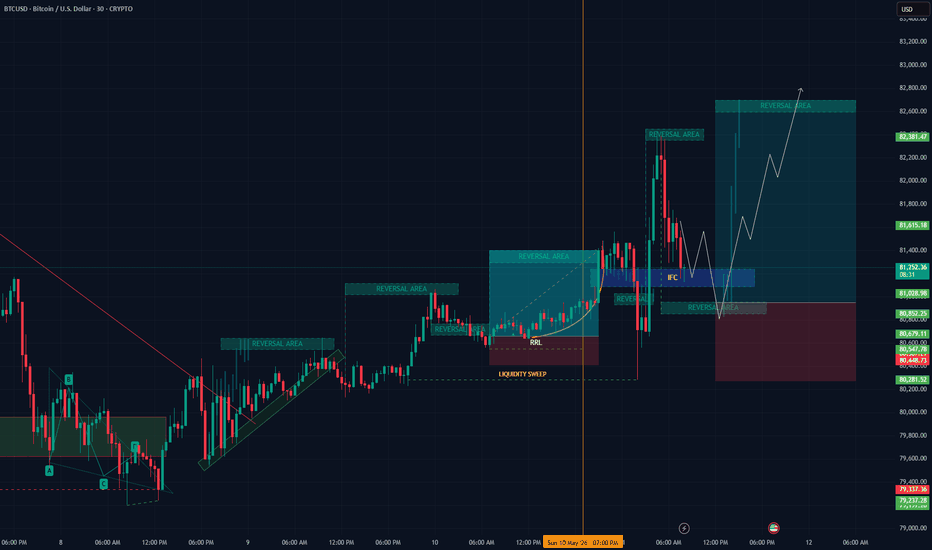
BTC/USD (1H): Perfect Supply Rejection Exactly as our planTrade Recap:
If you followed my previous analysis, you know we were watching the $82,400 - $82,800 Supply Zone very closely. Just as anticipated, Bitcoin tapped directly into this high-resistance liquidity pool and faced an aggressive bearish rejection. The setup played out flawlessly, giving us a textbook Smart Money entry!
Technical Breakdown (What just happened?):
Institutional Selling: The market makers stepped in exactly at the previous swing high. Notice the massive bearish displacement candle on the 1H chart right after touching the pink box—this confirms heavy selling pressure and a rejection of higher prices.
The "Bull Trap": Price briefly swept the highs to grab liquidity, trapping early breakout buyers before aggressively reversing to the downside.
The Game Plan (The Next Move):
As indicated by the updated blue trajectory on the chart, the short-term momentum has clearly shifted to the bears.
Primary Downside Target: I am now looking for the price to melt down toward the $79,100 - $79,500 Demand Zone (Lower Pink Box). This area contains unmitigated orders and will act as a magnetic draw for the current price action.
The Next Opportunity: Once we reach the lower demand zone, we will monitor price action for a potential accumulation phase and a new long opportunity.
Strategy Update:
If you caught the short from the top supply zone, congratulations! Make sure to secure partial profits and trail your stop loss to guarantee a winning trade. If you are currently flat, wait for the price to reach the $79k demand zone before looking for any new setups.
Risk Management: Do not try to catch a falling knife in the middle of the range. Let the price come to our predefined zones!
#Bitcoin #BTCUSD #SMC #ICT #CryptoTrading #ForexPathshala #TechnicalAnalysis #TradingView Long 
Long 
BTC/USD Near Resistance – Bearish Reversal Setup Building?🔍 Analysis:
Bitcoin has staged a solid recovery from the highlighted support zone, but price is now approaching a major resistance area where selling pressure could increase. Multiple Fair Value Gaps (FVGs) and Fibonacci retracement levels are clustering near the current price, creating a potential reversal zone.
🟡 Key Levels to Watch:
🔸 Current Resistance Zone: 80,950 – 81,300 🚧
🔸 Immediate Support: 80,350 – 80,100 🛡️
🔸 First Bearish Target: 79,200 🎯
🔸 Main Bearish Target: 77,800 🎯🔥
🔸 Extended Downside Target: 75,500 📉
📌 Market Scenario:
🐻 If BTC gets rejected from the 81K resistance zone, a downside move toward 79,200 is likely, with further selling pressure potentially driving price toward 77,800–75,500.
🐂 A clean breakout and close above 81,300 would invalidate the bearish setup and could open the door for higher highs.
💡 Trade Idea:
🔴 Rejection at resistance = Sell setup 📉
🟢 Breakout above resistance = Bullish continuation 📈
⚠️ Wait for price confirmation before entering. Short 
 Long
Long
Long 
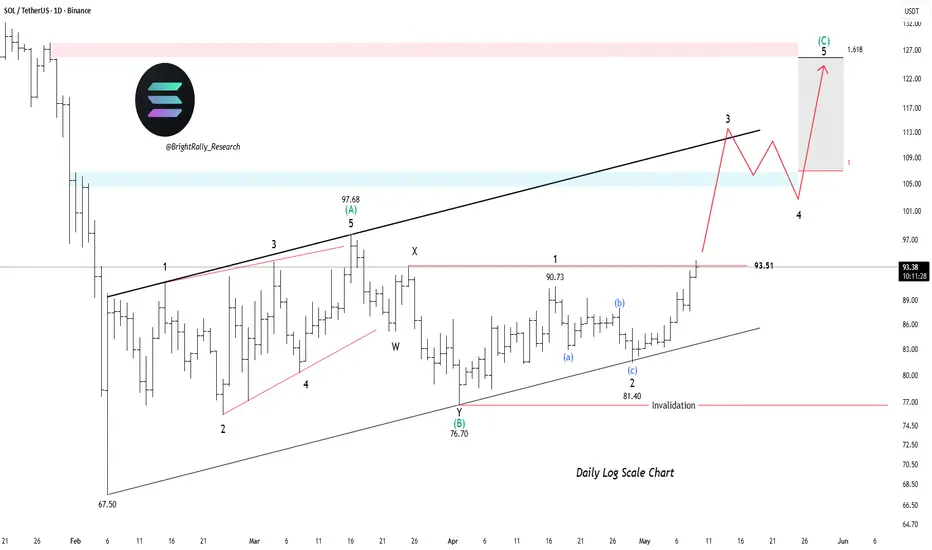
SOL/USDT (1D): Accumulation Complete? Breakout ImminentMarket Context:
Solana (SOL) has been locked in a massive daily accumulation phase since the sharp market correction in February. For over three months, the price has built a rock-solid foundation, and we are now witnessing a steady, aggressive push toward the upper boundary of this long-term range.
Technical Breakdown (Daily Timeframe):
The Accumulation Range: SOL has been perfectly respecting the structural boundaries—absorbing sell pressure at the $70 - $80 Demand Zone (lower pink box) and currently challenging the $95 - $100 Supply Wall (upper pink box).
The Breakout Blueprint (Blue Path): As illustrated on the chart, the price action is heavily squeezing against the immediate resistance. The structure is forming higher lows, indicating strong buying pressure. The projected path anticipates a bullish Break of Structure (BOS) clearing the $100 psychological barrier.
Retest & Expansion: The most optimal setup here is a clean breakout followed by a retest of the $95 - $100 zone. Once previous resistance flips into support, it clears the runway for a massive expansion toward the $115 - $120 liquidity pools.
Key Levels to Watch:
Major Supply (Resistance): $95 - $100
Next Upside Target: $115 - $120
Strong Demand (Support): $70 - $80
The Trading Plan:
The Conservative Play: Patience is key. Wait for a definitive Daily candle close above $100. Look to enter long on the subsequent pullback (retest) to ride the next impulsive wave upwards.
Invalidation: If SOL faces a harsh rejection at the current $95 level, expect a rotation back toward the $80 - $85 mid-range support before another attempt.
Final Verdict: The longer the consolidation, the stronger the expansion. Solana is coiling up tightly, and momentum is shifting in favor of the bulls. Watch the volume closely as we test the $100 mark!
Risk Note: Always trade with a strict Stop Loss, especially when trading near major supply zones. Do not front-run the breakout!
#Solana #SOLUSDT #CryptoAnalysis #SmartMoneyConcepts #PriceAction #TradingView BINANCE:SOLUSDT ETH/USD: Massive Accumulation or One Last Shakeout?Market Outlook:
Ethereum is currently stuck in a tight consolidation range on the Daily timeframe, trading around $2,327. After the aggressive sell-off in early February, the price has been printing higher lows, indicating that bulls are slowly stepping back into the market. We are approaching a "Make or Break" zone.
Technical Analysis (Daily TF):
The Accumulation Zone: Since March, ETH has been building a solid base between $2,100 - $2,200. This area is acting as a massive demand cluster where Smart Money is likely accumulating.
The Liquidity Sweep (Path A): As shown by my blue arrows, I am expecting a potential "Spring" or Liquidity Sweep toward the $2,150 level. This move would hunt the stops of late buyers before the real rally begins.
The Breakout (Path B): A clean daily close above the $2,450 - $2,500 supply zone (Pink Box) will confirm a structural shift, opening the doors for $2,800+.
Key Levels to Watch:
Major Resistance: $2,480 (Supply Zone)
Immediate Support: $2,280
Institutional Demand: $2,100 - $2,150
Primary Target: $2,650
Moon Target: $2,900
The Trading Plan:
Conservative Entry: Wait for a successful retest of the $2,450 resistance turned support.
Aggressive Entry: Look for bullish reversal signatures (Doji/Hammer) if the price dips into the $2,180 demand zone.
Final Verdict: The trend is neutral-to-bullish. Ethereum is lagging behind Bitcoin's recent strength, but once the $2,500 barrier breaks, expect a massive "catch-up" rally.
Risk Warning: Crypto markets are highly volatile. This is for educational purposes only. Always use a Stop Loss to protect your capital!
#Ethereum #ETH #CryptoAnalysis #SmartMoneyConcepts #TradingStrategy #Altcoins BTC/USD 1H: Target Hit & Next Setup AnalysisFollowing my previous analysis, Bitcoin respected the lower demand zone perfectly. The price tapped into the $79,200 - $79,500 area, showed strong rejection, and rallied straight to our target. This move confirmed the strength of the current support level.
Technical Outlook (The New Idea)
As shown in the updated chart, BTC is now trading in a consolidation phase and approaching a major Supply Zone (Resistance) around the $82,400 - $82,800 mark.
Key Levels to Watch:
Major Resistance: $82,800 (Previous Swing High)
Immediate Support: $80,400
Strong Demand: $79,200
Future Scenarios:
Supply Rejection (Short Opportunity): If the price fails to break the $82,800 resistance and shows bearish price action (like an H1 reversal candle), I expect a pullback toward the $80,800 or $79,500 levels to fill the liquidity.
Bullish Breakout (Long Opportunity): A clean candle close above $83,000 would invalidate the bearish outlook and open the doors for a move toward $85,000+.
Strategy:
I am currently monitoring the price action at the top of the range. I prefer waiting for a clear rejection at the supply zone before looking for new entries.
Risk Note: Always maintain strict Risk-to-Reward ratios. Don't chase the move in the middle of the range.
#Bitcoin #BTCUSD #SmartMoneyConcepts #TechnicalAnalysis #TradingStrategy The Silent Killer in Trading: BoredomIntroduction: The Problem Most Traders Never Notice
A lot of traders think their biggest problem is strategy.
They keep changing indicators, testing new systems, buying courses, or searching for “ the perfect setup .” But many times, the real damage is not coming from the strategy at all. It comes from what traders do when nothing is happening.
Trading is boring far more often than people expect.
Social media makes trading look fast and exciting. Screens are full of charts, profits, and constant action. But real trading usually involves waiting. Sometimes the market gives clean opportunities. Sometimes it gives absolutely nothing for hours.
That is where problems start.
Most traders are not comfortable sitting still. After staring at charts for too long, they begin feeling the urge to do something. Even when there is no setup, the brain starts trying to create one.
That is how boredom slowly turns into bad trading.
1. Why Boredom Is So Dangerous in Trading?
The Need to Feel Involved
When someone spends hours in front of charts, they naturally want to feel productive.
The problem is that trading does not reward effort the way normal jobs do. In most jobs, being active usually leads to results. In trading, too much activity often leads to losses.
This feels unnatural for beginners.
After waiting for a long time, traders start thinking:
“This setup looks close enough.”
“Maybe the market is about to move.”
“I do not want to sit here all day and take nothing.”
The trade is no longer based on quality. It is based on the need to feel involved.
That small shift in mindset changes everything.
Boredom Creates Fake Opportunities
Slow markets are dangerous because they force traders to stare at noise.
When volatility is low, price moves become small and random. There is usually no clear direction. But after watching charts for hours, the brain starts treating meaningless movement as an opportunity.
A trader begins drawing extra trendlines, switching to lower timeframes, and searching for reasons to enter.
In reality, the setup often does not exist.
The trader just became tired of waiting.
2. How Boredom Leads to Overtrading
One Bad Trade Turns Into Many
Most boredom trades do not look serious in the beginning.
A trader enters one random position out of impatience. Sometimes that trade even wins. That is where the real danger starts.
Now the brain connects impulsive behavior with reward.
The trader starts believing:
“Maybe I do not need to wait for perfect setups.”
Slowly, standards drop.
A setup that once looked weak now feels acceptable. Risk management becomes flexible. Patience disappears.
This is how overtrading begins — not from greed, but from mental exhaustion and lack of discipline.
Trading Becomes a Source of Entertainment
Many traders do not realize they have become emotionally attached to the activity itself.
The market gives constant stimulation:
> moving candles
> profits and losses
> excitement
> tension
> dopamine
Without noticing it, trading starts feeling more like entertainment than decision-making.
That is why some traders feel uncomfortable when they are not in a position. Silence feels empty. Waiting feels frustrating.
But the market does not reward excitement.
It rewards patience.
3. The Psychological Trap of “Missing Out.”
Watching the Market All Day Changes Your Thinking
Imagine sitting in front of charts for four straight hours without taking a trade.
Then, suddenly, the price makes a strong candle.
Immediately, the mind reacts:
“What if this is the move?”
“What if I miss it?”
“I should probably enter before it runs.”
At that moment, emotion takes control.
The trader is no longer following a plan. He is reacting to fear and frustration built up from waiting too long.
This is why screen time matters.
The longer traders stare at charts, the harder it becomes to stay objective.
Example of a Boredom Trade
A trader plans to only trade breakouts during the London session.
For two hours, nothing clean appears. The market is slow and choppy.
Instead of walking away, he keeps watching every candle. Eventually, he notices a small move on the 1-minute chart and convinces himself it could become a breakout.
He enters early.
Price moves slightly in his favor at first, then reverses and stops him out.
After the loss, frustration increases. Now he wants to recover the money. A second impulsive trade follows.
By the end of the session, the account is down — not because the strategy failed, but because patience failed.
This happens every day in trading.
4. Professional Traders Think Differently
They Understand That No Trade Is a Position
Beginner traders think they always need to be active.
Professional traders understand that staying out of the market is sometimes the smartest decision available.
* If conditions are unclear, they wait.
* If volatility is weak, they wait.
* If setups are low quality, they wait.
They do not feel emotional pressure to force trades because they know another opportunity will always come later.
That mindset protects both capital and mental energy.
Patience Is Part of the Edge
Most people think edge only comes from strategy.
But patience itself is an edge.
Two traders can use the same setup:
+) One trader takes every mediocre variation because he is bored.
+) The other waits only for the cleanest opportunities.
Over time, the patient trader usually performs far better.
The difference is not intelligence. It is emotional control.
5. How to Avoid Boredom Trading
Spend Less Time Watching Charts
One of the easiest ways to reduce emotional trading is to reduce unnecessary screen time.
Many traders believe watching charts all day improves performance. Usually, it does the opposite.
Constant observation creates emotional attachment to every small move.
Instead:
* set alerts
* define trading hours
* step away during slow sessions
* focus only on planned setups
Trading becomes much easier when every candle is not being watched emotionally.
Follow Rules, Not Feelings
Boredom becomes dangerous when decisions are based on emotion.
This is why clear rules matter.
A trader should know:
> exactly what qualifies as an entry
> when not to trade
> maximum trades per day
> acceptable market conditions
Strong rules create structure during emotional moments.
Without structure, boredom eventually takes control.
Learn to Be Comfortable Doing Nothing
This is probably the hardest skill in trading.
Doing nothing feels unproductive. It feels passive. Sometimes it even feels wrong.
But experienced traders know that patience protects accounts.
A bad trade can damage confidence, discipline, and capital very quickly. Avoiding unnecessary trades is often more valuable than finding extra setups.
Sometimes the best trading decision is simply closing the charts and waiting for another day.
Conclusion:
Most trading losses do not happen because traders lack knowledge or intelligence. They happen because people struggle to stay patient when the market becomes slow. Boredom quietly lowers discipline and pushes traders into setups they would normally avoid. Over time, the market rewards those who can wait for the right opportunity instead of forcing constant action.
We will update further information soon.
Stay tuned, stay connected to @BrightRally_Research on the @TradingView platform Education 
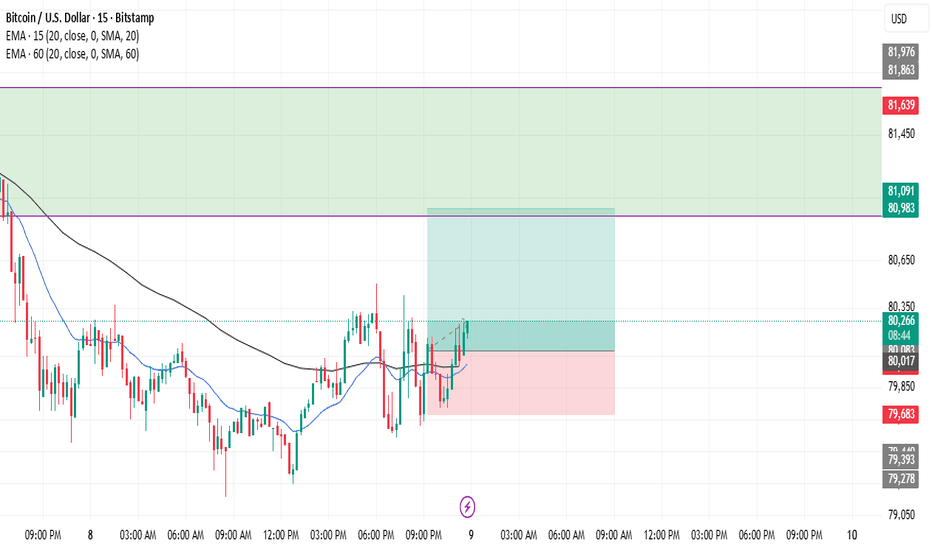
BTC/USD Bullish Rebound Setup – Buyer Zone Holding StrongAnalysis:
BTC/USD appears to be forming a bullish recovery structure after a sharp sell-off from the marked breakout zone. Price has now entered a key buyer zone/support base, where multiple candles are consolidating near Fibonacci retracement levels — signaling accumulation.
✅ Bullish Factors:
Strong reaction from the buyer zone (demand area).
Price holding above short-term support.
Consolidation indicates potential liquidity build-up before expansion.
If buyers defend this zone, upside momentum could accelerate toward previous imbalance/FVG areas.
⚠️ Risk Area:
A breakdown below the buyer zone/support block would weaken the bullish setup and may trigger another downside leg.
🎯 Targets:
TP1: 80,220 – 80,300 (near resistance cluster)
TP2: 80,450 – 80,550 (FVG fill zone)
TP3: 80,800+ (major resistance / projected breakout target) 🚀
🛑 Invalidation Zone:
Sustained move below 79,640 – 79,400 may cancel bullish momentum.
Outlook:
Bias remains bullish while price holds the buyer zone, with a possible dip-and-rally move before pushing higher. 📈🔥 Long 
Long 
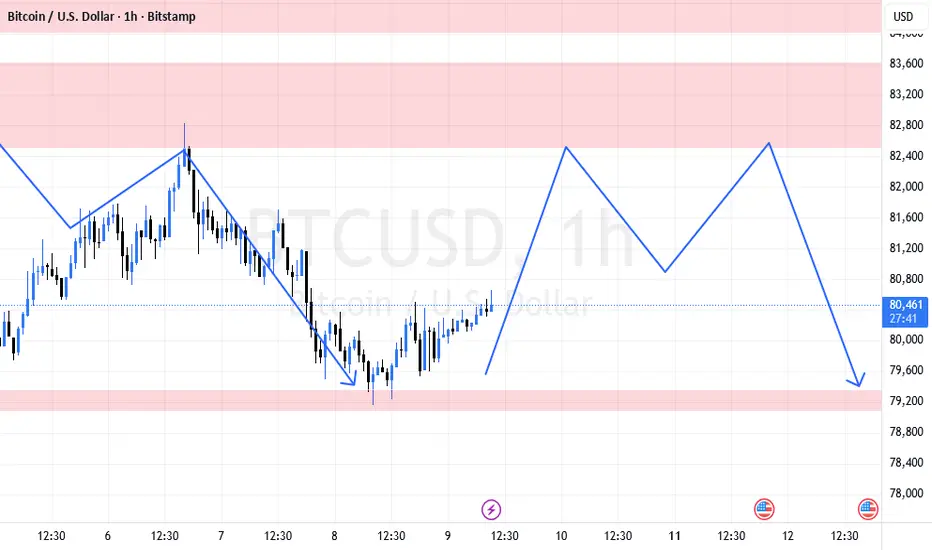
BTCUSD (Bitcoin) 1H Analysis: Range Consolidation & Resistance Market Overview
Bitcoin is currently trading near $80,452 on the 1-hour timeframe. After a recent correction toward the support zone, the price appears to be stabilizing, setting the stage for a potential relief rally within a defined range.
Technical Analysis
Support Zone: The price has found buyers in the $79,200 - $79,600 area (lower red box). This zone is critical for maintaining the current structure.
Resistance Zone: A heavy supply area is visible between $82,400 and $83,700 (upper red box). This is where previous selling pressure originated.
Price Projection: As indicated by the blue path on the chart, the price is expected to bounce toward the $82,400 resistance level. However, multiple rejections at this level could lead to a volatile "sideways" movement before a potential deeper correction back toward the $79,500 support.
Trade Setup (Range Play)
Long Entry (Bounce): Near current levels ($80,000 - $80,500) targeting the upper resistance.
Short Entry (Rejection): Look for sell signals if the price reaches the $82,500 - $82,800 zone and fails to break out.
Stop Loss (SL):
For Longs: Below $79,000.
For Shorts: Above $83,800.
Take Profit (TP):
Primary Target: $82,400.
Secondary Target: $80,800 (Mid-range).
⚠️ Disclaimer: Trading Bitcoin involves high risk due to volatility. This analysis is for educational purposes only. Always use proper risk management and your own strategy before entering a trade.
What is your take on BTC's next move? Let me know in the comments! If you find this analysis useful, please leave a Like (👍). Long 
Education

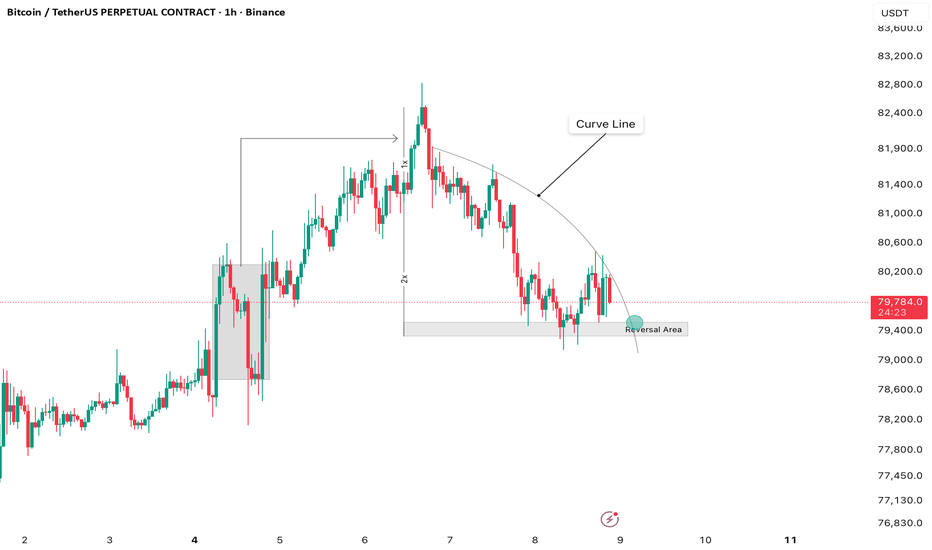
1-hour chart analysis for Bitcoin/TetherUS Perpetual (BTCUSDT.P)Bullish Scenario: If the $79,500 area holds without strong candle closes below it, a retest of the local highs at $82,000 and eventually $84,500 is likely.
Strategy: Look for a "Sweep and Reclaim" or a bullish engulfing candle within the reversal area before entering. Always follow the 1% risk management rule for capital
Structure: After a strong rally from roughly $78,000, Bitcoin encountered heavy resistance near the $82,800 local high. The subsequent "Curve Line" (arch-like pattern) represents a cooling phase into the current support zone.
Resistance: The primary hurdle remains the $82,200 – $85,300 zone. A decisive 1-hour close above $80,850 would signal a reclaim of the stair-step bullish structure.
Support (Reversal Area): The current gray box near $79,500 acts as a "demand zone" where buyers have previously stepped in. Long