Short
Short
Short 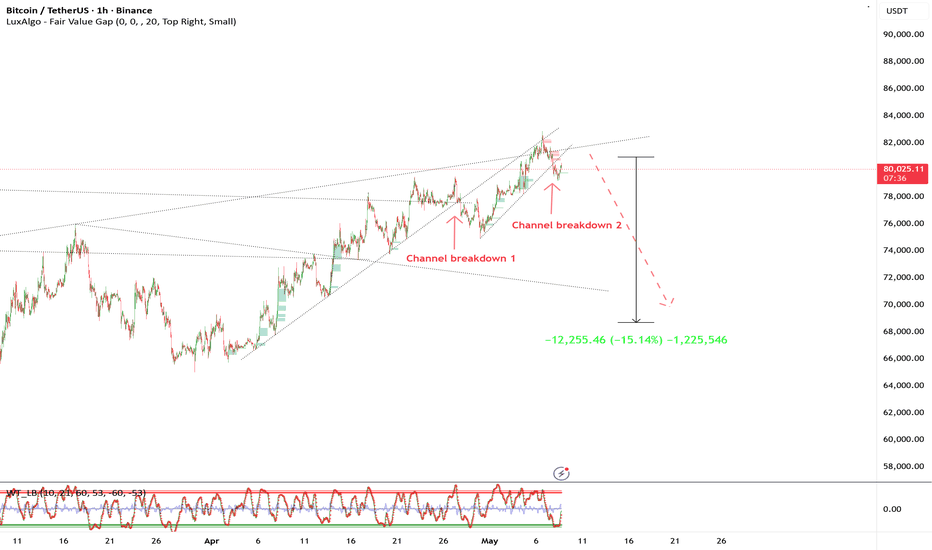
Long 
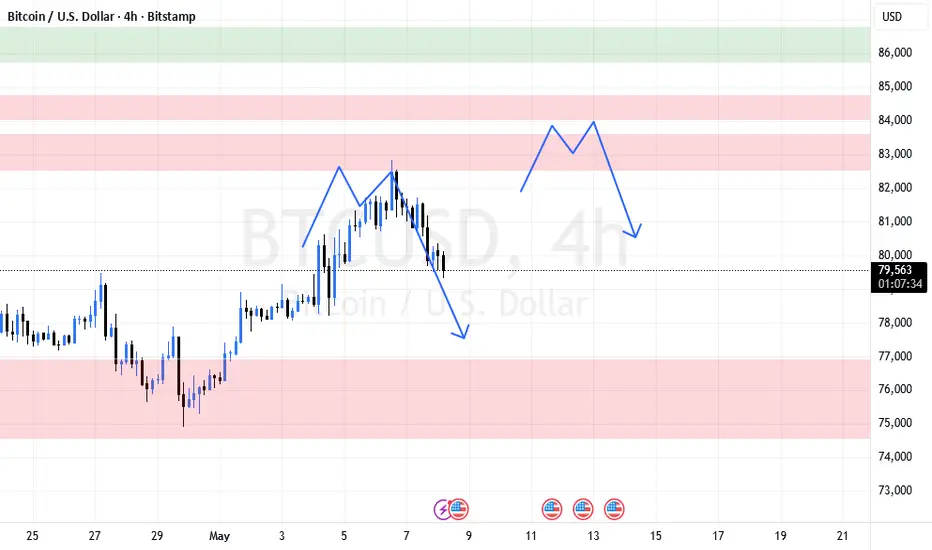
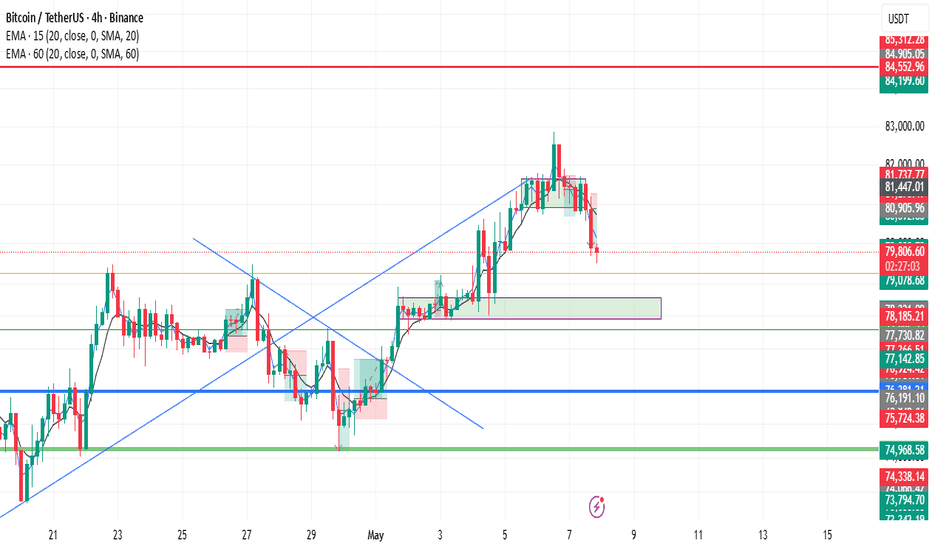
BTCUSD (4H) Analysis: Watching for the Next Move | SMC SetupHello Traders,
Taking a fresh look at the Bitcoin (BTCUSD) 4H chart. We recently saw a strong rejection from the top, and the price is currently pushing down, breaking minor structural levels.
Based on SMC (Smart Money Concepts), I have mapped out the potential price action using the blue paths. Here is what I am watching:
📊 My Trade Plan:
Current Move (Downwards): The price is currently heading down. I am waiting for it to reach the major Demand Zone resting around the $75,000 - $76,500 area (lower red box). I am not looking to buy here blindly.
The Pullback (Upwards): After tapping the demand zone and finding support, I expect a pullback towards the upside to mitigate the fresh Supply Zones created during this recent drop (around the $83,000 - $84,500 area).
The Execution (Short Setup): If the price rallies back up to those unmitigated supply levels (upper red boxes), I will be looking for Lower Timeframe (LTF) confirmations like a CHoCH. A rejection there would be a prime opportunity to look for high-probability short entries.
💡 Key Takeaway: Let the market do its thing right now. Patience is key. I'm waiting for the price to develop the structure before committing to a trade.
⚠️ Disclaimer: This analysis is for educational purposes only. Always use proper Risk Management.
What are your thoughts on BTC right now? Are we going straight down or will we see that pullback first? Let me know in the comments and hit the LIKE button! Short
Long 
 Long
Long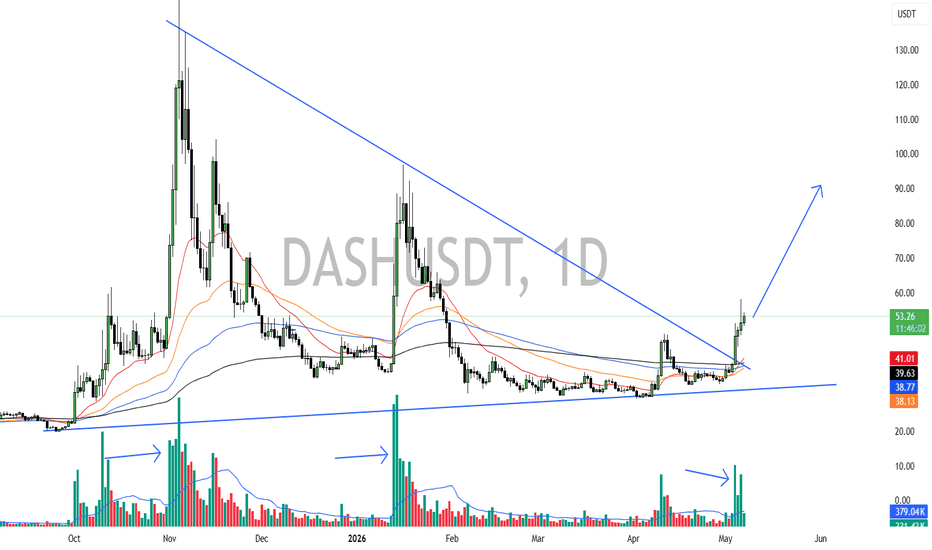
Long 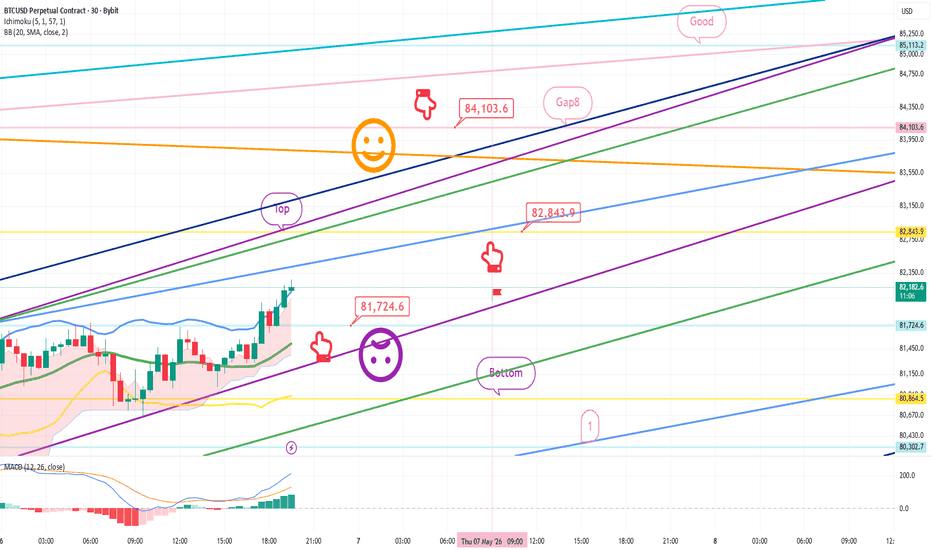
Short

Long 
Short 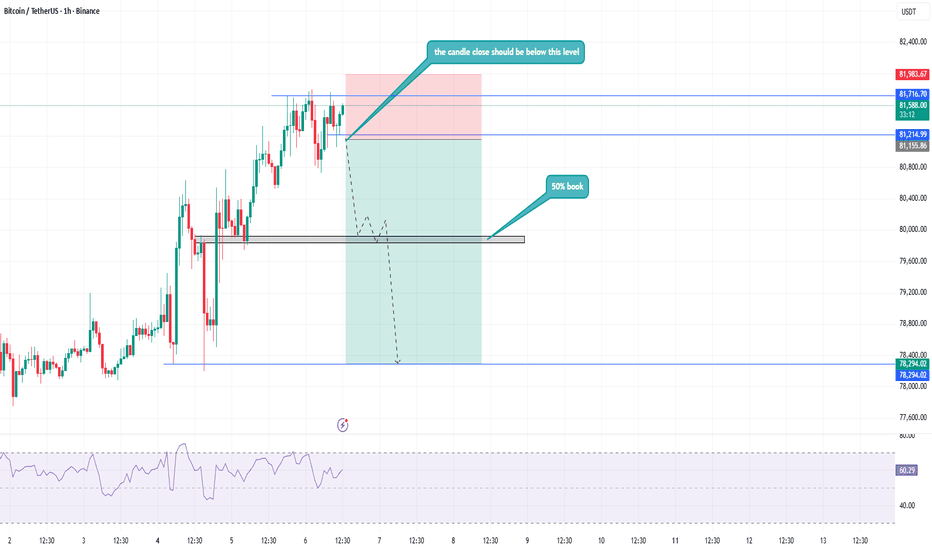
 Long
Long
10 Trading Mistakes Ananya Made That Destroyed Her AccountIntroduction
Ananya did not start trading to lose money. Like most traders, she came in with a plan, a strategy, and the belief that consistency was just a matter of time. She studied charts, followed setups, and took trades that looked right. But despite all that effort, her results kept slipping. Some days she won, many days she gave it back, and slowly her account stopped reflecting the work she was putting in.
The problem was not the market, and it was not her strategy. It was the small decisions she made in real time. Moving a stop loss, chasing a trade, exiting too early, or trying to recover a loss. None of these felt like big mistakes in the moment, but together they quietly destroyed her performance. This is not just Ananya’s story. It is the pattern most traders go through without realizing it.
In this article, we break down the 10 psychological mistakes Ananya made, not as theory, but as real situations that happen on the chart. More importantly, each mistake shows what should be done instead. Because trading is not about finding the perfect setup. It is about avoiding the decisions that ruin it.
1. Moving Stop Loss
Ananya enters a well-planned trade with a clear stop loss, but as price moves closer to it, discomfort kicks in. She convinces herself the move is temporary and shifts the stop lower to “give it space.” Price continues against her, turning a small, planned loss into a large one. This is a classic example of fear overriding discipline. Instead of accepting a predefined risk, she reacts emotionally in the moment. What should be done instead is simple but difficult in practice: treat the stop loss as final. Place it based on logic, not emotion, and accept the outcome. A small loss is part of the system. A big loss is a failure of discipline.
2. Win Rate Trap
Looking at her history, Ananya notices she wins most of her trades. That gives her confidence, but she overlooks a critical detail. Her losses are significantly larger than her wins. For example, she might win five trades of small profit but lose it all in one oversized loss. This creates the illusion of success while her account slowly declines. The mistake is focusing on being right instead of being profitable. The solution is to prioritize risk to reward. Even with a lower win rate, consistent profitability comes from ensuring that winners are larger than losers.
3. Indicator Addiction (Illusion of Control)
Ananya opens a chart and begins adding multiple indicators, believing more confirmation will improve her decisions. RSI suggests one thing, MACD another, and moving averages add more noise. She hesitates, misses entries, and eventually takes trades too late. This is over-analysis disguised as control. Instead of simplifying decisions, she complicates them. The better approach is to reduce dependency on indicators and focus on a clear, repeatable system. Simplicity creates clarity, and clarity leads to better execution.
4. Revenge Trading
After a loss, Ananya feels the need to recover immediately. She enters another trade without proper analysis, driven by frustration rather than logic. One loss turns into multiple as she keeps trying to win it back quickly. This behavior is emotional trading at its worst. The example is clear: instead of stepping away after a loss, she doubles down on mistakes. The correct approach is to pause. Accept the loss, reset mentally, and only return when a valid setup appears. Trading is not about recovering instantly but surviving consistently.
5. FOMO Entries (Buying the Top)
Ananya sees a strong bullish move and feels the urge to participate before it is “too late.” She enters at the peak, only to watch price pull back shortly after. This is fear of missing out in action. The move was valid, but her timing was not. The mistake is chasing momentum without a plan. Instead, she should wait for structured entries such as pullbacks or confirmations. Missing a trade is always better than entering a bad one.
6. Impulsive Entries
Without waiting for confirmation, Ananya begins entering trades based on quick assumptions. A candle moves slightly, and she reacts instantly. These impulsive decisions often lead to drawdowns because they are not backed by a clear setup. The example highlights a lack of patience and structure. What she should do instead is define strict entry rules and follow them. If the setup is not complete, the trade does not exist. Discipline in waiting is what separates consistency from randomness.
7. Cutting Winners Early
When a trade moves in her favor, Ananya quickly exits to secure a small profit. While this feels safe, she often watches prices continue strongly in the same direction afterward. This behavior limits her upside and disrupts her overall profitability. The mistake is letting fear control exits. Instead, she should allow trades to reach their planned targets or use a structured trailing strategy. Letting winners run is essential to balancing inevitable losses.
8. Overleveraging
After a series of wins, Ananya increases her position size, believing she has found consistency. A normal losing trade now results in a significantly larger loss due to the increased risk. This is a direct result of overconfidence. The example shows how quickly gains can be erased when risk is not controlled. The better approach is to maintain consistent position sizing regardless of recent performance. Risk should be based on a plan, not emotions.
9. No Stop Loss
Believing strongly in a setup, Ananya decides not to use a stop loss. As the price moves against her, she holds on, hoping for a reversal. The loss grows larger with time, and what could have been controlled becomes damaging. This is hope-based trading, where risk is ignored. The correct approach is non-negotiable: always use a stop loss. Accepting a defined risk is the foundation of survival in trading.
10. Overconfidence After Wins
Following a winning streak, Ananya starts to believe she has mastered the market. She takes lower-quality trades, increases risk, and ignores her rules. Eventually, one loss wipes out a significant portion of her gains. This pattern is common and dangerous. The example shows how success can lead to carelessness. The solution is to stay grounded. Treat every trade independently and continue following the same disciplined process, regardless of past results.
Each of these mistakes is caused not by the market but by the trader’s own decisions. Recognizing them is the first step. Controlling them is what leads to long-term survival and growth.
Education 
Short 
BTC/USD Rejection at Resistance – Bearish Pullback SetupAnalysis:
BTC/USD has rallied strongly after multiple CHoCH (Change of Character) and BOS (Break of Structure) confirmations, showing clear bullish market structure. However, price has now entered a major resistance zone near 80,765, where sellers are reacting aggressively.
🔍 What stands out:
✅ Strong bullish momentum pushed price into premium supply/resistance.
✅ Price is showing rejection candles at the resistance block.
✅ A short-term pullback looks likely before the next major move.
✅ Lower FVG (Fair Value Gap) zones may act as downside magnets/liquidity targets.
🎯 Potential bearish targets:
First Target: Retest of recent support / BOS zone (~80,000–79,700 area) 🎯
Second Target: Drop into upper FVG zone (~78,900–78,500 area) 🎯🎯
Extended Target: Lower FVG fill if selling pressure increases 📉
⚠️ Invalidation:
If BTC breaks and closes strongly above 80,800 resistance, bearish pullback idea weakens and upside continuation may begin.
Bias: Short-term Bearish Retracement 📉 | Higher-timeframe Bullish Structure 📈 Short 
ETHUSD - Bulls Loading Up Just Below BreakoutETH on the 4H chart is forming a cup and handle pattern. The rounded bottom came after the drop into the 1,937 area, and from there, the Crypto has been slowly climbing back up. That kind of recovery usually shows steady buying rather than a quick bounce. Now, ETH is pulling back slightly, which is the handle part. This pullback looks controlled, not aggressive, so it feels more like a pause than any real weakness.
At the moment, price is just moving in a tight range and drifting a bit lower. Sellers are not really pushing hard, and buyers are not chasing yet either. This kind of behavior usually happens before a bigger move, where the market builds up energy. The overall structure still looks clean, so nothing is broken for now.
The key level to watch is 2,405 . This is where price has been rejected before and where the breakout needs to happen. If ETH pushes above that level and manages to stay there, that confirms the pattern and opens the move toward 2,850 . That target comes from the size of the cup projected upward. Until ETHUSD actually breaks that level, it is still just a setup forming, so it makes more sense to wait and react instead of guessing early.
We will update further information soon.
Bitcoin Range View: 78K to 75K Move ExpectedHi Traders, I hope you are doing well.
As today is Saturday, Bitcoin usually moves in a small range because market activity is low. Right now, price is near a strong resistance around 78K after a good upward move.
At this level, price is slowing down, which means sellers can enter here. If Bitcoin is not able to stay above 78K, then we may see a downward move.
As per simple view, price can fall towards the 75K area, which is a previous support zone. So, 78K is acting like a selling area, and 75K is a buying area.
If price stays above 78K and moves sideways, then the range can continue instead of falling. So, it is better to wait for clear confirmation before taking any trade.
This is only for learning purpose. Always manage your risk and avoid trading without proper plan. Short 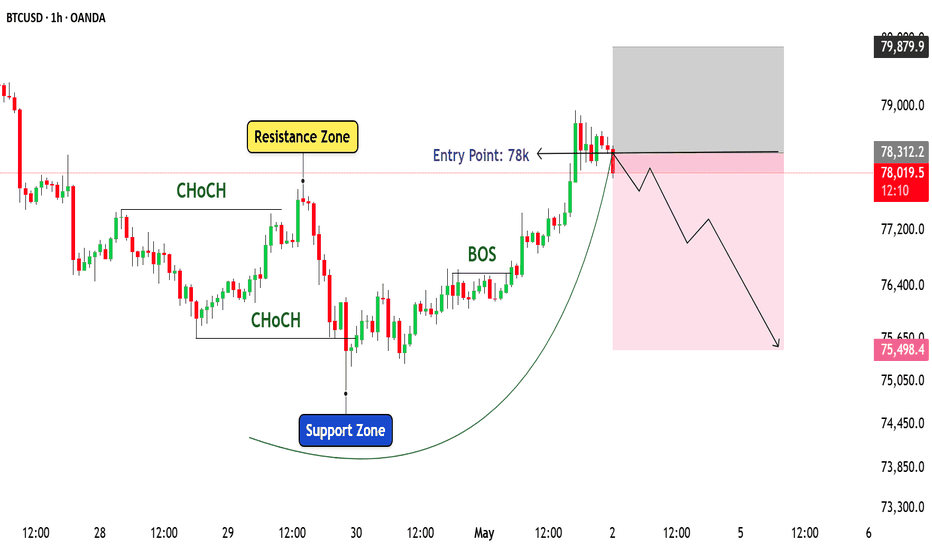
BTC/USDT Consolidation Near Resistance – Breakout or PullbackAnalysis:
Bitcoin is currently trading in a tight consolidation range just below a major resistance zone, signaling that a decisive move may be close.
Key Market Structure:
✅ Price has shown a strong bullish recovery from lower demand zones
✅ Previous Fair Value Gap (FVG) acted as an imbalance area and price respected it well
✅ BTC is now compressing beneath key resistance, often a sign of liquidity building before expansion
✅ The highlighted mid-zone could act as a short-term retest area before the next move
✅ Lower green support zone remains the major liquidity magnet if sellers take control
Possible Scenarios:
📈 Bullish Scenario:
If BTC breaks and closes above the highlighted resistance zone, upside momentum could accelerate toward:
🎯 Target 1: 79,200 – 79,800
🎯 Target 2: 80,500+ 🚀
📉 Bearish Scenario (Liquidity Sweep / Pullback):
If resistance holds, price may sweep nearby liquidity and retrace toward support:
🎯 Target 1: 76,800 – 76,300
🎯 Target 2: 74,500 – 73,800 🐻 Short 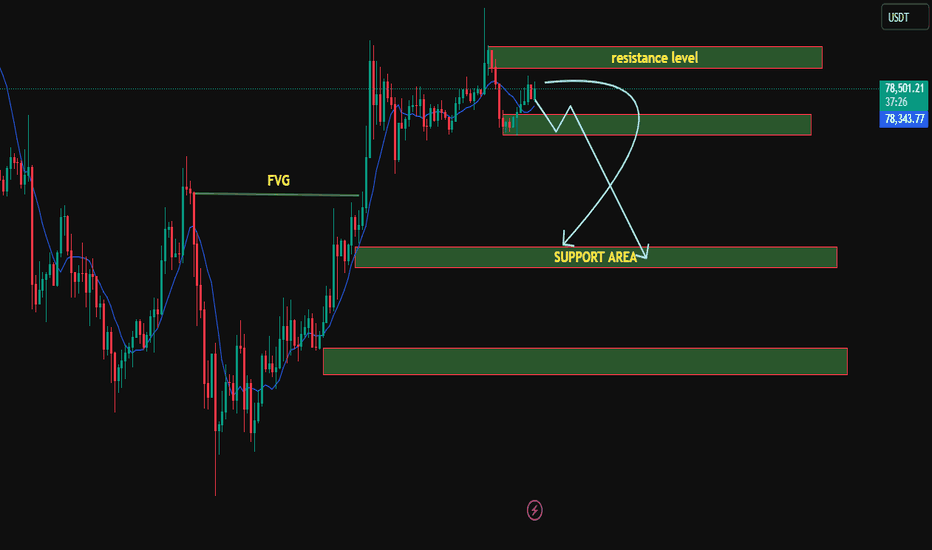
Long