BTCUSD 4H Bearish Reversal ZoneThis is my Bitcoin 4H analysis, and the overall idea is very simple.
The market has been moving higher, but the demand structure is developing very slowly. Instead of showing aggressive buying pressure, price is gradually pushing upward and approaching an important reaction area.
To identify the next potential turning point, I took the previous demand zone and projected it forward using a 2X demand measurement. This helped me create a clean reversal zone where I expect the market to make its next important decision.
Now my main focus is on the highlighted reversal area.
If the market reaches this zone and forms any strong bearish candle, bearish engulfing pattern, or clear rejection, then the probability of a downside move increases significantly.
Since this analysis is based on the 4H timeframe, any reaction may take time to develop, so patience is important.
Until confirmation appears, the zone remains only an area of interest and not an immediate sell signal.
At the moment, price is approaching a key decision point. The market has already completed a large portion of the upward move, and now I want to see how it reacts inside the reversal zone before making any further conclusions.
For now, the setup remains simple: wait for bearish confirmation inside the marked area and then look for potential downside continuation.
This analysis is based on the MMC concepts designed by Candle King. A huge amount of credit goes to him — his concepts have helped me understand market structure, supply and demand behavior, and reversal zones much more clearly.  Short
Short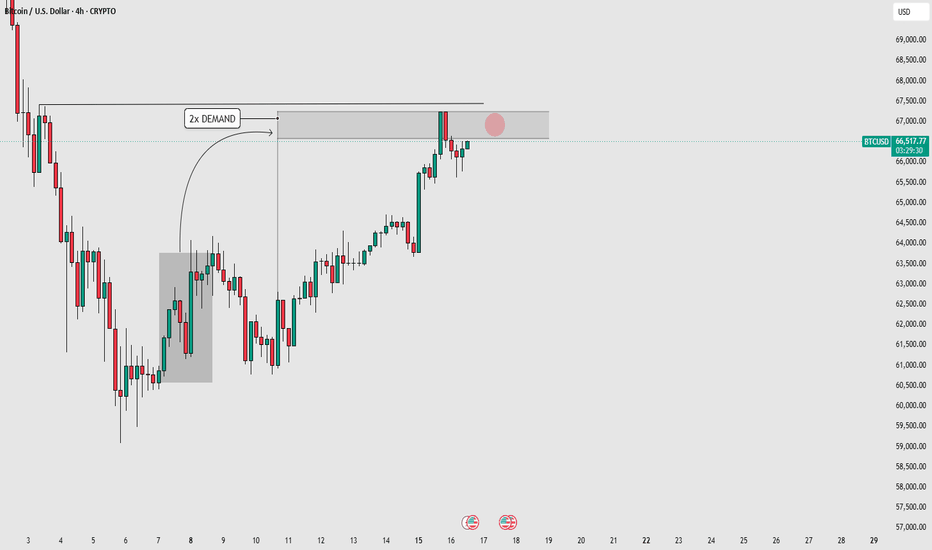
 Long
Long
 Long
Long
Short 
Bitcoin Crosses $66K After Hormuz Reopening Announcement Bitcoin surged past $66,000, climbing 3.5% to $66,570, as easing geopolitical tensions boosted risk appetite across financial markets.
🌍 The rally followed reports suggesting improved shipping conditions through the Strait of Hormuz, a critical route for global oil supplies.
📈 The positive momentum was further supported by renewed optimism surrounding a potential U.S.–Iran peace agreement, helping Bitcoin reclaim and hold above the key $65,000 level.
📊 Market Impact:
• BTC Price: $66,570 (+3.5%)
• Key Support: $65,000
• Next Resistance: $67,000 – $70,000
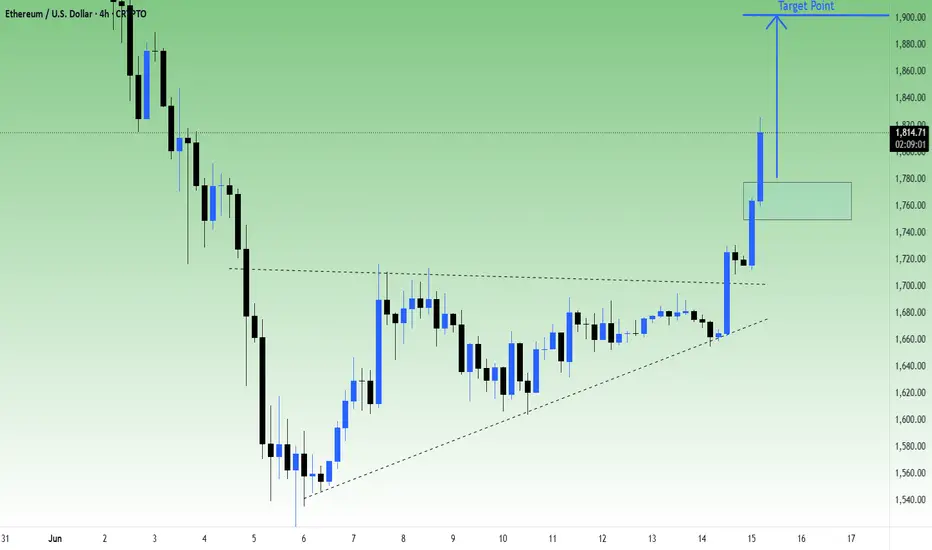
With macro fears cooling, traders are once again embracing risk assets and Bitcoin is leading the charge. ETHUSD Range Breakout | Bulls Target 1,900 & 2,000 📊 ETHUSD (4H Timeframe)
🔍 Analysis:
• Strong bullish breakout above the consolidation range ✅
• Trendline support has held firmly
• Momentum candles show buyers are in control
• Retest zone around 1,750 – 1,780 could act as support
🎯 Bullish Targets:
✅ TP1: 1,900
✅ TP2: 2,000
📌 Support Zone:
1,750 – 1,780
🛑 Stop Loss:
Below 1,720
🚀 Trade Idea:
BUY on pullbacks into the breakout zone.
📈 Outlook:
As long as ETH remains above 1,750, bulls could push price toward 1,900 first and then 2,000.  Long
Long
Bitcoin Just Reclaimed $65K, Is $70K Next?Bitcoin has pushed above the critical $65,000 level, shifting market sentiment back in favor of the bulls. However, the real test is whether BTC can hold this breakout and build enough momentum for a move higher.
📌 Key Levels To Watch:
🟢 Support Zone: $64,800 – $65,200
This area has now flipped into an important demand zone. Holding above it keeps the bullish structure intact.
🎯 Upside Targets:
• $67,000 – First major resistance
• $70,000 – Key psychological level and bullish target
⚠️ Invalidation Scenario:
If Bitcoin loses the $64,800 region and fails to reclaim it, the breakout could turn into a bull trap, leading to a deeper pullback.
📊 Technical Outlook:
• Price has reclaimed the crucial $65K zone.
• Momentum is improving, but confirmation is still needed through sustained buying pressure.
• The next few candles could determine whether BTC enters a fresh expansion phase or returns to consolidation.
💬 Will Bitcoin finally break toward $70K, or is another rejection around the corner?
Share your outlook below! 👇 Idea: Bitcoin – Bearish Structure with Weak Low in Sight (Daily)
· Current Price: ~65,748 (+0.05%)
· Structure:
· Multiple BOS (Break of Structure) to the downside after topping near 82,517.
· Several CHoCH (Change of Character) confirm trend shifts lower.
· Price is trading below all major BOS levels, last CHoCH near the 70–72k zone.
· Key Levels:
· Resistance: 70,000–72,000 (recent CHoCH / BOS area)
· Support: 61,259 (minor), then 58,355 (Weak Low zone)
· Outlook:
· Bearish below 70k. Expect continuation toward 61,259 and then the Weak Low near 58,355.
· A break below 65,355 could accelerate selling.
Trade setup:
· Short on retest of 67,000–68,500, stop above 70,500, target 61,500 then 58,500.
· Aggressive short now at 65,750, stop at 70,000, same targets.
Avoid longs unless price reclaims 70,000 and holds above 72,000. Long 
 Short
Short
Long 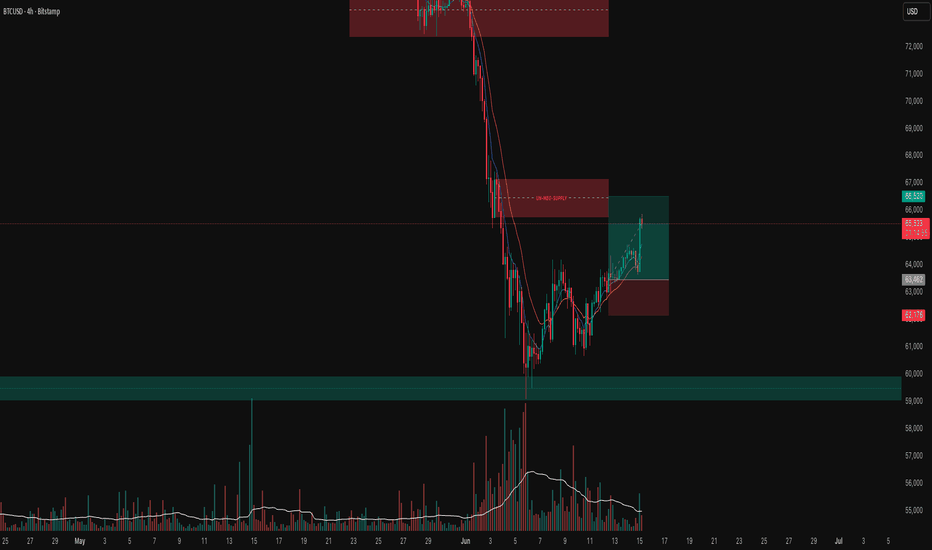
Bitcoin Holds Firm Near $63K as Traders Await CatalystsBitcoin has entered a calmer phase after the heavy selloff that pushed prices below $60K. The narrowing trading range around $63K–64K suggests that the market is trying to establish a short-term balance.
Investors are now closely watching ETF inflows and expectations around Federal Reserve policy. If US bond yields continue to ease, risk assets like Bitcoin could attract fresh demand.
At the same time, the $65.5K–66K area remains an important resistance zone. A successful breakout could encourage further upside, while failure there may trigger another wave of selling.
Trade Setup:
Buy Zone: $62,500 – $63,000
Stop Loss: $61,700
Take Profit 1: $65,500
Take Profit 2: $66,000
Take Profit 3: $68,500
As long as BTC stays above $62K, the recovery structure remains intact. A break below that level would shift focus back toward $60K.  Short
Short
Long 
Liquidity Run Complete, Bearish Reversal In PlayIn fiscal Q2 2025, Micron's HBM revenue surpassed $1 billion for the first time, growing more than 50% sequentially. The company also reported that data center revenue tripled year-over-year, highlighting the strength of AI-related demand.
However, strong fundamentals do not eliminate the possibility of short-term corrections. Markets often retrace after periods of excessive optimism, liquidity grabs, and extended price expansion. My current bearish thesis is therefore based on market structure, liquidity dynamics, and price action not a deterioration in Micron's long-term business outlook.
What the Chart Is Telling Us
1. Liquidity Sweep Above Prior Highs : One of the most important observations on the chart is the recent push above a key swing high. Price successfully traded into buy-side liquidity resting above previous highs, triggering breakout buyers and stop losses from short positions.
2. Supply Zone Reaction : After the liquidity run, price entered a premium pricing area and immediately showed signs of rejection. The inability to sustain momentum after reaching this area raises the probability of a corrective move.
3. Inefficiencies Below Current Price : Several price imbalances remain below the current market. Markets have a tendency to revisit inefficient areas created during impulsive moves. If sellers gain control, these inefficiencies could act as magnets that attract price lower before equilibrium is restored.
Bearish Scenario
My primary expectation is for price to rotate lower from the current supply zone.
First Objective: $930
The $930 region aligns with:
• Previous structural support
• A key reaction area
• Potential liquidity resting beneath recent lows
Secondary Objective: $800
If sellers successfully break through $930 and market structure shifts decisively bearish, the next major area of interest sits near $800. This level represents a significant demand region and an area where previous accumulation occurred.
Bullish Invalidation
Every analysis requires a clear invalidation level. The bearish outlook becomes significantly weaker if MU can reclaim and hold above the current supply zone while establishing new highs. A sustained move above the recent liquidity sweep would indicate that buyers remain in control and that continuation rather than retracement is the more likely outcome.
 Long
Long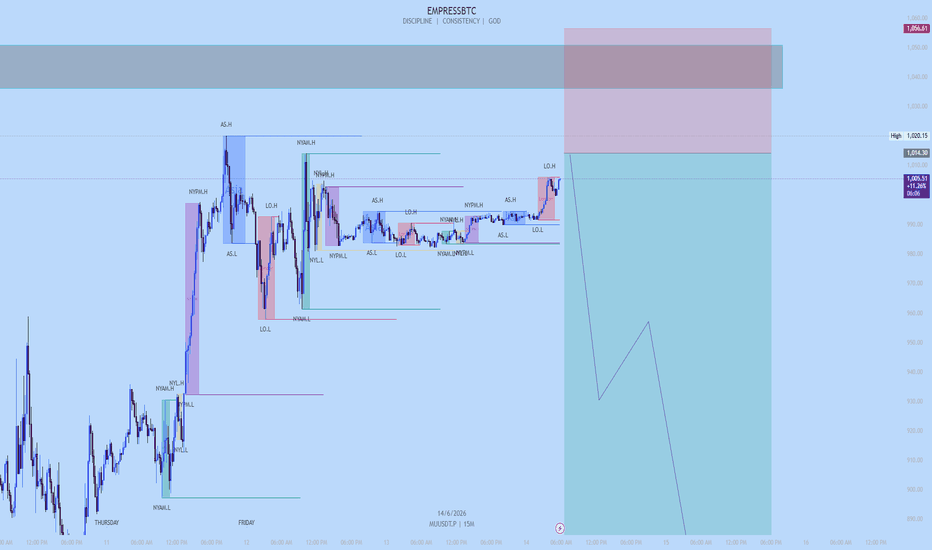
Trading Nifty AnalysisWhere is Nifty right now?
Nifty closed at 23,689 on Thursday May 14. After a brutal fall earlier this week (it touched ~23,300), it bounced back for 2 days in a row. So right now it's in a recovery mood — but it hasn't really "fixed" itself yet. Think of it like someone who had a fever, now feeling slightly better, but not fully healthy.
2 What's the wall above? (Resistance)
If Nifty tries to go up next week, it will hit a wall around 23,500–23,600 first. That's the first test. If it somehow crosses that, the BIGGER wall is at 23,900–24,000 — where all the major moving averages (50-day & 200-day) are sitting. Lots of sellers will be waiting there to book profits. So going above 24,000 next week? Unlikely unless something very positive happens.
3 What's the floor below? (Support)
If Nifty starts falling, the first safety net is around 23,300–23,150. This zone has held multiple times recently. If it breaks this level decisively (and stays below it), then the next stop could be 23,000 or even 22,900. That's the danger zone — but that's not the most likely scenario for next week.
4 What's working in Nifty's favour?
Good news that could push it up:
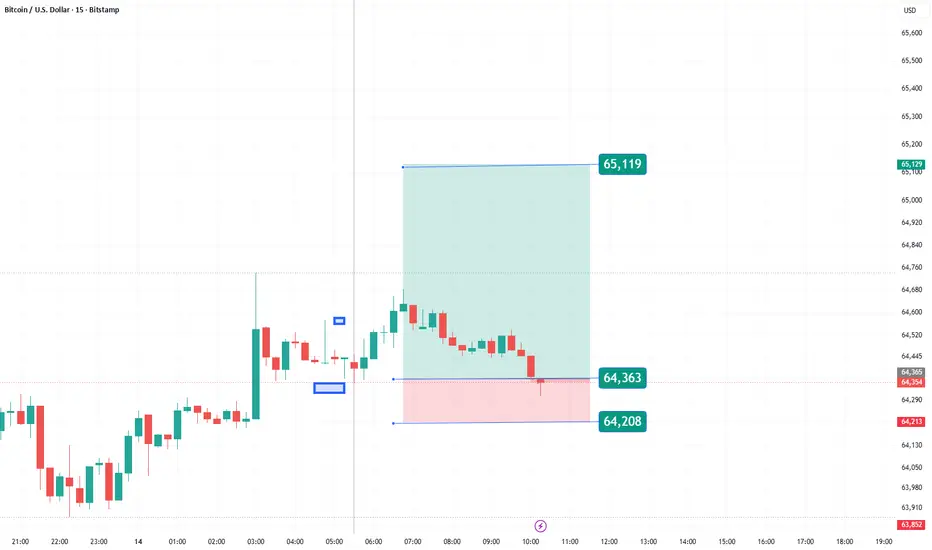
btc/usdBTC/USD on the 15-minute chart is showing signs of short-term weakness after failing to sustain momentum above the recent highs near 64,600. The market initially formed a bullish structure with higher highs and higher lows, but selling pressure has increased, pushing price back toward the key support zone around 64,363. The chart highlights a long setup with a target at 65,119 and a stop loss at 64,208, but the current price action suggests that buyers are being challenged.
The support area between 64,363 and 64,208 is now critical. If Bitcoin holds above this region and forms a bullish rejection candle, buyers may regain control and attempt another move toward 64,700, followed by the 65,119 target. This zone could attract liquidity and fresh demand from market participants looking for a continuation of the broader uptrend.
However, a decisive break below 64,208 would invalidate the bullish outlook and increase the probability of further downside movement. Traders should closely monitor volume and price behavior around support, as the next reaction from this level is likely to determine Bitcoin’s short-term direction. Long 
Long 
 Long
Long
bitcoin bullish setup for swing Bitcoin (2-Hour Timeframe) Analysis
Current Structure
Bitcoin is trading around $63,900-$64,000.
Price has formed a series of higher lows, indicating buyers are gradually gaining control.
The market is currently consolidating below a key resistance zone around $64,180 - $64,420.
Key Resistance Levels
$64,183 – Immediate resistance.
$64,418 – Major breakout level.
A strong 2-hour candle close above this zone could trigger fresh buying momentum.
Support Zones
🟢 Support 1: $62,200
🟢 Support 2: $61,000
🟢 Strong Demand Zone: $60,000
As long as Bitcoin remains above these support levels, the bullish structure remains intact.
Bullish Scenario
Break and close above $64,418.
Retest the breakout zone successfully.
Momentum buyers enter the market.
Next major target: $70,946.
Trade Idea
Entry: After confirmed breakout above $64,418
Stop Loss: Below $62,200 (aggressive traders can use tighter SL)
Target: $70,946
Risk-Reward: Approximately 1:4 to 1:5
What Traders Should Watch
✅ Increasing volume near resistance
✅ Strong bullish candles closing above $64,418
✅ Retest holding as support
❌ Rejection from resistance may send price back toward $62,200
Conclusion
The chart suggests a bullish breakout setup. Bitcoin is compressing below a major resistance zone, and a confirmed breakout above $64.4K could open the path toward $70.9K. Until then, patience is important—wait for confirmation rather than anticipating the breakout. Long 
btc/usdThe BTC/USD 15-minute chart shows a strong bullish recovery after a period of selling pressure. Bitcoin found support near the 63,240 level and formed a series of higher lows, indicating that buyers have regained short-term control. The price then broke above a minor resistance zone around 63,620, triggering a sharp upward move toward the 63,800 area.
Currently, BTC is trading around 63,725 after facing rejection near the resistance level at 63,812. The recent red candles suggest some profit-taking by traders, but the overall structure remains bullish as long as the price stays above 63,620. This level now acts as an important support zone.
The risk-to-reward setup on the chart is favorable, with a stop-loss below 63,620 and a downside target near 63,242 if support fails. If buyers manage to break above 63,812, Bitcoin could continue its upward momentum and target higher resistance levels. Traders should watch for volume confirmation and price action around the highlighted support and resistance zones before entering new positions. Short 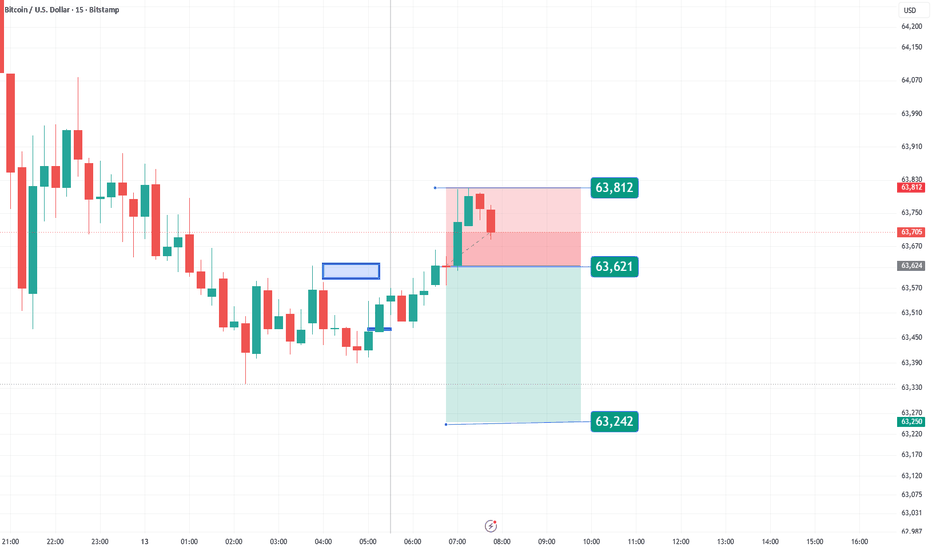
 Short
Short
 Long
Long