Headline: BTC/USD Analysis: Monthly Support Reversal & Daily Bitcoin (BTC) is showing some very interesting price action right now across multiple timeframes. After a significant correction from the $120k levels, we are seeing signs of stabilization at a crucial juncture.
1. The Macro View (Monthly Chart): The SR Flip
The Monthly timeframe reveals a classic Support/Resistance Flip. The zone between $60,000 - $70,000, which acted as a major ceiling in 2021 and early 2024, has now been tested as solid support.
This "Role Reversal" confirms that the long-term bullish structure is still intact.
Watching this zone hold is key for the next leg up.
2. The Micro View (Daily Chart): Ascending Triangle
Zooming into the Daily chart, a clear Ascending Triangle pattern is taking shape:
Flat Resistance: There is a persistent supply zone near the $74,000 - $75,000 mark.
Higher Lows: The rising trendline indicates that buyers are getting more aggressive on every dip, constantly squeezing the price higher.
Key Takeaways:
Breakout Potential: The price is reaching the apex of the triangle. A strong daily close above the $75k resistance with volume could trigger a massive momentum move.
Target: Based on the pattern height, a breakout could eyes the $90k - $95k zone in the medium term.
Risk Management: While the setup looks high-probability, a breakdown below the ascending trendline would invalidate this pattern.
Technical analysis is all about probabilities, not certainties. Let’s see how the weekly close shapes up!
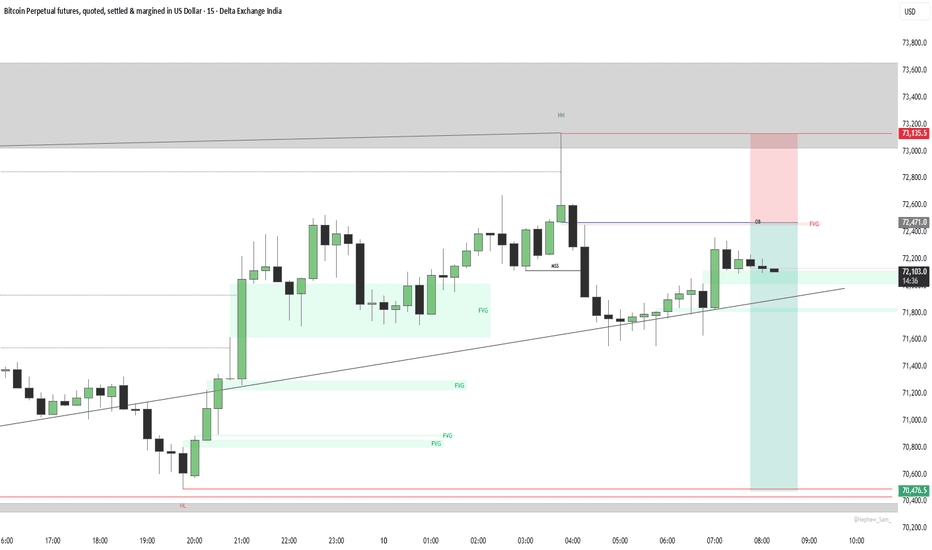
What’s your take on BTC’s current structure? Breakout or further consolidation? Let’s discuss in the comments. 👇 BTC/USD Is In Distribution PhaseOn the 4-hour timeframe, Bitcoin is showing signs of buying momentum exhaustion near its All-Time High (ATH).
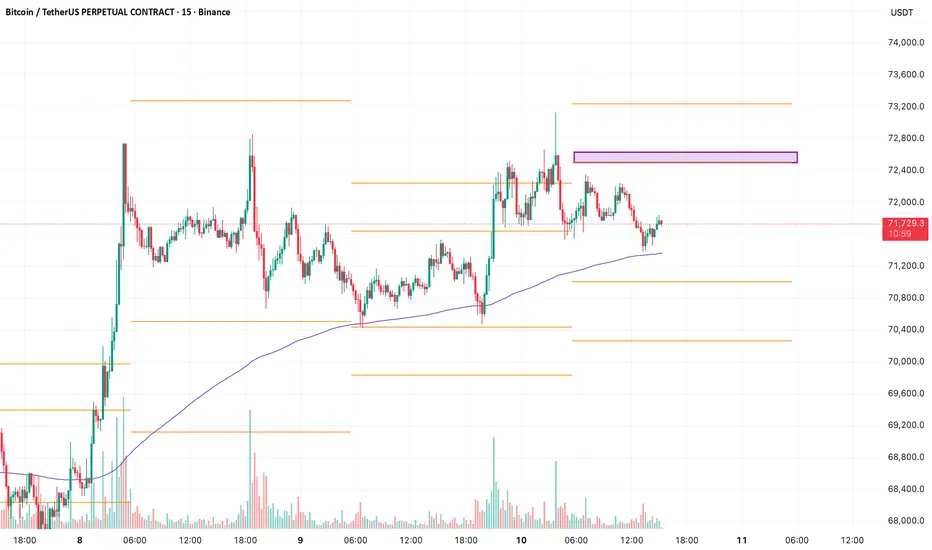
- ⚡Market Structure: The main macro trend remains bullish, indicated by a series of Higher Highs (HH) and Higher Lows (HL). However, the price is currently hitting the Major Supply Zone in the 73,000-75,500 range.
- ⚡Price Action: A strong rejection was seen on the last candles when they touched 74,000. The appearance of a long upper wick indicates significant profit-taking. The current price (72,817.52) is likely moving sideways below the resistance level.
-------------------------------------------------------------------------------------
✅ Key Zones:
- Resistance: 75,300 (ATH/Main Supply Area).
- Support: 70,800 (Minor Demand/Last BOS Area).
If we map the wave cycle, Bitcoin's current position appears very risky for buyers:
- ⚡Wave Structure: The impulsive rise from the 60,000 area appears to be completing the final phase of Wave 5.
- ⚡Current Status: The price of 72,817.52 is likely at the top of the final sub-wave of Wave 5. In theory, after the 5-wave cycle is complete, the market will enter the Corrective Wave phase (A-B-C).
- ⚡Projection: There is a risk of a fairly deep corrective decline (Wave A) towards the 68,000-70,000 area to balance the price before attempting to resume the uptrend.
The main bias for BTCUSD on the current H4 timeframe is NEUTRAL tending to BEARISH for the short term.
-------------------------------------------------------------------------------------
✅ Trading Plan:
- ⚡Correction Scenario: The price will likely move down to retest the 71,000 area. If this level is broken, the next correction target will be the area of fresh demand at 68,500.
- ⚡Breakout Scenario: This bias will only be invalidated if Bitcoin is able to break out and close solidly above the 75,500 level, which would open up room towards the psychological target of 80,000.  Short
Short
BTC/USD: Breaking the Consolidation for a Move to 100KBitcoin is currently exhibiting a potent bullish reversal after a period of significant consolidation. Following a volatile start to 2026, the script has reclaimed the critical $70,000 support zone, bolstered by a temporary US-Iran ceasefire that has restored global risk appetite.
Technically, the daily chart shows price action breaking above the Supertrend resistance (red cloud), signaling a shift in momentum. The recent accumulation of over 4.3 million BTC by retail investors, alongside steady spot ETF inflows, provides a solid fundamental floor. As institutional de-risking eases and global liquidity improves, the "digital gold" narrative is regaining traction.
With the immediate hurdle at $74,000 being tested, a successful breakout clears the path toward the psychological $90,000 mark. Given the thinning exchange reserves and structural resilience, we maintain a mid-term target of $100,000, anticipating a return to the all-time high territory established in late 2025.Key Levels & Targets
Current Price: ~$72,500
Immediate Support: $68,000 – $70,000
Mid-term Targets: $90,000 (Technical Resistance) | $100,000 (Psychological Milestone)
Stop Loss: Below $63,500 (Previous swing low) Long 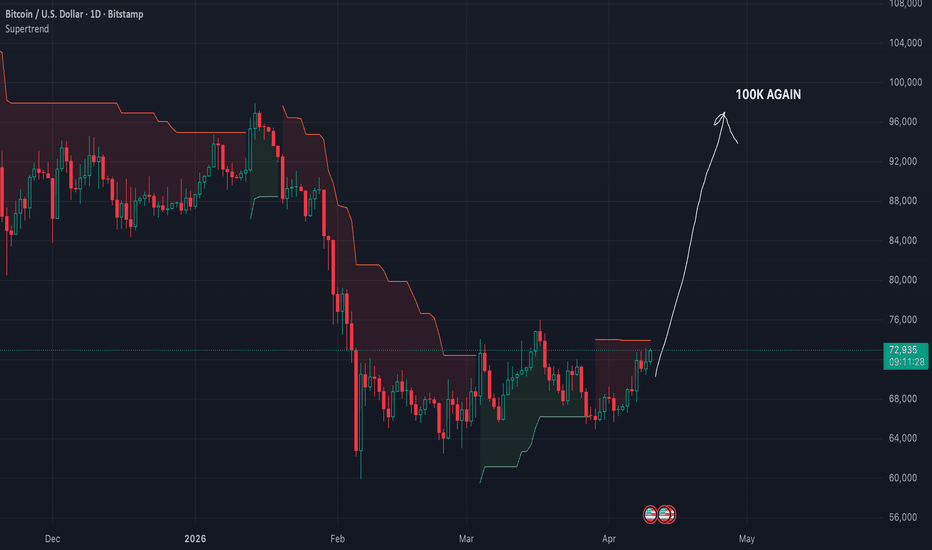
BTCUSD Swing Long Setup | Targeting 77.8K and 80.4KSharing my current BTCUSD long setup on the daily timeframe. Entry zone is around 72,700, with risk defined below 70,150. The chart suggests buyer strength after repeated support reactions, and I am watching for a move toward 77,880 as the first target and 80,416 as the second target.
This is a clean risk-to-reward setup based on structure, support confirmation, and momentum continuation. Trade management and patience will be key.
Levels to watch:
Entry: 72,722
Stop Loss: 70,153
Target 1: 77,880
Target 2: 80,416
This is for educational purposes only, not financial advice. Long 
Long 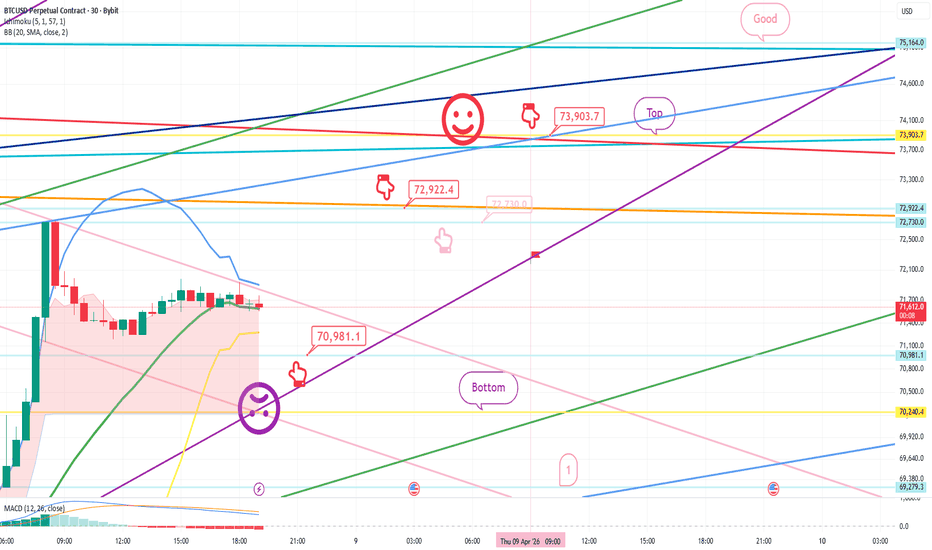
Bitcoin Bybit chart analysis APRIL 9Hello
It's a Bitcoin Guide.
If you "follow"
You can receive real-time movement paths and comment notifications on major sections.
If my analysis was helpful,
Please click the booster button at the bottom.
This is the Bitcoin 30-minute chart.
The Nasdaq indicators will be released shortly at 9:30.
-In the bottom left corner, I have connected the entry point of the long position I entered yesterday, $70,981.1, using a blue finger.
I have connected it exactly as it was. -
*Long Position Strategy based on the Red Finger movement path, before and after touching Purple Finger #1
1) After confirming the touch of Purple Finger #1 at the top, the Red Finger $70,940.1 is the entry point for the Long Position / Stop loss if the Green Support Line is broken.
(The stop loss is the same for those maintaining the $70.9K Long Position yesterday.)
2) $72,431.9 Long Position 1st Target -> Top Section 2nd Target Price
If it drops immediately without touching Section #1 at the top,
Hold for a final Long position at Section #2 at the bottom / Stop loss if the Green Support Line is broken.
- MACD pressure is currently in progress on the 4-hour chart.
- A vertical rise may occur if the purple support line is maintained.
Please be cautious, as a drop to the Bottom is possible if Section #2 is broken.
Please use my analysis merely as a reference.
I hope you operate safely by strictly adhering to trading principles and stop-loss orders.
Thank you.
Long 
Short
Long 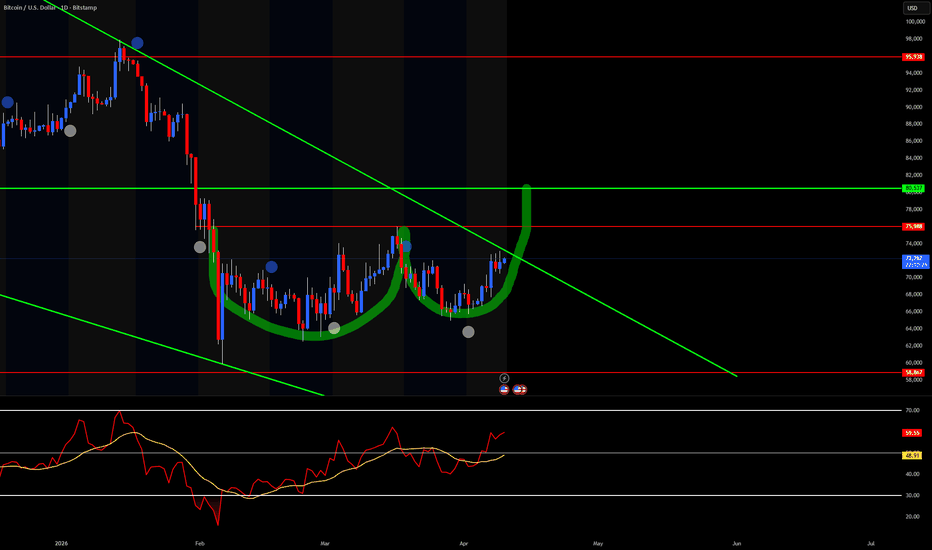
 Long
Long
 Long
Long
 Long
Long
Short 
Long 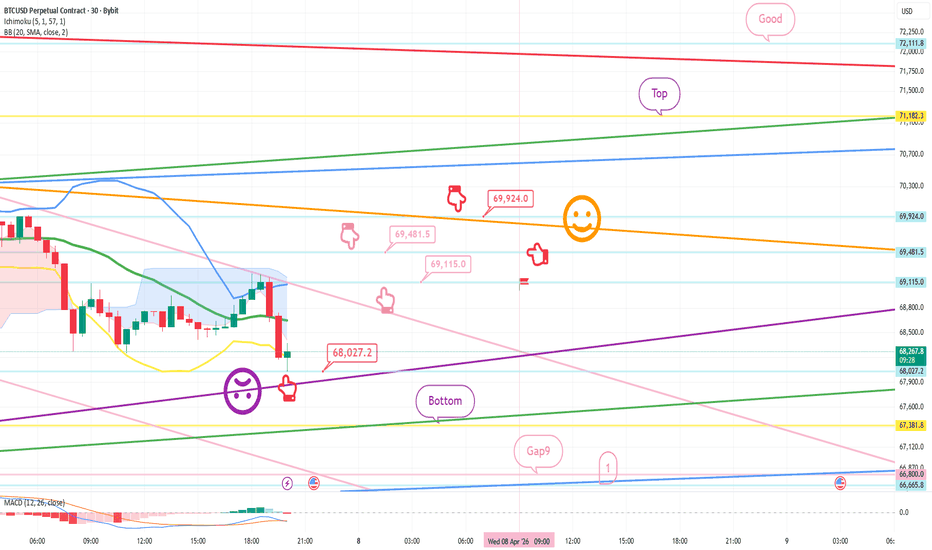
Short 
Short 
 Long
Long