BTCUSD Analysis: Bitcoin Rebounding from Support – Long Setup TaBased on the 1-hour chart for Bitcoin / U.S. Dollar (BTCUSD) from TradingView, the market has recently undergone a sharp corrective decline from its highs near 74,000. However, the selling pressure has stalled as the price found strong buyer interest near a key horizontal support level, paving the way for a potential bullish reversal.
Technical Breakdown
Support Base: The market has rejected lower prices right around the 65,690 - 65,712 zone (marked by the lower yellow horizontal line). This is serving as a strong floor where the price created a local bottom.
Current Price Action: BTCUSD is currently trading at 67,102.60, pushing upward off the support zone with a visible bullish candle development.
Market Structure: Large green upward arrows indicate an expectation of an incoming bullish wave, projecting a zig-zag recovery path (pink line) back toward overhead resistance.
Trade Execution Strategy (Long Position)
A long trade setup is active based on this local support bounce:
Entry Point: Market execution around the current price (~67,102.00).
Stop Loss (SL): Placed just below the recent swing low and support line at 65,712.13 to limit downside risk.
Take Profit (TP): Targeted at the major overhead resistance level of 70,059.99, with potential for an extended breakout past 70,103.47 if momentum sustains.
Educational Note & Disclaimer (English)
⚠️ Educational Purpose Only | Not Financial Advice
This trade setup is shared purely for educational purposes to help you understand market structure, high/low levels, and support zones. This is not financial advice. Every trader should analyze the market independently and trade at their own risk.
Market Tip: Watch the market structure closely here, guys. We are tracking how price bounces from these key highs and lows. We will look for a solid structure or a potential retest before deciding on further extensions. Trade safely and manage your risk!  Long
Long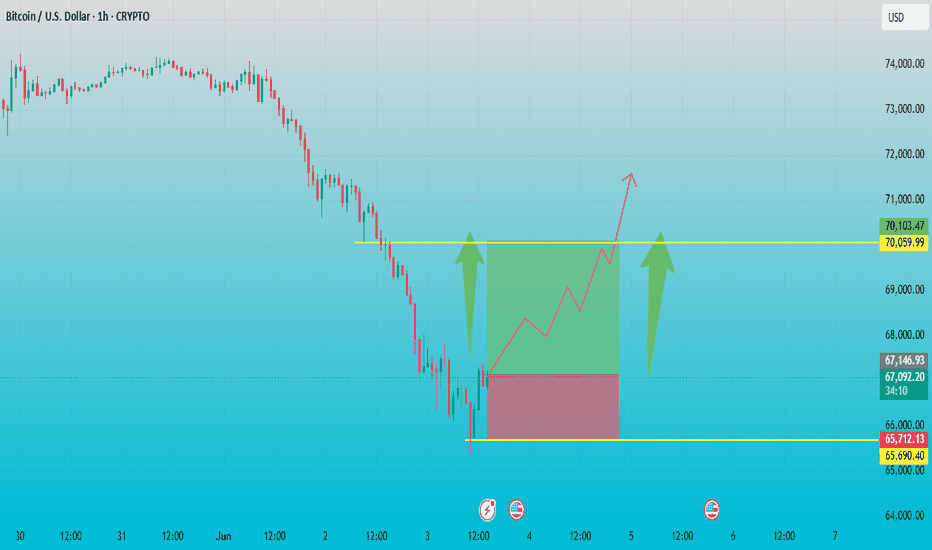
BTCUSDT: Massive 2x Measured Move Completed—Time to Buy?BTCUSDT has completed a massive 2x measured move downward from a premium supply zone and is currently testing a key historical Reversal Area between $65,000 and $65,650.
Market Overview & Structure
1. Supply Zone Distribution
The Premium Block: Price initiated a heavy sell-off from a well-defined distribution range between $77,000 and $78,000.
Institutional Imbalance: This zone represents an aggressive institutional supply imbalance that rapidly shifted market control to sellers.
2. The 2x Measured Move
The 1x Extension: The initial leg down established a definitive momentum benchmark.
The 2x Projection: Sellers completely exhausted the mathematical downside target at 2x Supply, plunging the market perfectly into the lower extreme.
Trading Setup: Long Position Potential
Execution Strategy
Entry Zone: Look for entries within the highlighted Reversal Area ($65,000 - $65,650). Wait for lower-timeframe validation (e.g., a bullish engulfing candle or a change of character on the 15m/1h charts).
Stop Loss (SL): Place strictly below $64,500 to protect against a liquidity sweep of the structural lows.
Take Profit 1 (TP1): $68,500 (Immediate structural resistance).
Take Profit 2 (TP2): $73,000 (Major mid-range supply block).
Long 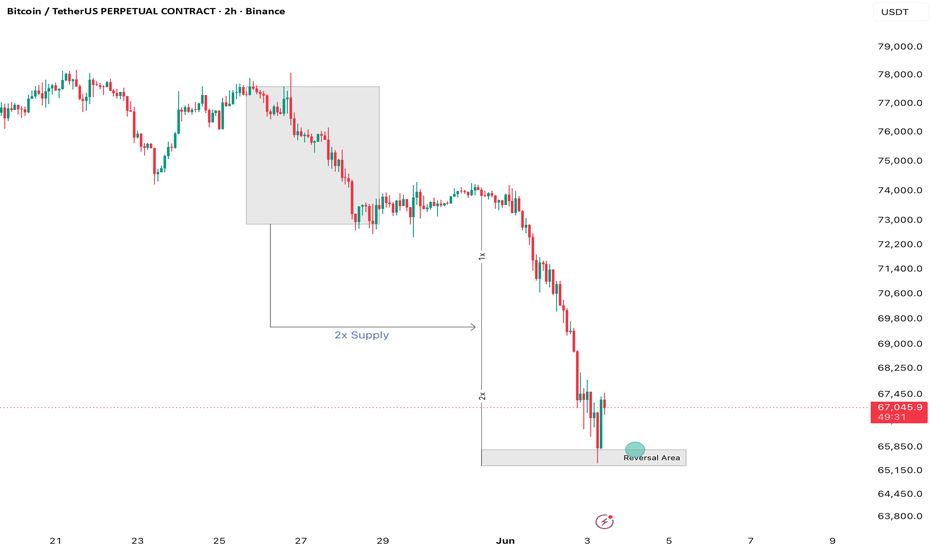
Short 
Short 
ETH Loses 2,000 as Sellers Stay in ControlETHUSDT remains bearish on H4 after losing the 2,000 psychological level. Price is below both EMAs, while the short EMA near 2,030 and the long EMA near 2,085 continue sloping downward.
The key support zone is 1,980–1,960. If ETH fails to hold this area, downside pressure may extend toward 1,920 and 1,880–1,840.
ETH sentiment remains weak, especially after the break below 2,000 and rising futures open interest, which increases the risk of sharp volatility.
Trade Plan
Buy setup: wait for ETH to test 1,960–1,940. If strong rejection or absorption appears, targets are 2,030 and 2,085.
Sell setup: if ETH closes H4 below 1,960, avoid catching the bottom. Targets become 1,920 and 1,880.
Continuation sell: if 1,880 breaks, the next liquidity zone may sit around 1,840.
Invalidation: strong H4 close above 2,085.  Short
Short
$BTC Profit Update - Called It. Clean -19% Exactly As PlannedCRYPTOCAP:BTC Profit Update - Called It. Clean -19% Exactly As Planned
When I Told You $80K Was Heavy Resistance + FVG, And That From $82,800 We Were Ready To Dump Toward $68K... Many Called Me "Stupid." I Said Nothing. I Just Watched The Market.
Result → Bitcoin Dropped From $82,800 To $67,000. A Clean -19%.
This Is The Power Of SMC.
Liquidity Grab → FVG → Order Block. Most People Never See It Coming. I Layer Market Psychology On Top Of The Technicals, That's Where The Accuracy Comes From.
I Don't Win Every Time, Nobody Does. But I Always Give You My Best Read, Not Hype.
What's Next:
→ LH Finally Formed (Since Jan 2026). I've Been Waiting Long For This Confirmation.
→ Stop Loss Moved Down: $98,000 → $82,800 ( Because $98,000 Was Very Big Stop Loss)
→ $82,800 Is Now The Critical ChoCH Trigger. Only A High-Volume HTF Close Above Flips Us Bullish.
My Bias → Still Lower:
→ Possible Relief Bounce Toward ~$75K First
→ Next LL Target Around $50,000
→ Break Of BOS At $59,800 Opens The Door To $50K And If Momentum Stays Heavy, Even $45K–$40K In Play
We're Likely Heading Toward $50K This Year. Patience Over Prediction.
Bookmark This. Thank Me Later.
TA Only. Not Financial Advice. ALWAYS DYOR. Short 
 Long
Long
Long 
Bitcoin Looks Ready To Go Further Down BTC continues showing a bearish market structure on the daily timeframe, with sellers still controlling momentum.
📊 Key Levels To Watch:
🔴 Resistance Zones:
• 70,111
• 72,512
🎯 Downside Targets:
• 67,000
• 65,000
The preferred setup remains waiting for a rejection from resistance before looking for downside continuation. A strong rejection candle or bearish engulfing pattern near resistance could provide confirmation.
🟢 Bullish Invalidation:
A strong daily close above 72,512, and especially above 74,198 with convincing volume, would weaken the bearish outlook and suggest a potential trend reversal.
⚠️ For now, the trend remains bearish until proven otherwise. Short 
Long 
BTCUSD (1H) SMC Long Setup:Demand Mitigation Before The New PushHello Traders,
Looking at the 1-hour timeframe for Bitcoin (BTCUSD), we are seeing a clean, textbook Smart Money Concepts (SMC) structure. The market has been consolidating between a well-defined premium supply zone and a strong discount demand zone.
The immediate price action suggests a high-probability liquidity sweep and mitigation play before the next leg up. Here is the full technical breakdown:
📊 Technical Breakdown:
The Range & Consolidation: Bitcoin is currently consolidating around the $73,430 level, catching retail buyers in the middle of a range.
Supply POI (Resistance): There is a clear institutional supply block resting at the $74,074 - $74,200 region, which has capped the recent upside momentum.
Demand Zone (Support): On the lower end, we have a pristine, unmitigated 1H demand zone sitting perfectly at $72,549. This zone aligns with prior institutional buying and represents a key discount array.
🎯 The Trade Plan (Long Setup):
We are avoiding entries in the middle of the range. The plan is to wait for the market to purge internal range liquidity, tap into our extreme demand area, and reverse.
Entry Zone (POI): $72,500 - $72,600 (Waiting for a clean mitigation of the demand zone).
Stop Loss (SL): Below $72,296 (Invalidation point strictly below the demand structure).
Take Profit (TP): $74,074 (Targeting the unmitigated major Supply POI).
💡 Execution Tip:
Let the market sweep the impatient buyers first. Once the price drops into the $72,549 demand zone, drop down to lower timeframes (like the 5M or 15M) and look for a Change of Character (CHoCH) or a displacement candle before clicking buy.
If you like this institutional price action mapping, please support it with a LIKE and FOLLOW for more daily crypto and forex updates! Share your bias in the comments below.
Disclaimer: This analysis is for educational purposes only and does not constitute financial advice. Always practice proper risk and position sizing. Bitcoin Crash Is Coming? Weekly Looks Dangerous!!!!If you want to understand where Bitcoin is going next — stop looking at the news. Stop listening to the influencers. Just look at this chart. Because this chart is telling you everything you need to know.
First. The Big Structure.
Bitcoin has been moving inside a clean ascending channel since 2020. Lower band. Upper band. Mid line. Respected consistently through every bull run, every crash, every halving cycle, every macro shock.
Five years. Same channel. Zero violations.
That structure alone tells you the long term trend is unambiguously upward. Whatever noise happens in between — the channel keeps doing its job.
Now here is where it gets fascinating.
Look at 2023 to 2024. Bitcoin was consolidating after a big move. Formed a Bullish Flag — a tight downward sloping consolidation after a strong rally. Textbook pattern. And then — it broke out explosively. Went from $40,000 all the way to $126,272. A 3x move from the flag breakout. Everyone who understood that flag made extraordinary returns.
Now look at what is happening right now in 2025 to 2026.
History is rhyming.
After hitting $126,272 — Bitcoin formed a Bearish Flag. A tight downward consolidation after a sharp correction. Same structure. Same channel. But this time on the downside.
And here is the critical part — the bearish flag has broken down. Price has come all the way to $71,295 — sitting right at the lower boundary of the multi year ascending channel.
This is the most important level on the entire Bitcoin chart right now.
What happens at the lower channel band determines everything.
This level has only been tested twice in the last 5 years. Both times — buyers defended it aggressively and the next move was explosive to the upside. Right now we are at that exact level for the third time.
Three scenarios:
If the lower band holds here — Bitcoin has just completed its bearish flag correction and is now setting up for the next major leg upward. Channel upper band sits at $140,000+. That is 90%+ from current levels.
If the lower band breaks on a weekly closing basis — the 5 year channel is violated and we reassess everything. Next major support would be $50,000 to $55,000.
But here is what makes this setup so powerful — the bearish flag measured move actually targets exactly the lower channel band. The pattern and the channel are pointing to the same level simultaneously. That kind of confluence on a weekly chart is extraordinarily rare.
The pattern within a pattern story.
2023 — Bullish Flag inside ascending channel → Broke up → 3x move.
2026 — Bearish Flag inside ascending channel → Broke down → Now at channel support.
Same channel. Same flag structure. Opposite direction. The channel absorbed both moves perfectly.
If the channel holds this time like it has held every single time before — Bitcoin is not in a bear market. It is in a correction within a bull market. And corrections within bull markets are buying opportunities — not reasons to panic.
The most important thing to watch
A weekly close below $65,000 would be a serious warning sign. That would mean both the bearish flag target AND the channel support have failed simultaneously.
But a strong weekly bounce and close above $80,000 from here — that would be the first signal that the channel is doing the next leg is beginning.
Watch this level more carefully than any news headline or influencer opinion. Short 
 Short
Short
Bitcoin chart analysis May 29Hello
It's a Bitcoin Guide.
My analysis is optimized for TradingView.
If you press the Replay button, you can check real-time movements.
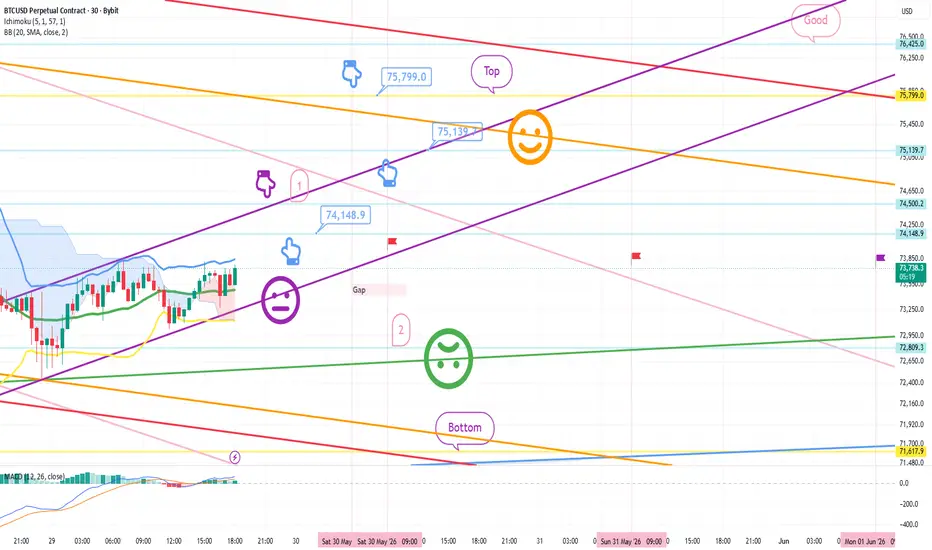
This is the Bitcoin 30-minute chart.
*Long Position Strategy: Before and after touching the purple finger zone #1 at the top
1) After confirming the touch of the purple finger zone #1 at the top,
Sky blue finger at $74,148.9 is the entry point for a long position / Stop loss if the purple support line is broken.
2) $75,799 is the 1st target for a long position -> Good 2nd target.
If the strategy is successful, $75,139.7 is the zone to utilize for re-entering the long position.
- If it drops immediately without touching the purple finger zone #1:
Lower zone #2 at 72.8K is the entry point for a long position / Stop loss if the green support line is broken.
If the green support line is broken, the Bottom zone at the bottom
(Mid-term Uptrend Line)
Although not visible on the screen, it could drop further down to 70.6K.
Before the June candle forms next month, the further the price moves upward over the weekend, the more favorable it is for long positions.
That is all for now. Please use my analysis merely as a reference and for practical application.
I hope you operate safely by adhering to trading principles and strictly using stop-loss orders.
Thank you. Long 
PREDICTION ON BTCUSD 4H TF BITSTAMP:BTCUSD appears to be displaying a clear ROS (Repetition of Structure), where a previously formed bearish sequence is now being repeated almost identically. While no outcome is guaranteed, the current market structure suggests that sellers remain in control and that further downside cannot be ruled out.
Structure Breakdown
The first bearish leg consisted of:
🔹 Blue Area – Fast Supply Expansion
A strong impulsive bearish move.
Indicates aggressive institutional selling pressure.
Price quickly moved lower with little resistance, leaving behind inefficiencies and weak bullish participation.
🔹 Green Area – Consolidation Phase
After the sharp decline, price entered a consolidation range.
This phase allowed the market to rebalance while trapping early buyers expecting a reversal.
Rather than reversing the trend, the consolidation acted as a continuation structure.
Looking at the right side of the chart, the market seems to be forming the same sequence once again:
✅ A new blue supply zone has already been created through another impulsive bearish move.
✅ Price has entered a green consolidation zone, similar to the previous structure.
✅ The red area is now beginning to form, suggesting the possibility of another downside expansion if the ROS continues to play out.
Blue Area → Fast Supply Expansion
Green Area → Consolidation
Red Area → Bearish Continuation
Since this exact sequence has already produced a substantial decline once, the market appears to be repeating the same behavior. If the pattern continues to unfold, BTCUSD could remain bearish over the coming days, with a potential liquidity sweep into the 70,300 reversal zone before a stronger bullish reaction is considered.
Bias: Bearish 📉
Key Observation: ROS remains intact.
Primary Objective: Downside liquidity and reversal area near 70,300.
Invalidation: A strong bullish break above the current consolidation structure and supply region Short 
Short 
Short 
 Long
Long
 Short
Short