Crypto market
BTCUSD at Key Support – Is a Strong Rebound Likely?BTCUSD has experienced a sharp pullback and is now approaching a demand zone that has previously triggered several strong price reactions.
Price is still holding above this area, so I'm watching closely to see whether buyers are beginning to absorb the selling pressure. If support remains intact and a clear bullish signal appears, BTCUSD could recover toward the 63,800 level.
The key here is confirmation. A strong bounce from this zone would support the bullish reversal scenario, while a decisive break below support would indicate that sellers are still in control. In that case, I would step away from the bullish bias and reassess the market structure.
This is simply my personal view of the chart and not financial advice. Always confirm your setups and manage your risk carefully.
Apple New all-time high over? Now looking for a Short!The recent move has been aggressive, with price breaking above the previous high and continuing to expand higher. Fundamentally, the rally has been supported by renewed optimism around Apple's AI strategy, its ability to monetize its massive device ecosystem, and the broader shift in sentiment toward Apple's relatively capital-light approach to AI.
But from a daily timeframe perspective, I am not interested in blindly shorting Apple simply because price has gone up a lot.
The trend is bullish. Price is making new highs, and until the structure actually gives me a reason to look for a reversal, I have no reason to force a short.
For me, Apple would need to form my Premium Short Model.
The setup I want to see is:
M formation → bearish displacement → retracement into an Order Block and FVG → final expansion lower.
In other words, I want price to first show me that buyers are losing control. A simple rejection from the high is not enough.
I want to see the M-shaped structure form, followed by a clear bearish displacement. Then, if price retraces back into the relevant OB/FVG, that becomes the area I would be watching for the final move lower.
Until that happens, my bias remains simple:
RAppLUSDT is bullish until the chart gives me a reason to be bearish and since rTokens are traded 24/7, It will give me better leverage in getting well informed of when it happens rather than waiting for when market opens on Monday..
RShort
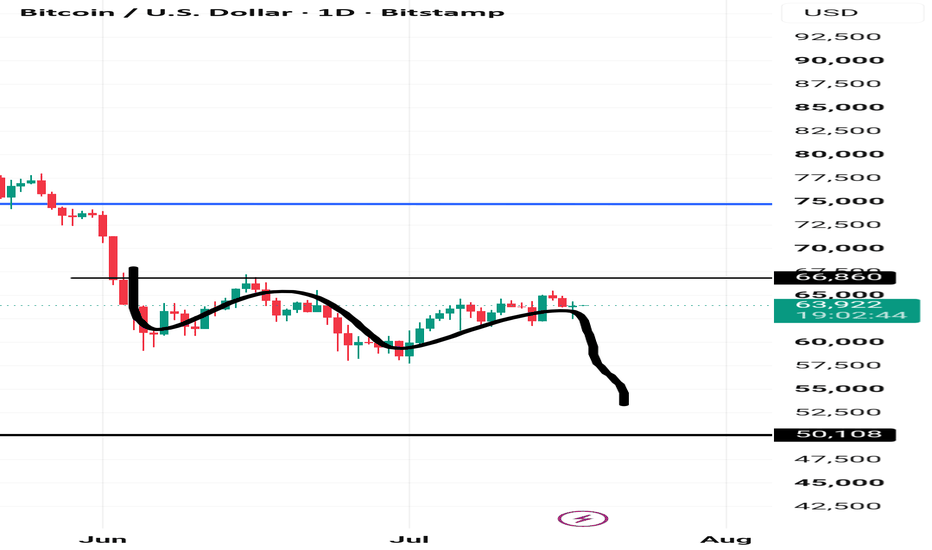
BTC technical outlook: bearish continuation to $61k?Bitcoin is currently trading around the 64,359 area, but the recent price action is showing signs of weakness.
Price has failed to maintain bullish momentum and is struggling around the current resistance zone. From a technical perspective, I’m watching for a rejection from this area, followed by a move lower toward the 61,196 level.
The key idea here is a potential liquidity run and bearish continuation.
My bearish scenario:
64,359 rejection → bearish continuation → 61,196 target
For this setup to remain valid, I want to see price continue printing lower highs and maintain bearish market structure. A strong reclaim above the current resistance would weaken the short-term bearish bias.
MRVL is currently sitting at an interesting technical area.After the extended sell-off from the $220 region, price has been consistently printing lower highs and lower lows. However, the recent move into the $177.50 area has started to show a possible shift in short-term structure.
Price has now formed what looks like a potential double bottom around the lows. The first reaction from this area was followed by a strong recovery, and the second test has also produced a bullish reaction.
But I don't think the move higher is necessarily going to be straight up.
My expectation is for price to potentially retrace back toward the $174–$177 area, where liquidity could be taken before the real expansion higher. If that zone holds and price continues to build bullish structure, the next major target is around $208, which is the previous significant resistance/high.
So the idea is:
Liquidity sweep → bullish confirmation → expansion toward $208.
The interesting part is that we're heading into the weekend while the traditional stock market is closed.
Normally, if this were a traditional Nasdaq-listed stock, I would simply have to wait until the market reopens to react to new price action.
But with this rTokens, the underlying stock exposure remains tied 1:1 to the Nasdaq reference price, while the token itself can continue trading 24/7.
That means if the technical setup continues developing over the weekend, I don't necessarily have to wait for Monday's traditional market open to participate in the move. Quite impressive on this one
RShort
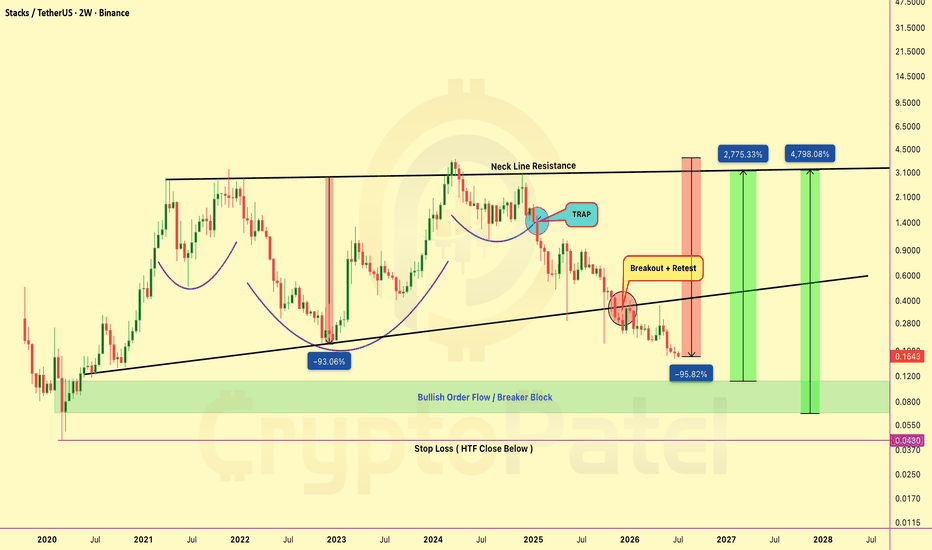
$STX Just Crashed 96%... But This Could Be The Opportunity EveryNASDAQ:STX Just Crashed 96%... But This Could Be The Opportunity Everyone Misses.
Retail Got Trapped By A Fake Inverse Head & Shoulders Near The Top...
While Smart Money Distributed Into The Hype.
Now NASDAQ:STX Is Trading Inside A High-Risk HTF Accumulation Zone.
📍 HTF Demand: $0.110–$0.070
📍 Bullish Reclaim: Above $0.40
📍 Invalidation: 2W Close Below $0.043
If This Zone Holds...
The Long-Term Upside Could Reach As High As 10x-30x In The Next Bull Cycle.
The Best Opportunities Usually Appear After Maximum Pain... Not Maximum Hype.
NFA & DYOR
$HYPE down 24% from our Short Entry level... What Next?I Warned About This XETR:HYPE Dump Before It Happened: Down 24% Exactly As Expected
On June 2, I highlighted the $750-$90 zone as a major resistance for XETR:HYPE and warned that a rejection there could lead to a pullback.
Since then, XETR:HYPE has dropped to around $58, a decline of roughly 24% from that resistance zone.
If you followed the setup for a scalp or short swing trade, this was a good area to consider taking profits.
I'm still watching the $44-$38 zone as the next major accumulation area, but only if the overall market conditions remain supportive. Until then, patience is key.
I'll share an update if price reaches that region.
NFA & DYOR
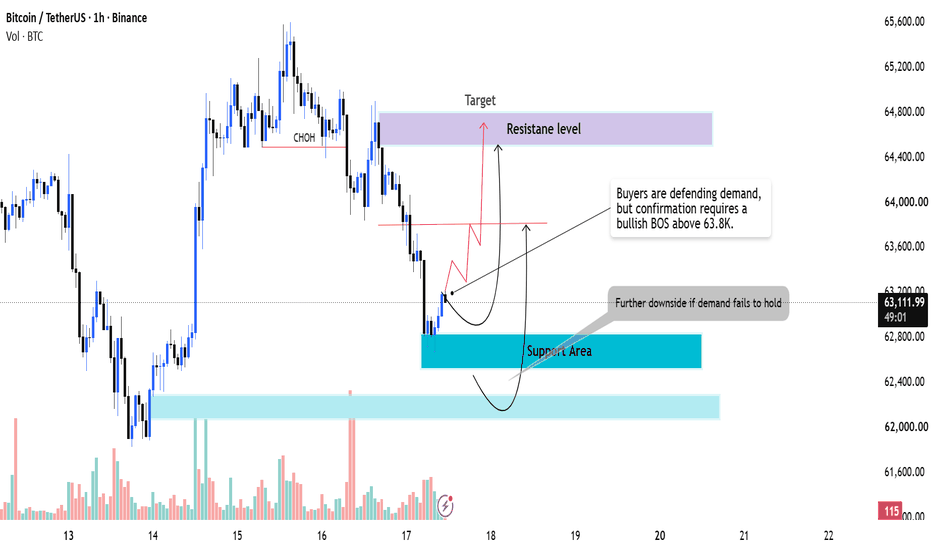
BTCUSDT Demand Bounce Toward ResistanceBTCUSDT is currently reacting from a well-defined 1H demand zone after an impulsive bearish move. The decline created a clear Change of Character (CHoCH) to the downside, keeping the short-term market structure bearish. However, buyers have stepped in at support, suggesting a relief rally could develop before the next directional move.
From an SMC perspective, the recent sell-off likely swept liquidity below short-term lows and left an imbalance that price may attempt to rebalance. As long as the demand zone around 62.6K–62.8K holds, BTC has room to retrace toward the 63.8K resistance and potentially test the higher supply zone at 64.5K–64.8K.
A bullish confirmation would require a Break of Structure (BOS) above the recent lower high. Failure to hold the current demand zone would invalidate the recovery scenario and increase the probability of a continuation toward the 62.0K higher-timeframe support.
Key Levels
Support: 62.6K–62.8K
Major Support: 62.0K–62.2K
Resistance: 63.8K
Target Supply: 64.5K–64.8K
Bias: Short-term bullish retracement while above demand; overall trend remains cautious until buyers reclaim 63.8K.
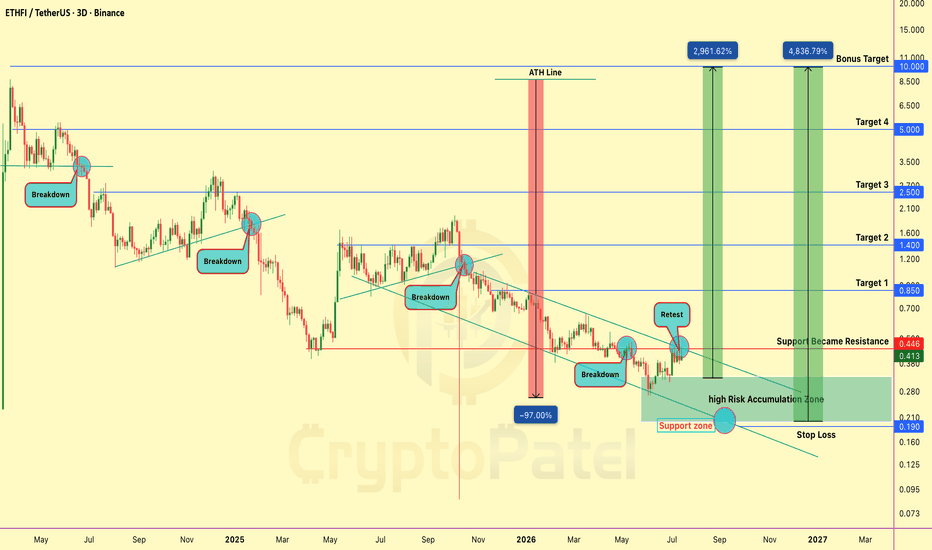
$ETHFI Is Down 97%... But This HTF Setup Could Lead To A 2,900%?CRYPTOCAP:ETHFI Is Down 97%... But This HTF Setup Could Lead To A 2,900%+ Recovery
#ETHFI Has Completed A Multi-Month Bearish Cycle And Is Now Testing A Critical HTF Decision Zone. After A Classic Breakdown → Retest Pattern, Price Is Approaching The Level That Could Decide Whether The Downtrend Continues Or A Macro Reversal Begins.
Technical Structure
✅ Multiple HTF Trendline Breakdowns Confirmed
✅ Price Retesting Broken Trendline Resistance
✅ Major S/R Flip: $0.45 (Bullish Above / Bearish Below)
✅ High-Risk Accumulation Zone: $0.32–$0.20
✅ HTF Invalidation Below $0.19
✅ Resistance Levels: $0.85 → $1.40 → $2.5 → $5 → $10
➡️ Nearly -97% Correction From ATH Completed
➡️ Current Phase: Breakdown Retest At HTF Resistance
➡️ Key Level To Watch: $0.45 & Super Bullish Above $0.66
Scenario 1 → Bullish Reversal:
A Confirmed HTF Close Above $0.45, Followed By A Successful Retest, Would Signal A Trend Reversal And Open The Path Toward $0.85 → $1.40 → $2.50, With Higher Targets At $5–$10.
Scenario 2 → Final Pullback:
Failure To Reclaim $0.45 Could Push Price Back Into The $0.32–$0.20 Accumulation Zone, Offering The Best Risk/Reward Area For Long-Term Investors.
Structure Shift Requirements
1️⃣ HTF Close Above $0.45
2️⃣ Successful Retest As New Support
3️⃣ Acceptance Above $0.66 For Trend Expansion
Bull Cycle Targets: $0.85 → $1.40 → $2.5 → $5 → $10
Invalidation: HTF Close Below $0.19
The $0.32–$0.20 Region Remains The Highest Conviction Accumulation Zone For ETHFI/USDT. Until $0.45 Is Reclaimed On A Higher Timeframe Closing Basis, The Macro Trend Remains Neutral-To-Bearish.
TA Only. Not Financial Advice. ALWAYS DYOR.
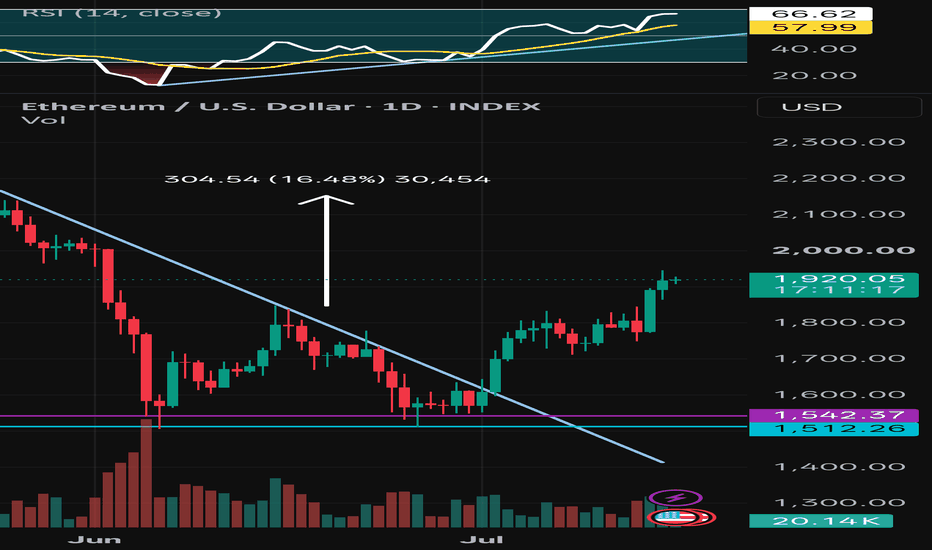
Ethereum at Make or Break pointOn a monthly chart ETH did a bad close by closing the previous pump's close. But on a weekly chart it has made a very good close by doing a bullish engulfing candle at facing a strong resistance at 1800 - 1840 Range. If Ethereum can break the support above and flip this resistance into support this might be the bottom for ethereum and considering that the current macro range is being done for 4 years, we might see All Time highs for ethereum in 2027. But based on the price action the current support of 1550 - 1600 acts as a strong support. If at all there is a dip to this range, strongly recommend to buy in this level. Another thing to note is that ETH has not done a close above 7EMA in Weekly chart. Once done it would confirm the local bottom is IN and push prices higher.
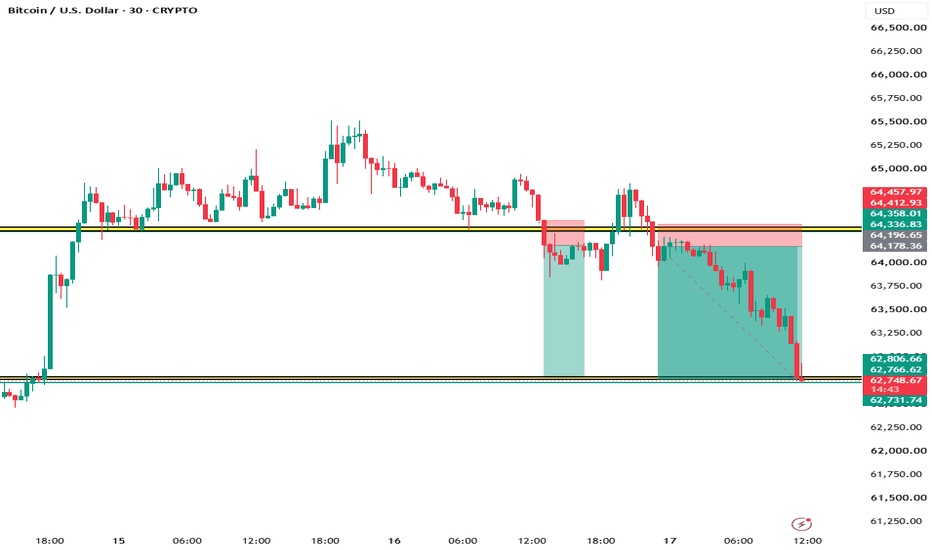
BITCOIN 1:6 RISK-REWARD TARGET ACHIEVED🚨 Bitcoin Trade Recap: 1st Stop Loss Hit ❌ | 2nd Entry Delivered Massive 1:6 RR Profit ✅🔥
Discipline beats emotions in trading 📈
❌ 1st Bitcoin short trade hit stop loss exactly as planned.
✅ Waited patiently for the setup to confirm again.
🚀 2nd entry from the breakdown zone delivered a perfect **1:6 Risk-Reward target** with exact levels.
This trade proves that a single losing trade means nothing when risk management and patience are followed correctly.
🔹 1st Trade → Stop Loss Hit
🔹 2nd Entry → 1:6 RR Target Achieved
🔹 Price Action + Risk Management + Patience = Profit
No revenge trading. No emotions. Just execution according to the plan.
Follow * for daily market analysis, Bitcoin setups, Nifty analysis, stock market education and institutional trading concepts.
bitcoin analysis, bitcoin trade, btcusd analysis, bitcoin short trade, crypto trading, bitcoin breakdown trade, risk reward trading, 1 to 6 risk reward, price action trading, smart money concepts, ict trading, ict concepts, supply and demand trading, support and resistance, liquidity sweep, market structure break, breakout trading, breakdown trading, institutional trading, crypto analysis, intraday trading, scalping strategy, technical analysis, trading psychology, risk management, stop loss strategy, sniper entry, trading discipline, cryptocurrency market, bitcoin price prediction
#Bitcoin #BTC #CryptoTrading #PriceAction #ICTTrading
❌ 1st SL Hit
✅ 2nd Entry = 1:6 RR Profit
🔥 Exact Levels | Perfect Execution
watchout in btcAs of now, btc is trading near 1H CHOCH (change of structure), ffrom here is new low is being formed , retracement break again than btc will go down further, there is 60800 support and gap 1hr fvf is still unfilled.
as of now there is a bearish Order block at 63540 to 63945 , so till two one hour candle form above this band dont buy, and any rejection on an upside in this level will be oppurtunity to sell. so wait now
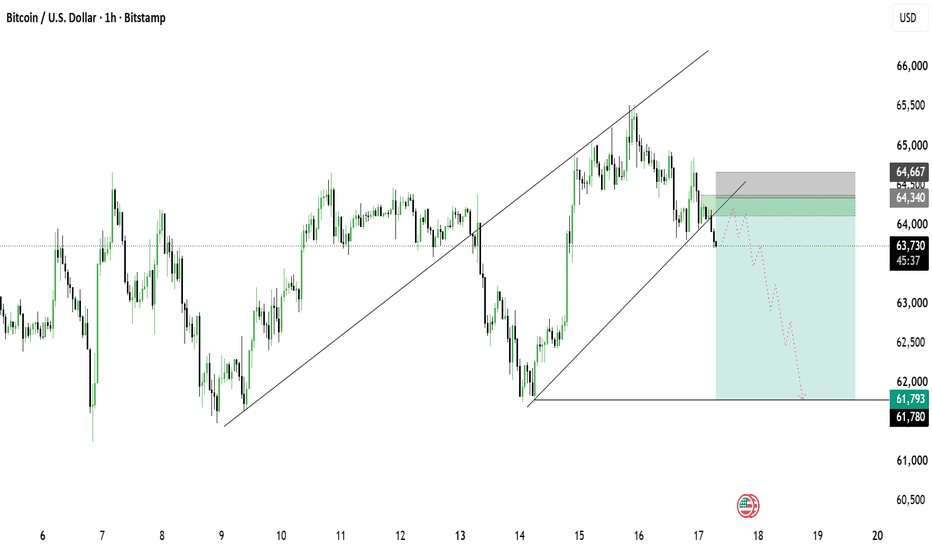
BTCUSD H1: Ascending Channel Breakdown & Potential Retest SetupAn interesting structural shift is unfolding on Bitcoin (BTCUSD) within the 1-Hour (H1) chart. After respecting a well-defined ascending parallel channel for multiple days, the price has finally breached the lower boundary, indicating an influx of bearish momentum.
📊 Market Context & Observations:
Channel Breach: The clean breakdown below the diagonal dynamic support suggests that buyers are temporarily losing control of the immediate trend.
Price Action Behavior: Following the breakdown, the market is currently experiencing a minor corrective bounce back toward the confluence zone.
The Area of Interest (AOI): The region around 64,340 – 64,500 is acting as a key structural pivot point. This marks the retest of the broken channel floor and previous minor resistance.
🎯 Tactical Parameters:
If the bearish pressure sustains and confirms exhaustion around this confluence area, we could see a continuation toward lower liquidity pools.
Potential Entry Window: Execution upon lower timeframe confirmation/rejection candles near the 64,340 zone.
Invalidation Point (SL): Placed strictly above the recent swing high at 64,667. This tight setup maintains an exceptional risk efficiency.
First Liquidity Target (TP1): 63,000
Major Target Pool (TP2): 61,793
📌 Risk & Accountability Disclaimer:
Execution is strictly subjective to your personal risk management strategy. Trading cryptocurrencies involves substantial volatility. This layout highlights a purely technical observation based on current market structure and is not financial advice. Protect your capital and manage your position sizes carefully
BTC 4H Initial Reversal Signals Short-Term DownsideBitcoin is currently trading beneath a Bullish Resistance Curve on the 4-hour timeframe, where price has formed a 4H Initial Reversal (I.R.). This structure suggests that the recent pullback is likely a continuation pattern rather than the beginning of a fresh bullish trend.
According to the Market Footprinting Trading Concept, the Bullish Resistance Curve is acting as dynamic resistance, preventing buyers from pushing the market into a new impulsive move. As long as BTC remains below this curve, sellers retain the short-term advantage.
Trading Plan
Market Bias: Bearish (Short-Term)
Timeframe: 4H
Confirmation: 4H Initial Reversal (I.R.)
Entry Strategy: Wait for a 5-Minute Initial Reversal (I.R.)
Target: The highlighted support zone around 63,200–63,300.
Invalidation: A strong 4H candle close above the Bullish Resistance Curve would invalidate the bearish outlook.
From a Market Footprinting Trading Concept perspective, the current structure favors continuation to the downside. Bitcoin is expected to remain under selling pressure until a confirmed 4H Upside Initial Reversal (I.R.) develops. Until then, rallies into resistance may provide higher-probability short opportunities after lower-timeframe confirmation.
Disclaimer: This analysis is for educational purposes only and reflects the Market Footprinting Trading Concept. Always wait for confirmation and practice proper risk management before taking any trade.
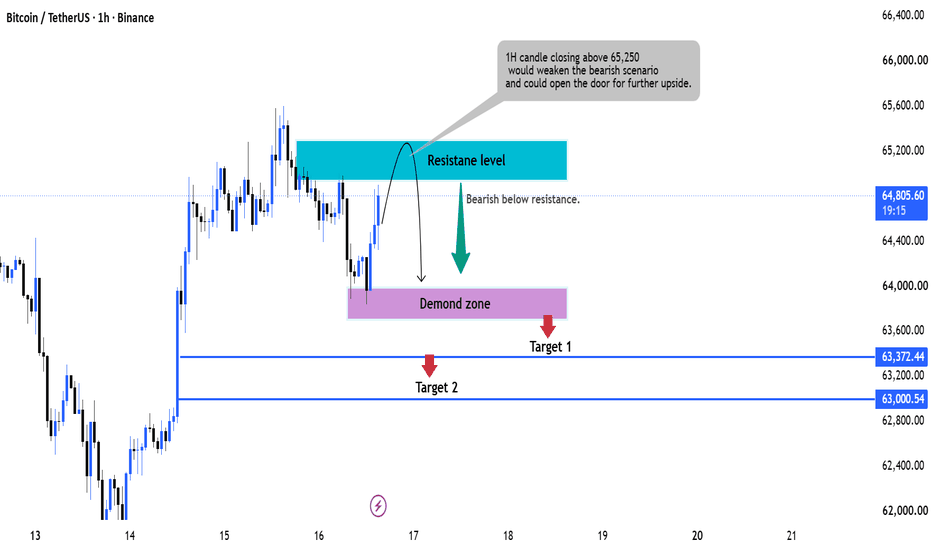
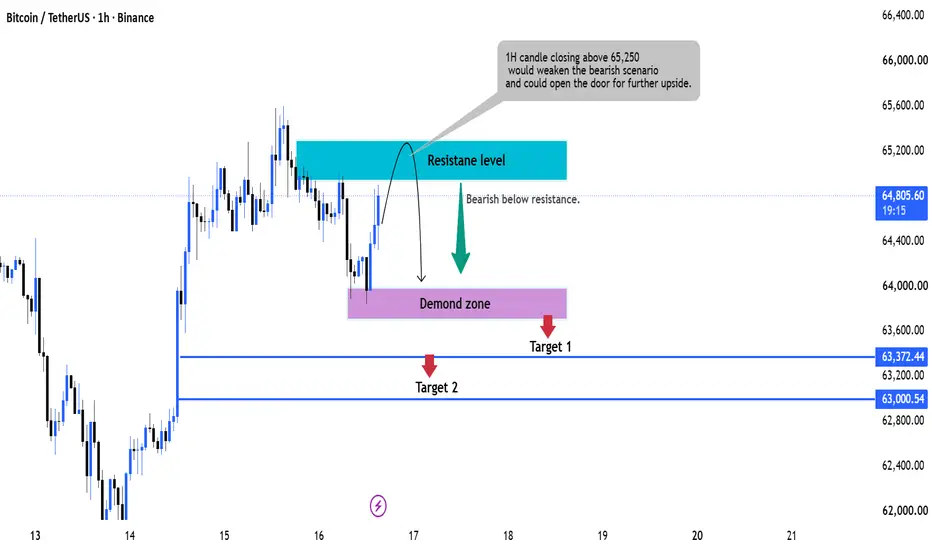
BTCUSDT Resistance Retest – Bears in ControlBTCUSDT has recovered from the recent demand zone and is now retesting a significant resistance area around 65,000–65,250. This zone has previously rejected price, making it a key level to watch for renewed selling pressure.
If buyers fail to secure a strong breakout above resistance, a bearish rejection could trigger another move lower toward the highlighted demand zone. A breakdown below that support would increase the probability of a decline toward Target 1 (63,372), with Target 2 (63,000) as the next downside objective.
A sustained close above the resistance zone would invalidate the bearish setup and shift momentum back in favor of the bulls.
Key Levels:
Resistance: 65,000–65,250
Demand Zone: 63,700–63,950
Target 1: 63,372
Target 2: 63,000
Invalidation: 1H close above 65,250
BTC Long Setup: High-Probability Dip Buy OpportunityBitcoin is showing signs of strength around the 65,000 support zone, making this an attractive area for a potential long entry.
Trade Plan:
Entry: Around 65,000
Add on Dip: 64,600
Stop Loss: 64,200
Target 1: 65,800–66,000
Target 2: 67,000
Target: Open beyond 67K if bullish momentum continues.
The 65K region is acting as a key support, and as long as price holds above the stop-loss level, the risk-to-reward remains favorable. Watch for increasing volume and bullish confirmation before adding aggressively.
Risk Management: Always manage your position size and stick to your stop-loss. This is a trade setup, not financial advice.
📌 Disclaimer:
This analysis is for educational purposes only and is not financial advice. Always manage risk and follow your trading plan.
Your feedback drives our content and keeps everyone trading smarter. Let’s make those pips together! 🚀
Happy Trading,
– The InvestPro Team
$GRASS Could Be Setting Up For A 4,200% Rally…?$GRASS Could Be Setting Up For A 4,200% Rally… But Only If This HTF Level Holds
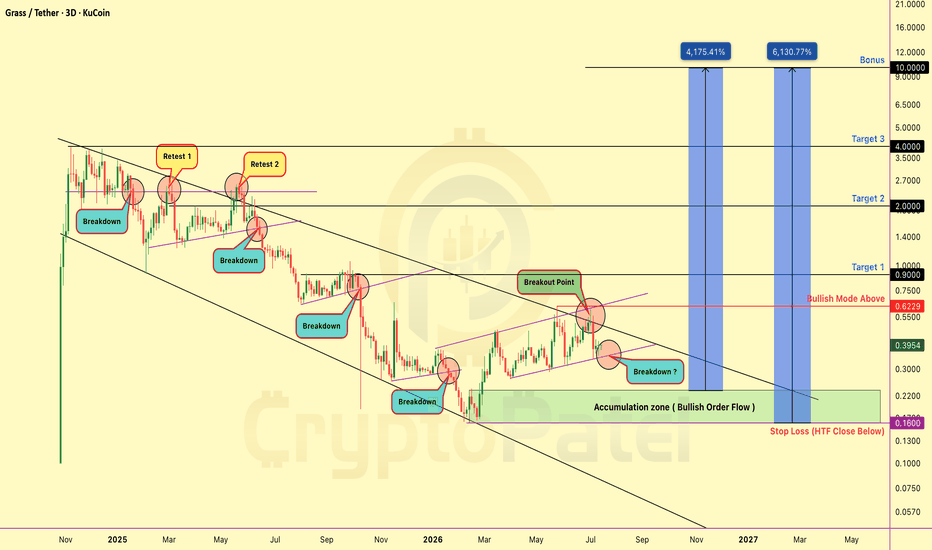
#GRASS Has Been Trading Inside A Long-Term Descending Channel Since Listing. After Multiple Rejections At Channel Resistance, Price Is Now Pulling Back Into A High-Timeframe Accumulation Zone.
Technical Structure
✅ Long-Term Descending Channel Still Intact
✅ Multiple Rejections At Channel Resistance Confirm Macro Downtrend
✅ HTF Accumulation Zone: $0.23–$0.16
✅ Current Price Testing A Major Decision Area
✅ Major S/R Flip: $0.6229 (Bullish Above / Bearish Below)
✅ Resistance Targets: $1 → $2→ $4 → $10+
✅ Risk Invalidation: HTF Close Below $0.16
➡️ Post-Listing Distribution Inside Descending Channel
➡️ Current Phase: Pullback Into HTF Demand Zone
➡️ Waiting For A Confirmed Macro Trend Reversal
Scenario 1 → Bullish Reversal:
If GRASS Holds The $0.23–$0.16 Zone And Breaks Above The Descending Channel, A Macro Trend Reversal Could Begin.
Targets: $1 → $2 → $4
Extended Bull Cycle Target: $10+
Scenario 2 → Bearish Continuation:
A Confirmed HTF Close Below $0.16 Would Invalidate The Bullish Setup And Increase The Probability Of Another Leg Lower.
Structure Shift Requirements
1️⃣ Hold $0.23–$0.16 HTF Demand
2️⃣ Break Descending Channel Resistance
3️⃣ Flip Resistance Into Support
The $0.23–$0.16 Region Represents A High-Risk, High-Reward Accumulation Zone For Long-Term Investors. Until The Descending Channel Is Reclaimed, The Macro Downtrend Remains Intact.
TA Only. Not Financial Advice. ALWAYS DYOR.
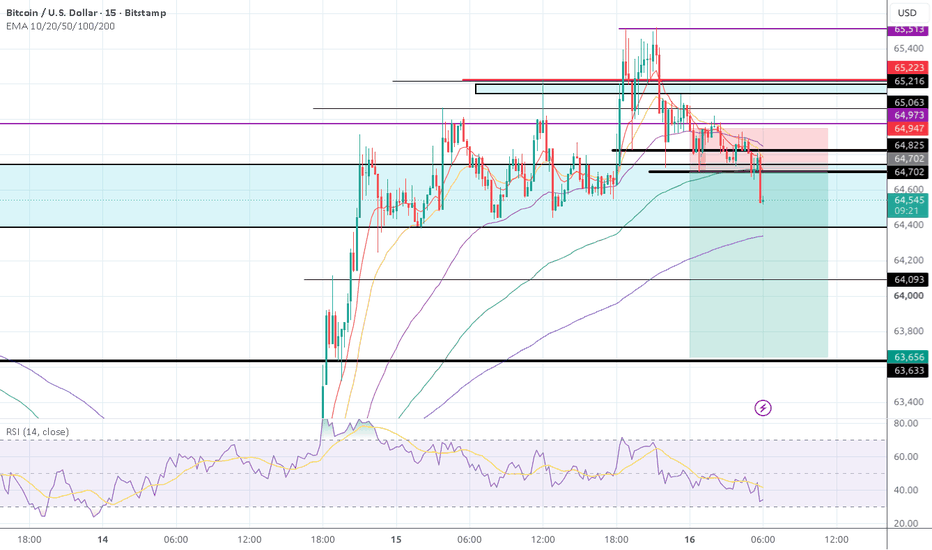
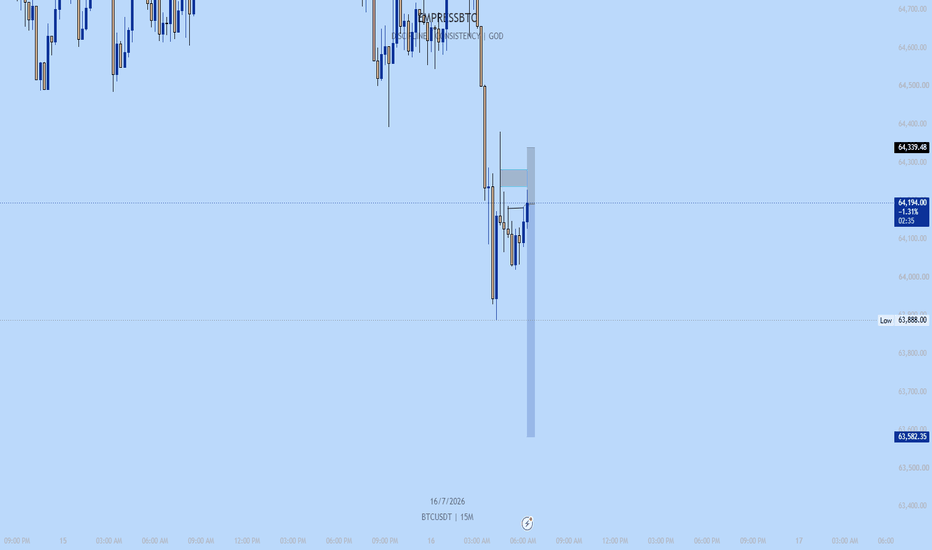
15 MIN BTC Confirmation Bearish MoveExpecting BTC to see a quick short move today.. Because I have been anticipating BTC to be bearish before a quick run, we have seen that so now what is expected is to a quick reversal and don't forget we still have pending SSL liquidity that wasn't touched before the massive run
Trading AnalysisWhere is Nifty right now?
Nifty closed at 23,689 on Thursday May 14. After a brutal fall earlier this week (it touched ~23,300), it bounced back for 2 days in a row. So right now it's in a recovery mood — but it hasn't really "fixed" itself yet. Think of it like someone who had a fever, now feeling slightly better, but not fully healthy.
2 What's the wall above? (Resistance)
If Nifty tries to go up next week, it will hit a wall around 23,500–23,600 first. That's the first test. If it somehow crosses that, the BIGGER wall is at 23,900–24,000 — where all the major moving averages (50-day & 200-day) are sitting. Lots of sellers will be waiting there to book profits. So going above 24,000 next week? Unlikely unless something very positive happens.
3 What's the floor below? (Support)
If Nifty starts falling, the first safety net is around 23,300–23,150. This zone has held multiple times recently. If it breaks this level decisively (and stays below it), then the next stop could be 23,000 or even 22,900. That's the danger zone — but that's not the most likely scenario for next week.

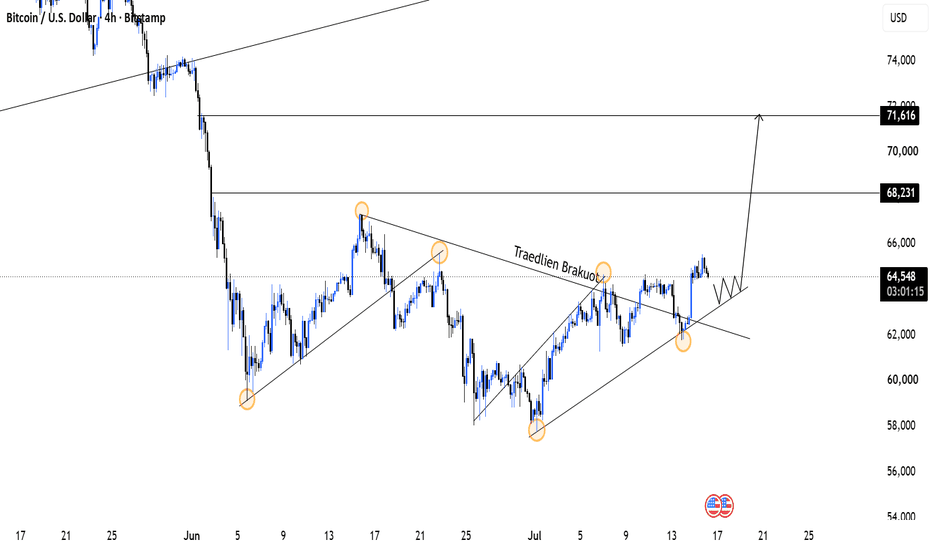
#BTCUSD 4H Trendline Breakout & Bullish Continuation SetupBitcoin has delivered a clean structural shift on the 4-hour timeframe, confirming a decisive breakout above the long-term descending counter-trendline. Price action has successfully mitigated the macro lows and is now establishing a bullish order flow characterized by consecutive higher highs and higher lows. 📈
The current price behavior indicates a healthy post-breakout consolidation phase. We are anticipating a minor technical accumulation or retest pattern near the newly established ascending support structure before the next expansion leg takes place.
🔹 Entry / Long Monitoring Zone: 63,600 – 64,300 (Broken Trendline & Ascending Support Confluence)
🔴 Invalidation / SL: Sustained daily close below 62,000
🎯 Target 1: 68,231 (Major Swing High Resistance)
🎯 Ultimate Target: 71,616 (Buy-Side Liquidity Pool)
The objective is to wait for lower timeframe accumulation or clean structural rejection within the consolidation zone to confirm the buyers' presence. No chasing the market, let the setup develop seamlessly. 🔍
Trade with discipline and always prioritize capital preservation! 💼🔥