$SOL is trading within a rising wedge pattern on the 4hr chartCRYPTOCAP:SOL is presently trading within a rising wedge pattern on the 4-hour chart, with the current price around $82–$83 following a pullback from the recent $94 resistance level. The structure has been respected multiple times, and price is now approaching the lower wedge support, which is the key area to watch.
Current situation:
The $80–$81 region is acting as the lower boundary of this wedge. If buyers defend this support again, it could trigger another short-term bounce toward the upper wedge, similar to previous rotations inside the structure.
As long as #SOLANA holds this lower trendline, a reaction toward $86 → $90 is possible, with the $92–$94 zone remaining the major resistance near the upper wedge.
This type of structure often creates range trades inside the wedge, where price moves between the lower and upper boundaries before a decisive breakout happens.
However, if $80 breaks and price closes below the wedge, the structure weakens and we could see a deeper move toward $76–$74, which was the previous reaction zone.
A reaction from the lower wedge support could provide a long opportunity for a quick bounce, targeting the mid-range and upper wedge levels.
Key levels to watch
Support: $80–$81
Bounce targets: $86 → $90 → $92
Momentum will likely expand once the wedge eventually breaks.
➖➖➖➖➖
Follow Crypto Sat 🟨  Long
Long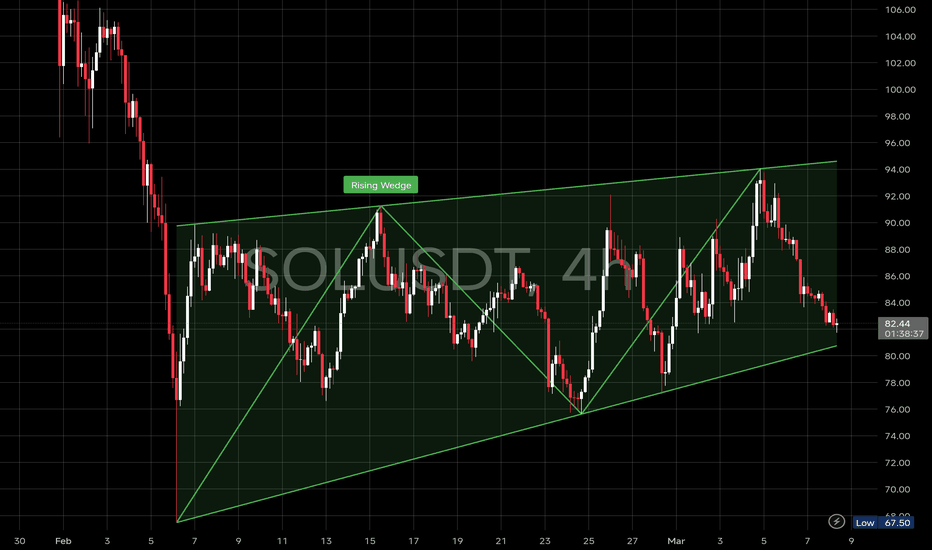
 Long
Long
Long 
BTC/USD Harmonic Setup – Potential Bearish ContinuationBitcoin is currently reacting from a key resistance zone after completing a harmonic structure near the 0.758 retracement level, suggesting weakening bullish momentum.
🔎 Technical Breakdown:
• The XA–AB–BC structure formed cleanly, with price rejecting near point C.
• A strong supply zone around 68,100–68,200 continues to cap upside attempts.
• The descending trendline remains intact, confirming short-term bearish pressure.
• Price is currently consolidating below resistance, indicating a possible continuation move toward the D completion zone.
📊 Key Levels to Watch:
• Resistance: 68,100 – 68,200
• Immediate Level: 67,850 area (current reaction zone)
• Potential Target (D): ~67,200 region
⚠️ If sellers maintain control below the resistance zone, the harmonic pattern suggests a measured move toward the 1.27–1.618 extension area, aligning with the projected D point.
💡 Traders should watch for rejection candles or lower-high formations near resistance before confirmation of the next leg down. Short 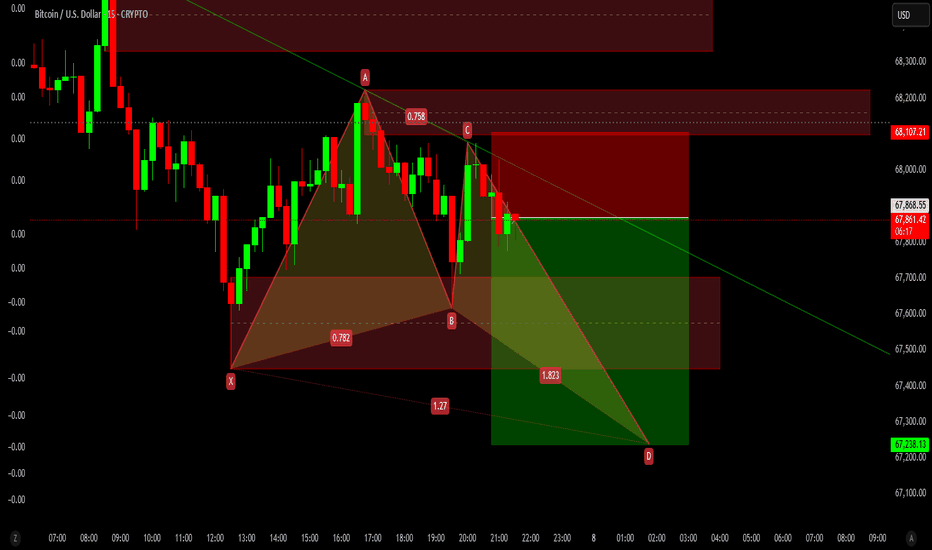
Long 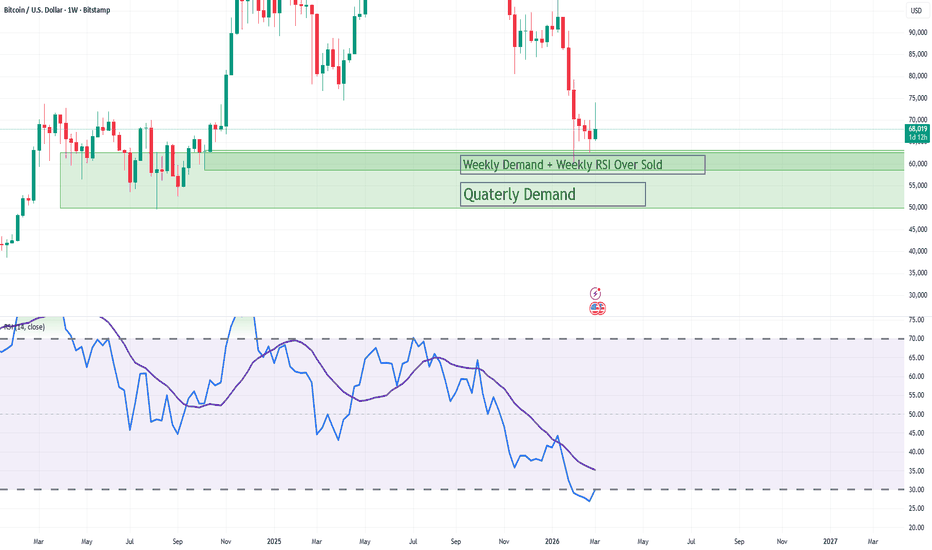
 Long
Long
BITCOIN AT INDESICION LEVELTo get the most out of technical analysis, follow these structural guidelines:
Timeframe Consistency: Ensure the timeframe (e.g., 5-minute, Daily, Weekly) matches your strategy. Day trading requires lower timeframes, while long-term investing requires higher ones.
Scale Settings: Use Logarithmic scales for long-term price action to view percentage changes accurately; use Linear scales for short-term, intraday movements.
Data Latency: Verify if your data feed is "Real-Time" or "Delayed" (usually by 15 minutes). Trading on delayed data can lead to significant execution errors.
Indicator Overload: Limit the number of technical indicators (RSI, MACD, Moving Averages) to avoid "analysis paralysis."
Chart Types: * Candlesticks: Best for viewing price action and sentiment.
Line Charts: Best for identifying long-term trends and closing prices.
Risk Disclosure Statement
Trading and investing involve significant risk. Please read the following carefully:
Loss of Capital: You may lose some or all of your initial investment. Never trade with money you cannot afford to lose ("risk capital").
Market Volatility: Financial markets are subject to rapid and unexpected price swings caused by economic news, geopolitical events, or shifts in market sentiment.
Past Performance: Past results are not indicative of future returns. A strategy that worked yesterday is not guaranteed to work tomorrow.
Leverage Risk: Using margin or leverage can magnify both profits and losses. Small price movements against your position can result in a total loss of funds.
Technical Failure: Trading relies on technology. Internet connectivity issues, platform outages, or data feed errors can prevent you from entering or exiting trades.
Bottom Line: Financial charts are tools for visualization, not crystal balls. All trading decisions are made at your own discretion and risk. Long 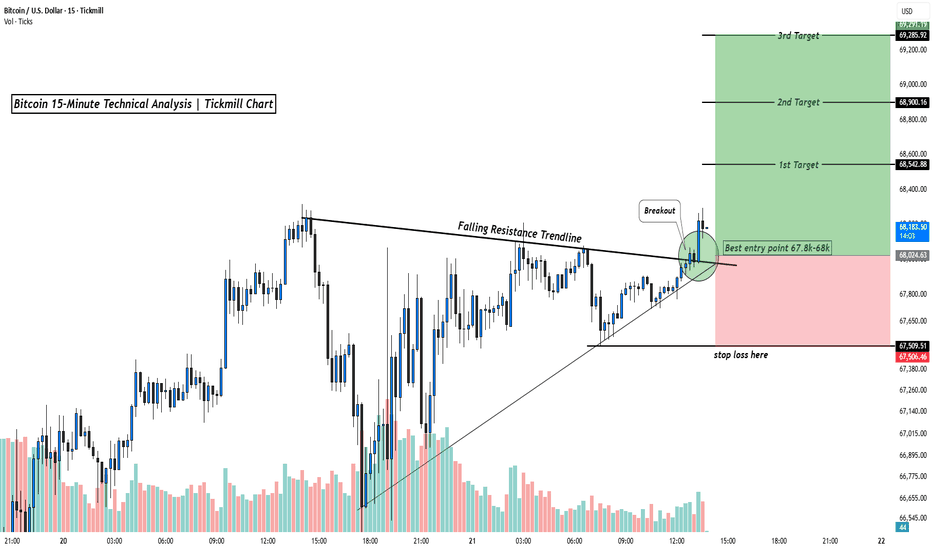
BTC Holding Above Demand – Breakout Could Push Price Toward 75KBitcoin is maintaining a bullish market structure after a strong Break of Structure (BOS) and impulsive rally toward the 73K region. Price is currently consolidating above the 72K demand zone, which is acting as short-term support and liquidity base.
Technically, this consolidation looks like bullish continuation accumulation. If BTC breaks and holds above 73.5K resistance, momentum could expand toward the 75K–76K liquidity area, where the next major resistance sits. On the downside, losing the 72K demand zone could trigger a pullback toward 70K psychological support, with 68K acting as major higher-timeframe support.
From a macro perspective, geopolitical tensions and the ongoing Middle East conflict are increasing volatility across global markets. War events often cause capital shifts and liquidity changes, which can impact crypto movements. Bitcoin initially tends to move like a risk asset during geopolitical shocks, sometimes dropping with equities before stabilizing or rebounding as market sentiment improves.
Recent market action shows BTC recovering above $70K and reaching around $73K despite the Iran conflict, indicating strong demand and resilience in the crypto market.
Overall, as long as BTC holds above the 72K structure support, the bullish trend remains intact, and the market could be preparing for the next expansion leg toward new highs if resistance breaks. 📈 Long 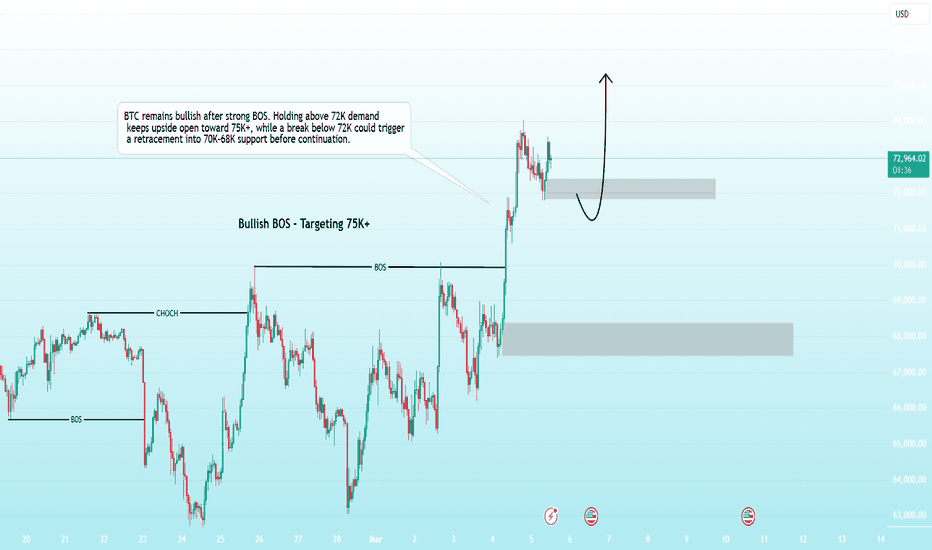
 Long
Long
Bitcoin Bybit chart analysis MARCH 5Hello
It's a Bitcoin Guide.
If you "follow"
You can receive real-time movement paths and comment notifications on major sections.
If my analysis was helpful,
Please click the booster button at the bottom.
This is a 30-minute Bitcoin chart.
There's a Nasdaq indicator release at 10:30 AM.
In the lower left corner, the purple finger connects the strategy to the $70,982.8 level, which was reached on March 4th.
*When the red finger moves, long position strategy is based on the purple finger touch before and after.
1. After confirming the first touch of the purple finger at the top,
switch to a long position at $72,577 at the red finger at the bottom.
/Stop-loss price if the green support line is broken.
2. Long position at $76,526: 1st target -> Good -> Great.
If the price immediately falls without touching the first section of the purple finger at the top, place a final long position at section 2.
Stop-loss price if the green support line is broken.
(The same stop-loss price applies to those holding a long position at $70,982.8 yesterday.)
After the green support line is broken,
the bottom section is open -> up to section 3.
A breakout of the pink resistance line at the top is considered a true rebound.
A strong breakout could mark the current price floor, so please keep this in mind.
Please use principled trading and stop-loss orders to ensure safe trading.
Thank you.
Long 
Long 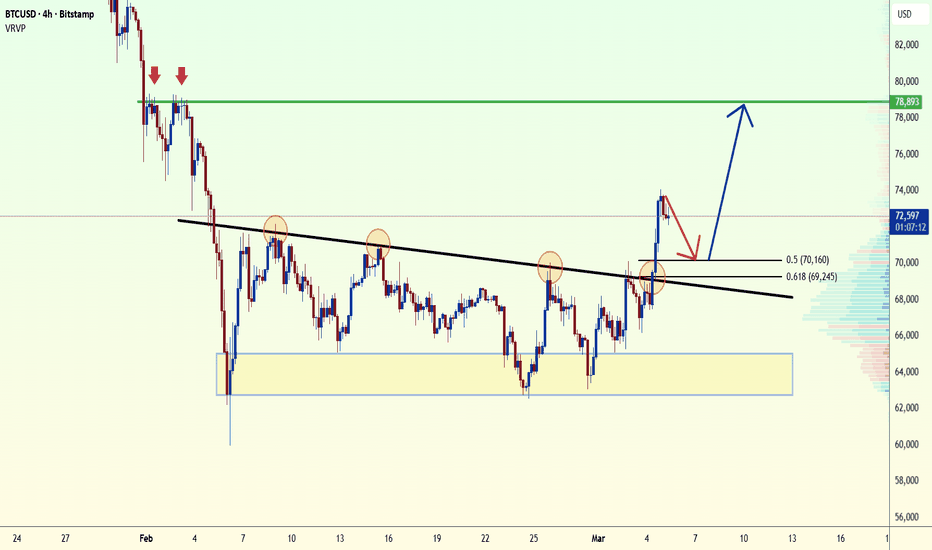
Short 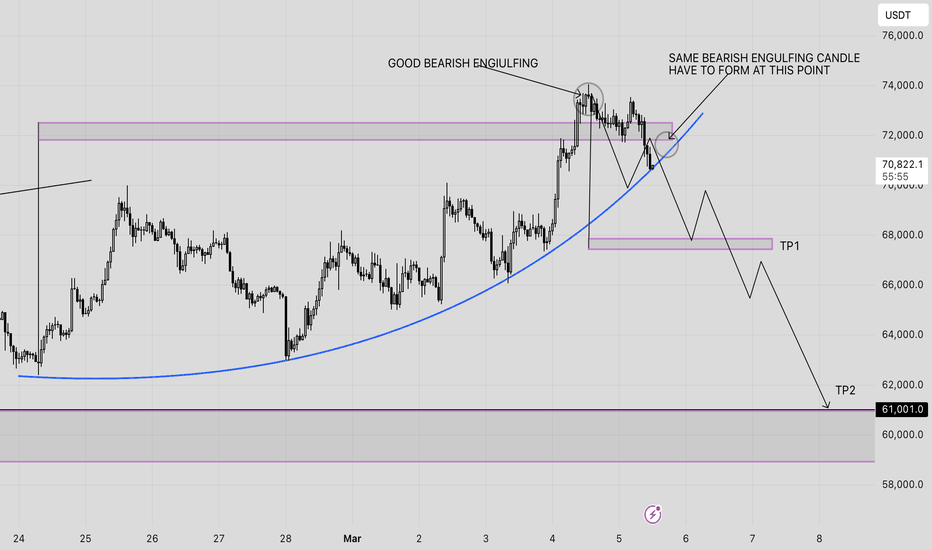
BITCOIN LOOKS DOWNWhile Bitcoin has shown a strong recovery over the last 48 hours—climbing from the low $60,000s to nearly $73,000—the broader technical context for the recent downward pressure (and potential upcoming volatility) is rooted in a specific mix of geopolitical "black swan" events and structural chart resistance.
Here is the technical breakdown of the recent bearish moves and the hurdles it currently faces.
1. Geopolitical Correlation & Risk-Off Sentiment
The primary driver for the dip into the $60,000–$62,500 zone in late February and early March 2026 was the U.S.-Iran conflict.
Decoupling from Gold: Historically viewed as "digital gold," Bitcoin failed to act as a safe haven during this crisis. Instead, it correlated heavily with S&P 500 and Tech equities, moving down as investors fled riskier assets.
Liquidity Shock: The uncertainty led to a "Phase One" liquidation shock, where leveraged long positions were forcibly closed, creating a cascade of selling.
2. Technical Chart Structures
Despite the current bounce, several technical indicators suggest Bitcoin is not "out of the woods" yet:
The Bear Flag: Analysts identify a large bear flag pattern on the daily chart dating back to the October 2025 all-time high ($109k). Until Bitcoin decisively holds above $72,000, this pattern remains technically active, with a "measured move" downside target of $42,000–$45,000.
Death Cross Concerns: Recently, the 50-day Moving Average crossed below the 200-day Moving Average. This "Death Cross" is a lagging indicator but often signals a shift in long-term sentiment from bullish to bearish.
Resistance at the 50-day EMA: The 50-day Exponential Moving Average ($74,409) is currently acting as a stiff overhead ceiling. BTC has struggled to turn this level back into support.
3. On-Chain & Derivatives Pressure
Supply at a Loss: Approximately 43% of Bitcoin’s supply is currently held at a loss. This creates "overhead supply," as investors who bought higher may look to sell as soon as the price reaches their break-even point, effectively capping rallies.
Negative Funding Rates: During the recent move down, funding rates turned deeply negative. While this eventually fueled a "short squeeze" (the current move up), it indicated that the majority of professional traders were heavily positioned for further declines.
Macro Headwinds: President Trump’s recent pursuit of new 15% tariffs has created general economic unease. As a global asset, Bitcoin is sensitive to the resulting strength of the US Dollar (DXY); a stronger dollar typically exerts downward pressure on BTC price. Short 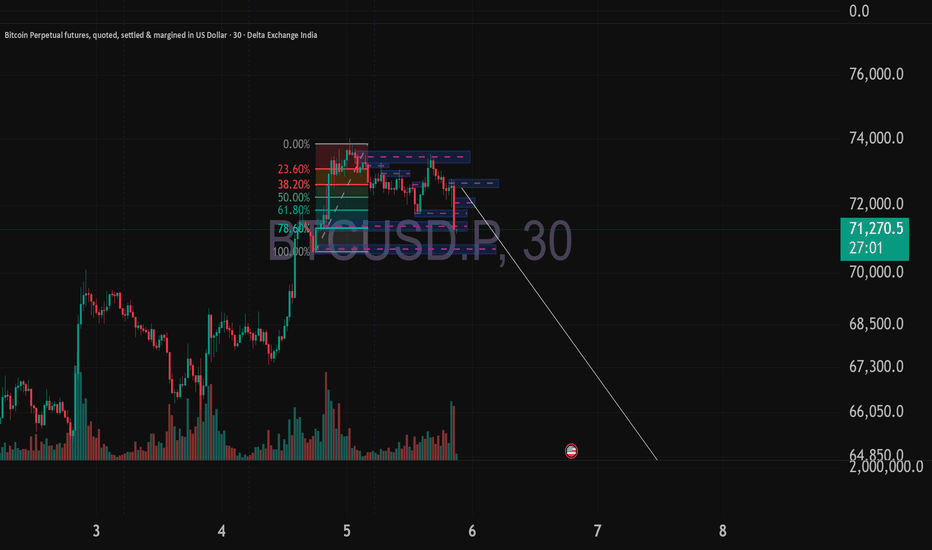
 Long
Long
Long 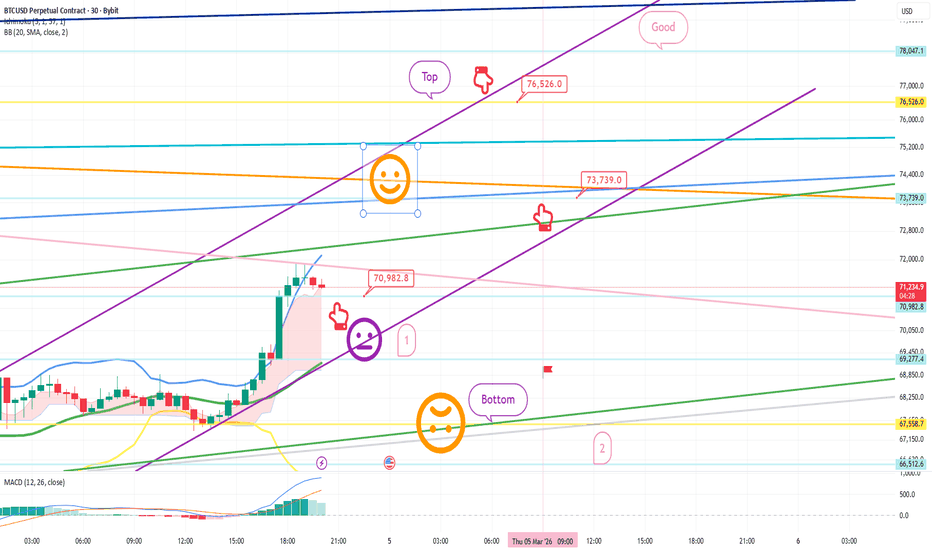
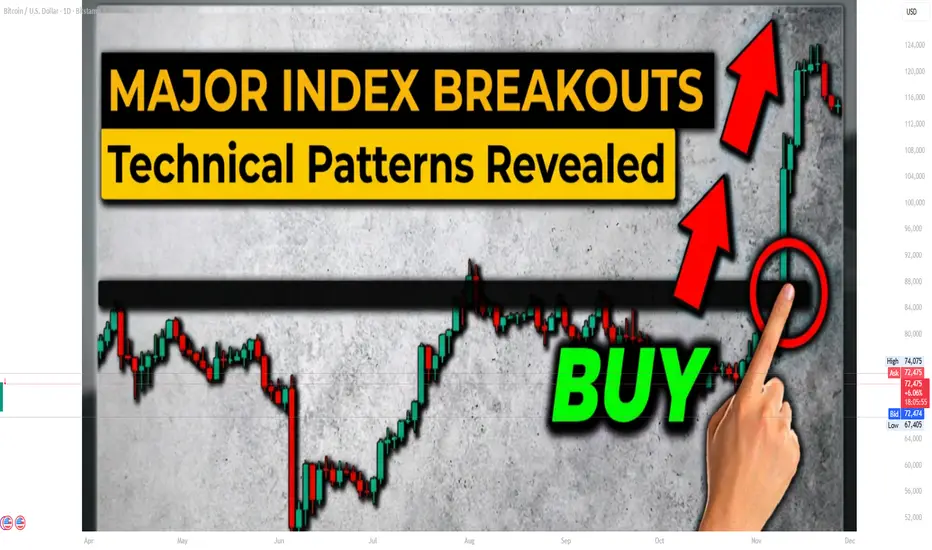
Major Index Breakout Technical Patterns Revealed📈Introduction
In financial markets, major index breakout patterns are among the most powerful signals used by traders and investors. A breakout occurs when the price of a major market index moves beyond a defined support or resistance level with strong momentum and increased trading volume. Such movements often signal the beginning of a new trend and attract both institutional and retail traders. Major indices like the S&P 500, Dow Jones Industrial Average, NASDAQ Composite, and India’s Nifty 50 frequently exhibit these breakout patterns, which can provide valuable trading opportunities.
Understanding breakout patterns requires knowledge of technical analysis, market psychology, and trading volume dynamics. When an index breaks through a critical level, it often indicates that the balance between buyers and sellers has shifted significantly.
What Is a Breakout in Technical Analysis?
A breakout occurs when the price moves above resistance or below support. Resistance is a level where selling pressure historically prevents the price from rising further, while support is a level where buying pressure prevents the price from falling.
When a breakout happens:
Bullish breakout: Price moves above resistance.
Bearish breakout: Price falls below support.
For example, if the Nifty 50 repeatedly struggles to move above a particular level and finally breaks above it with strong volume, traders interpret this as a bullish signal.
Breakouts are powerful because they indicate a shift in market sentiment. Traders who previously sold at resistance may begin buying once that level is broken.
Why Breakouts Matter in Major Indices
Major indices represent the overall health of the market. When indices break out of key levels, it can trigger large-scale capital flows from institutions such as mutual funds, hedge funds, and pension funds.
For example:
A breakout in the S&P 500 can influence global markets.
A breakout in the Nifty 50 can trigger momentum across Indian equities.
Because indices contain multiple stocks, their breakout patterns are considered more reliable than those of individual stocks.
Key Breakout Technical Patterns
Several chart patterns commonly lead to breakouts in major indices.
1. Ascending Triangle Breakout
The ascending triangle is a bullish continuation pattern.
Characteristics:
A horizontal resistance level
A series of higher lows
This pattern shows that buyers are gradually gaining strength while sellers defend a fixed level. Eventually, buying pressure overwhelms sellers, leading to a breakout.
In indices like the NASDAQ Composite, ascending triangles often appear during strong bull markets.
Once the breakout occurs, traders usually expect a sharp upward movement.
2. Descending Triangle Breakout
A descending triangle is generally a bearish pattern.
Features include:
A horizontal support level
Lower highs
This indicates increasing selling pressure. Eventually, the support breaks, and the index may decline sharply.
This pattern often appears during market corrections or bearish phases.
3. Symmetrical Triangle Breakout
The symmetrical triangle represents market indecision.
Characteristics:
Lower highs
Higher lows
Converging trendlines
This pattern can break in either direction. When the breakout occurs, the move is usually strong because volatility had been contracting.
Indices like the Dow Jones Industrial Average frequently show this pattern during consolidation phases.
4. Cup and Handle Breakout
The cup and handle is a classic bullish breakout pattern.
Structure:
A rounded bottom (cup)
A small consolidation (handle)
Breakout above resistance
This pattern reflects a gradual shift from selling pressure to strong buying demand.
When the breakout occurs, it often leads to long-term bullish trends.
5. Rectangle Breakout
A rectangle pattern forms when price moves sideways between support and resistance.
This represents a consolidation phase where buyers and sellers are balanced.
Eventually, the index breaks out of the range.
Break above resistance → bullish breakout
Break below support → bearish breakout
These patterns frequently appear before major market moves.
Role of Volume in Breakouts
Volume plays a critical role in confirming breakout patterns.
A valid breakout typically occurs with:
High trading volume
Strong price momentum
Wide price candles
If a breakout happens with low volume, it may result in a false breakout or “fakeout.”
Institutional traders watch volume carefully before entering trades.
False Breakouts and Market Traps
Not all breakouts are reliable. Sometimes markets create false breakouts to trap traders.
Common signs of false breakouts:
Price quickly returns inside the pattern.
Low trading volume.
Lack of follow-through momentum.
For example, an index might break resistance briefly but then fall back below the level.
Professional traders often wait for confirmation before entering trades.
Breakout Confirmation Techniques
Traders use several techniques to confirm breakouts.
1. Retest of Breakout Level
After breaking resistance, price may return to test the level.
If the level holds as support, it confirms the breakout.
2. Moving Average Support
Breakouts that occur above major moving averages such as:
50-day moving average
200-day moving average
are considered stronger signals.
3. Momentum Indicators
Indicators like:
RSI
MACD
Volume Oscillator
can help confirm breakout strength.
For example, if RSI rises above 60 during a breakout, it indicates strong bullish momentum.
Institutional Influence on Index Breakouts
Large financial institutions often drive index breakouts.
These players include:
Hedge funds
Investment banks
Pension funds
Algorithmic trading firms
Because they trade large volumes, their actions can push indices beyond major resistance levels.
Once the breakout occurs, momentum traders join the trend, further accelerating the move.
Psychological Factors Behind Breakouts
Market psychology plays a major role in breakout patterns.
When an index approaches resistance:
Some traders sell to take profits.
Others wait for confirmation.
When resistance finally breaks:
Short sellers cover positions.
Momentum traders buy aggressively.
This combination leads to explosive price movements.
Breakouts and Market Cycles
Breakouts often mark important phases in market cycles.
Typical sequence:
Accumulation phase – institutions quietly buy.
Consolidation phase – index moves sideways.
Breakout phase – strong upward momentum begins.
Trend expansion – market rallies significantly.
Understanding this cycle helps traders position themselves early.
Risk Management in Breakout Trading
Even strong breakout patterns carry risk.
Key risk management techniques include:
Using stop-loss orders
Waiting for confirmation candles
Avoiding trades during low volume
Traders often place stop-loss levels below the breakout point.
This helps limit losses if the breakout fails.
Conclusion
Major index breakout technical patterns provide valuable insights into market trends and momentum. By analyzing patterns such as ascending triangles, symmetrical triangles, rectangles, and cup-and-handle formations, traders can anticipate significant market movements.
Indices like the S&P 500, NASDAQ Composite, Dow Jones Industrial Average, and Nifty 50 often display these patterns before major rallies or corrections. However, successful breakout trading requires careful attention to volume, momentum indicators, and risk management.
By combining technical analysis with an understanding of market psychology and institutional behavior, traders can better identify genuine breakouts and avoid false signals. Ultimately, mastering breakout patterns can significantly enhance trading strategies and improve decision-making in dynamic financial markets. 📊 Education 
Short 
Long 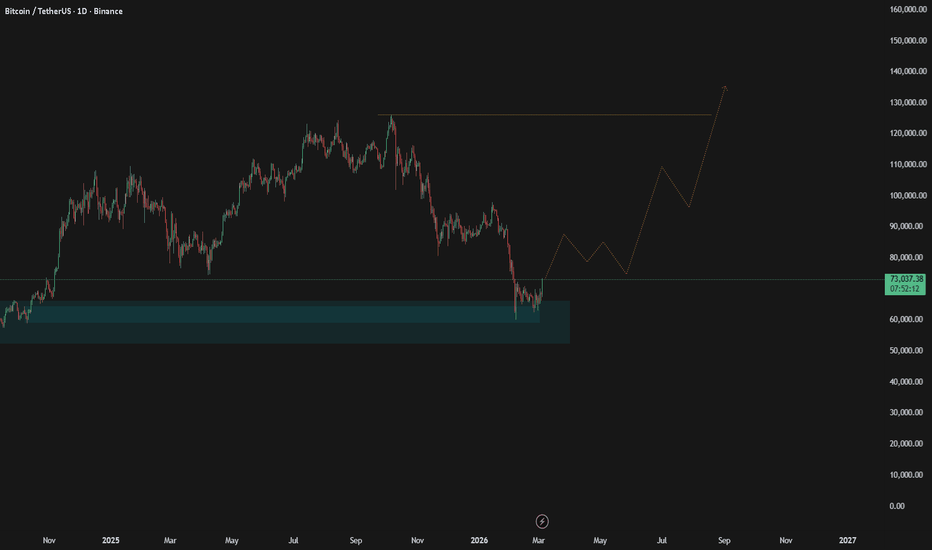
Long 
Long