 Long
Long
 Long
Long
Bitcoin Bybit chart analysis FEBURARY 27
Hello
It's a Bitcoin Guide.
If you "follow"
You can receive real-time movement paths and comment notifications on major sections.
If my analysis was helpful,
Please click the booster button at the bottom.
This is a Bitcoin 30-minute chart.
On the left, the pink finger connects the strategy to the long position entry point, $67,026.1, which was entered on the 26th.
*The long position strategy is established before and after the red finger touches the first section of the purple finger at the top.
(The Nasdaq is falling in real time, so please be sure to set a stop loss as this can be risky.)
1. After confirming the touch of the first section of the purple finger at the top, switch to a long position at $66,793.7 at the red finger. If the green support line is broken, set a stop loss. (The stop loss is the same for those holding a long position at $67,026.1.)
2. Long position initial target at $70,304.1 -> Top, then Good. If the strategy is successful, $68,896 is the target for re-entry into the long position.
Switch to a short position when the price reaches the top of the daily candlestick before tomorrow's formation (Bollinger Band daily chart resistance line).
If the price falls immediately without touching the first purple finger at the top,
then the final long position is waiting at the second section, $65,390.5.
If the light blue support line is broken, the stop loss is the target.
Below that, the open range is from the bottom to the previous low, $61,241.8, so
please refer to it.
Please use my analysis to this point for reference only.
I hope you operate safely, adhering to principled trading and a stop loss.
I'll see you on March 3rd, after the holiday on March 2nd.
Thank you for your hard work this week. Long 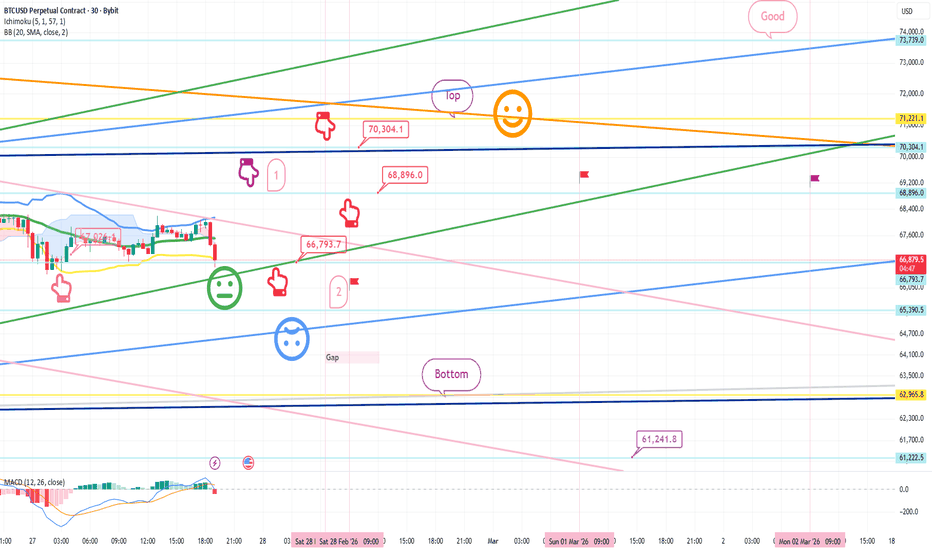
Weekly Analysis with buy/Sell scenarios in BTC👋👋👋 Friends, What's your view on BTC???
Bitcoin traded in a range-bound but corrective structure, with price facing repeated rejection near the $70,000–$72,000 resistance band and dipping toward the $62,000–$63,000 support zone, where buying interest emerged and prevented a deeper breakdown; the weekly close was relatively flat to slightly negative, reflecting profit booking after prior rallies, cautious institutional participation, and mixed ETF flow momentum, while macro uncertainty around US rate expectations and Israel and Iran war situation.
Structurally, BTC is forming a range within $62K–$72K, indicating short-term tussle between buyers and seller and no confirmed macro trend reversal yet, as the higher-timeframe structure remains intact above $60K.
Next Week Scenarios:
• Bullish case: Sustained acceptance above $72K can trigger short covering and momentum expansion toward $75K–$78K, especially if ETF inflows accelerate and macro sentiment improves.
• Bearish case: Failure to hold $62K–$63K may lead to a retest of the critical $60K liquidity zone, and a decisive break down below $60K could accelerate downside toward $55K–$58K.
Overall, BTC remains in a compression phase ahead of expansion, and traders should focus on breakout/breakdown confirmation rather than pre-empting direction, as ETF flows, US macro data, and broader risk sentiment will likely dictate next week’s move.
Note – if you liked this analysis, please boost the idea so that other can also get benefit of it.
Also follow me for notification for incoming ideas.
Also Feel free to comment if you have any input to share.
Disclaimer: This analysis is for educational purposes only and does not constitute investment advice. Please do your own research (DYOR) and check with your financial advisor before making any trading decisions.
Long 
Digital Dominates the Market and Old Methods Fall Behind1. The Rise of Digital Technology
The dominance of digital systems began with the expansion of the internet in the late 1990s and early 2000s. Today, technologies such as cloud computing, artificial intelligence (AI), blockchain, e-commerce, and big data analytics are transforming industries. Companies like Amazon and Google have demonstrated how digital infrastructure can scale globally and outperform traditional business models.
Digital platforms eliminate geographical barriers. A small business in India can sell products globally through online marketplaces. Earlier, physical stores required heavy investment in rent, staff, and inventory. Now, an online store can operate with minimal overhead costs while reaching millions of customers.
2. E-Commerce vs Traditional Retail
Traditional retail relied on physical presence. Customers visited stores, compared products manually, and purchased items during limited working hours. In contrast, e-commerce operates 24/7. Online platforms provide reviews, price comparisons, recommendations, and doorstep delivery.
Digital retail offers:
Wider product selection
Lower operational costs
Personalized recommendations
Fast delivery systems
Old retail methods struggle because they cannot match the convenience and pricing power of online giants. Many physical stores have either adapted by creating digital channels or closed entirely.
3. Digital Marketing vs Traditional Advertising
In the past, businesses relied on newspapers, television, and radio for advertising. These methods were expensive and lacked accurate measurement. Companies could not precisely track customer behavior.
Now, digital marketing dominates. Platforms such as Meta Platforms (Facebook and Instagram) and YouTube allow targeted advertising. Businesses can analyze customer interests, demographics, and behavior in real time.
Digital marketing advantages:
Data-driven targeting
Lower cost per customer
Real-time performance tracking
Global audience reach
Traditional advertising methods are declining because they cannot provide detailed analytics or targeted engagement.
4. Digital Banking vs Traditional Banking
4
Banking has undergone a massive digital transformation. Earlier, customers visited bank branches for transactions, withdrawals, and payments. Long queues and paperwork were common.
Today, digital banking apps allow:
Instant money transfers
Online bill payments
Digital loans
Investment management
In India, digital payment systems have grown rapidly due to UPI (Unified Payments Interface). Customers prefer quick mobile transactions over visiting bank branches. Traditional banking methods are becoming less relevant as fintech companies offer faster and more user-friendly solutions.
5. Automation and Artificial Intelligence
Automation is another reason digital dominates. Machines and AI systems now perform tasks that previously required human labor. In manufacturing, robots handle repetitive processes with greater accuracy and speed.
AI is used in:
Customer service chatbots
Fraud detection in banking
Predictive stock market analysis
Healthcare diagnostics
Traditional manual processes are slower, more expensive, and prone to errors. Digital automation increases productivity and reduces operational costs.
6. Data as the New Oil
Data has become the most valuable resource in the digital economy. Companies collect customer information to improve products and services. Traditional businesses relied on intuition and experience. Digital companies rely on analytics.
For example, Netflix uses viewing data to recommend content and even produce original shows based on audience preferences. Traditional television networks lacked such detailed viewer insights.
The ability to collect, process, and interpret data gives digital companies a competitive advantage that traditional firms cannot easily replicate.
7. Work Culture Transformation
Digital dominance is also visible in workplace culture. Remote work, virtual meetings, and online collaboration tools have replaced many physical office processes.
Platforms like Zoom Video Communications and Microsoft Teams allow employees to work from anywhere. Traditional office models are gradually changing as companies adopt hybrid systems.
This transformation reduces travel costs, increases flexibility, and expands talent pools globally.
8. Speed and Convenience
The main reason digital methods dominate is speed. Consumers expect instant services—same-day delivery, immediate payments, real-time updates. Traditional systems cannot compete with this pace.
Examples:
Online stock trading vs physical brokerage
E-books vs printed books
Online ticket booking vs standing in queues
Digital systems minimize time and maximize efficiency.
9. Global Reach and Scalability
Traditional businesses grow slowly because expansion requires physical infrastructure. Digital companies scale rapidly. A mobile app can reach millions of users within months.
Startups today prioritize digital presence before physical expansion. The cost structure favors innovation and rapid scaling.
10. Challenges of Digital Dominance
While digital dominance offers advantages, it also creates challenges:
Cybersecurity risks
Data privacy concerns
Job displacement due to automation
Digital divide between urban and rural areas
Traditional methods, although slower, provided personal interaction and employment opportunities. The shift to digital requires skill upgrades and technological literacy.
11. The Survival of Traditional Methods
Old methods are not completely disappearing. Instead, they are evolving. Many businesses adopt a hybrid model—combining digital tools with physical presence.
For example:
Retail stores offering online ordering
Banks integrating digital apps with physical branches
Schools using online platforms along with classroom teaching
Adaptation is key. Organizations that resist digital transformation risk becoming irrelevant.
12. Future Outlook
The future clearly belongs to digital innovation. Emerging technologies such as blockchain, virtual reality (VR), artificial intelligence, and the Internet of Things (IoT) will further strengthen digital dominance.
Consumers are becoming more tech-savvy, and younger generations prefer digital-first experiences. Governments also promote digital ecosystems to enhance economic growth and transparency.
Conclusion
Digital systems now dominate markets across industries because they provide efficiency, speed, scalability, personalization, and global reach. Traditional methods—while once effective—cannot compete with the technological advantages of digital platforms. However, the transformation is not about complete replacement but adaptation.
Businesses that embrace digital innovation survive and thrive. Those that rely solely on old methods fall behind. The digital era is not just a trend; it is the foundation of modern economic and social systems. Education 
 Long
Long
 Long
Long
$GRT Crashed 99% | 12,764%+ Upside | 10 Reasons Why $1+ Is CominGETTEX:GRT : Crypto's Invisible Infrastructure With Zero Alternatives | Crashed 99% | 12,764%+ Upside | 10 Reasons Why $1+ Is Coming
#GRT Is Trading Inside A Multi Year Descending Channel On The Weekly Chart Since 2021 ATH Near $2.88. After A 99.22% Correction, Price Has Compressed Into A HTF Demand Zone Between $0.022-$0.016. Critical Accumulation Zone With Low Risk-Reward Ratio.
Market Structure Shows Smart Money Absorption At Macro Channel Support With Sell Side Liquidity Sweeps Fully Absorbed. Volatility Compression = Expansion Imminent.
What Is GRT?
The "Google Of Blockchains." ONLY Decentralized Data Indexing Protocol Across 70+ Chains. Every Major DeFi Protocol Depends On It. Uniswap, Aave, Synthetix, ENS, Decentraland. Without The Graph, Most DeFi Front Ends Break. Invisible But Mission Critical Infrastructure.
Current Structure:
✅ Descending Channel From 2021 ATH Still Intact
✅ Wave 5 Corrective Structure Complete In Accumulation Zone
✅ First Higher Low Formation Since Downtrend Began
✅ Sell Side Liquidity Swept + Full Demand Absorption
✅ Extreme Volatility Contraction, Expansion Imminent
✅ Fractal Mirrors Previous 820% Rally Setup
10 Reasons Why $0.50-$2.00+ Is Possible:
➤ Zero Alternatives: Only Decentralized Indexing At Scale Across 70+ Chains. Network Effects Impossible To Replicate
➤ 65B Daily Queries: More Than Google's 8.5B. Real Adoption, Not Speculation
➤ 89% Staked: Tightest Float In Crypto. Only 11% Tradeable. 97.8% Circulating = No VC Dumps
➤ DTCC Building On It: $2.15 Quadrillion Annual Settlement Institution Using Graph Tech
➤ AI Agents Adopting: 37% Of New API Users Are AI Agents. Data Backbone For On Chain AI
➤ Coinbase, Multicoin, DCG, Framework, ParaFi All Backed
➤ Horizon Upgrade Live: Multi Service Data Platform. More Services = More Fees = More Demand
➤ Deflationary Path: Fee Burns At Scale Will Exceed 3% Inflation
➤ Chainlink CCIP: Cross Chain To Arbitrum, Base, Avalanche. Solana 2026
➤ $285M Mcap: Memecoins With Zero Utility Trade Higher. Most Absurd Valuation Disconnect In Crypto
2026 Roadmap Catalysts:
➔ Q1: Horizon Mainnet + Token API (10 Chains)
➔ Q2: x402 AI Gateway + Tycho DeFi Beta
➔ Q3: Substreams Mainnet + Liquid Staking
➔ Q4: Amp Enterprise SQL Platform
CryptoPatel Targets: $0.116 / $0.321 / $1.045 / $2.85
Projected ROI: 1,184% To 12,764% From Accumulation Zone.
Invalidation: Weekly Close Below $0.016 (Structure Failure)
This Is A HTF Patience Setup With Asymmetric Risk Reward. GRT Is Not Just A Token, It Is Crypto's Infrastructure Layer Processing 65B Daily Queries With Zero Competition.
Pure TA & FA Only. Not Financial Advice. ALWAYS DYOR.  Long
Long
 Short
Short
Bitcoin 2H Rejection from Supply – Pullback Before ContinuationOn the 2-hour timeframe, Bitcoin (BTC/USD) has reacted sharply from a marked supply zone near the 69,500–70,000 region. Price tapped into higher-timeframe supply and immediately printed a strong rejection, suggesting sellers are defending this area aggressively.
Structurally, the recent move shows a strong impulsive rally from the 62,000–63,000 demand zone, followed by a sharp upside spike that appears to have taken liquidity above prior highs. However, the rejection wick at supply indicates a potential short-term distribution phase rather than immediate continuation.
Currently, price is hovering around 68,000. If BTC fails to reclaim and hold above the 69,000 level, a corrective move toward the 66,500–67,000 imbalance area becomes likely. A deeper retracement could revisit the 64,000–65,000 region, where prior structure (BOS level) and demand sit.
On the bullish side, if buyers absorb selling pressure and price consolidates above 68,000, a second attempt into 70,000 is possible. A clean 2H close above supply would invalidate the short-term bearish pullback scenario and open upside liquidity toward the 71,000–72,000 region.
Overall, the expected move in the short term favors a pullback from supply before any sustainable continuation higher. The reaction at 69.5K–70K is key — rejection confirms retracement, acceptance confirms breakout. Short 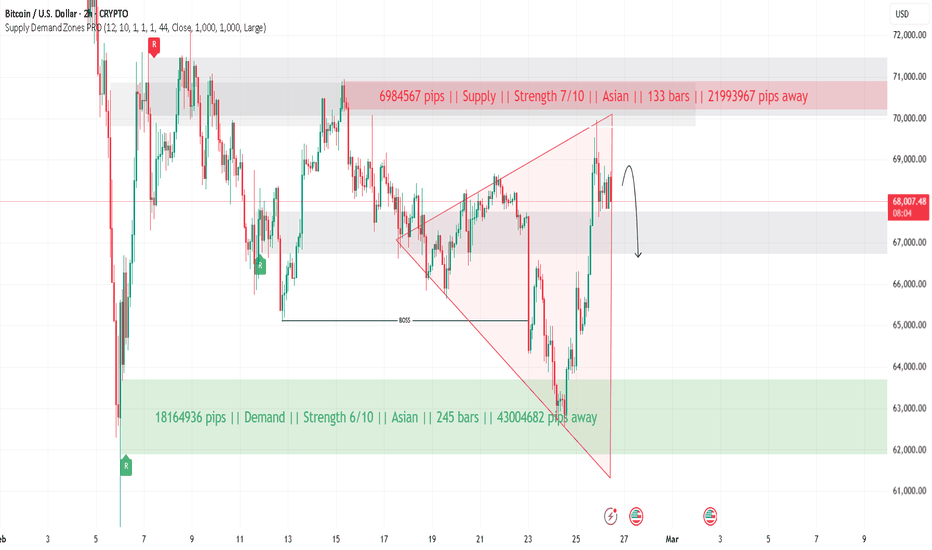
Long 
Long 
Education

Long 


