Bitcoin is in a retracement after the recent selloff, Bitcoin continues to retrace after the recent selloff, while the higher-timeframe trend remains bearish.
The daily structure suggests there is room for this recovery to extend toward the 68k region before sellers are likely to regain control. At this stage, the move appears corrective rather than the start of a new uptrend.
If Bitcoin reaches the 68k zone and fails to build acceptance above it, the broader downtrend could resume, with 58k becoming the next major downside objective.
Outlook
• Near-term bias: Retracement toward 68k.
• Broader trend: Still bearish.
• Downside objective on rejection: 58k.
For now, the market is recovering, but the larger trend has yet to show evidence of a meaningful reversal.
Crypto market
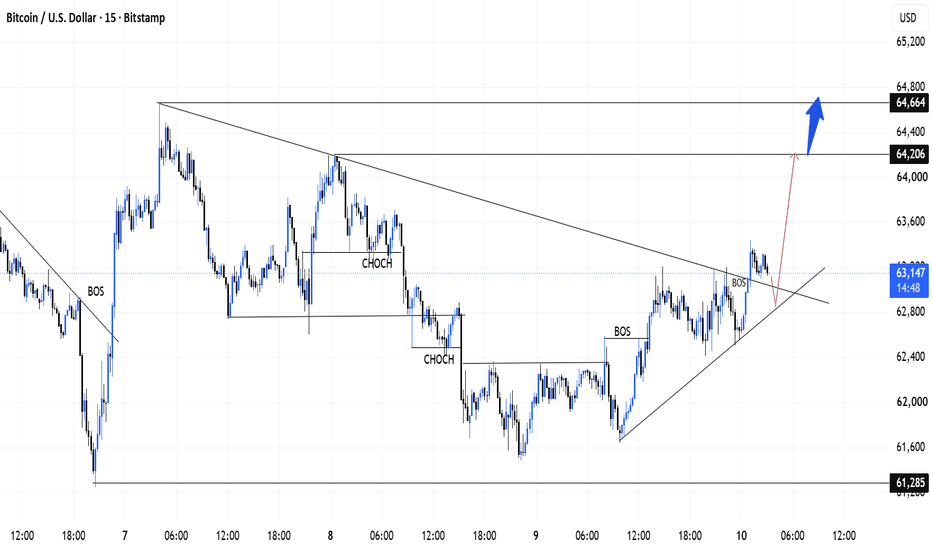
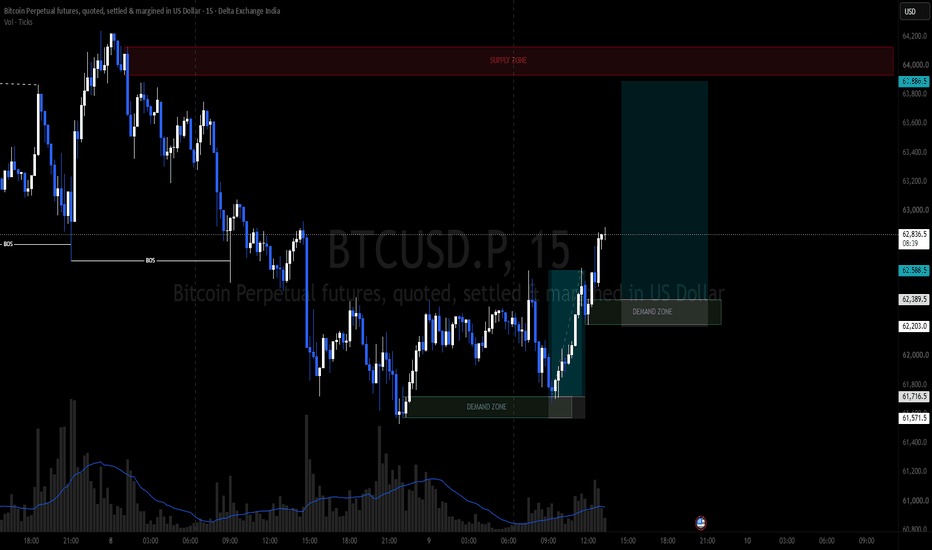
#BTCUSD M15 Bullish Structural Shift#BTCUSD M15 Bullish Structural Shift 🚀
Bitcoin is printing a classic textbook reversal pattern on the lower timeframes. After a prolonged corrective phase, the price action has shifted into a bullish order flow on the 15-minute chart. We have witnessed a clean Break of Structure (BOS) followed by a successful breakout above the descending counter-trendline. 📈
The market structure suggests that the bulls are reclaiming control, and we are now monitoring a potential discount retest for a high-consequence long entry.
🔹 Entry / Buy Zone: 62,800 – 63,100 (Trendline Retest & Demand Alignment)
🔴 Invalidation / SL: Daily candle close below 62,500
🎯 Immediate Target: 64,200
🎯 Ultimate Target: 64,660 – 64,875 (Buy-Side Liquidity Pool)
The objective is to wait for the price to mitigate the broken structural level and show clean lower timeframe rejection before executing the long bias. No FOMO, let the market deliver the setup to our zone. 🔍
Trade smart and manage your exposure effectively! 💼🔥
BTCUSDT Rejected at Resistance – Pullback Toward Demand?Analysis
BTCUSDT is approaching a well-defined resistance zone around 63,450–63,600, where sellers have previously stepped in. Price is testing this supply area after a strong intraday recovery, making this a key decision point for short-term direction.
A rejection from resistance could trigger a bearish pullback toward the 61,800–62,000 demand zone, where buyers may look to regain control. The projected move aligns with the recent market structure and suggests a healthy retracement before any potential continuation.
If bulls manage to secure a strong breakout and close above the resistance zone, the bearish outlook would weaken and could open the door for further upside. Until then, the resistance area remains the key level to watch for confirmation.
Key Levels
Resistance: 63,450–63,600
Demand: 61,800–62,000
This analysis is for educational purposes only and is not financial advice. Always wait for confirmation and manage your risk before entering any trade.
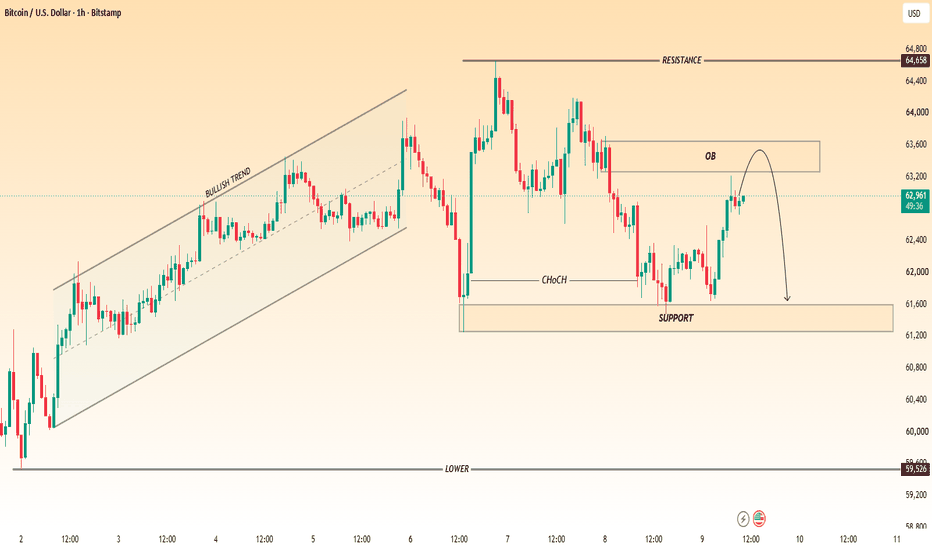
BTC/USD 1H Market Analysis – Bearish Order Block Setup📊 BTC/USD 1H Market Analysis – Bearish Order Block Setup 🐻📉
🌍 Market Overview
Bitcoin is currently trading in a short-term corrective phase after confirming a Change of Character (ChoCH), indicating that the market structure has shifted from bullish to bearish. The previous uptrend has weakened, and price is now moving towards a key Order Block (OB), which may act as a strong resistance zone.
At present, buyers are trying to push the price higher, but unless BTC breaks and closes above this resistance with strong momentum, sellers are likely to remain in control. The highlighted Order Block is an important institutional supply zone where fresh selling pressure may enter the market.
📈 Market Structure
🟢 Previous Bullish Trend
Price respected the ascending trend channel.
Higher highs and higher lows confirmed strong bullish momentum.
Buyers remained in control until the market structure was broken.
🔄 Change of Character (ChoCH)
Price broke below the previous bullish structure.
This confirms a possible trend reversal.
It indicates that sellers have started gaining market control.
🧱 Order Block (Supply Zone)
📍 Resistance Zone: 63,200 – 63,600
Bitcoin is currently retracing into this bearish Order Block.
This zone could attract institutional sellers and become the starting point of the next bearish move. A clear rejection from this area would strengthen the bearish outlook.
🐻 Bearish Scenario
If BTC fails to break above the Order Block and forms bearish confirmation (such as a bearish engulfing candle, rejection wick, or lower high), the market may continue its downward move.
🎯 Bearish Targets
🎯 Target 1: 62,400
🎯 Target 2: 61,900
🎯 Target 3: 61,600
🎯 Final Target: 61,300 (Major Support Zone)
🟢 Bullish Scenario
If buyers successfully break and close above the Order Block with strong volume, the bearish setup will lose strength.
Potential bullish targets:
🚀 64,000
🚀 64,400
🚀 64,650 (Major Resistance)
A sustained move above these levels would signal renewed bullish momentum.
📊 Key Price Levels
🔴 Major Resistance: 64,650
🟠 Order Block: 63,200 – 63,600
🟡 Current Price: Around 62,850
🟢 Major Support: 61,300 – 61,600
🔵 Long-Term Support: 59,526
💼 Trading Plan
✅ Sell Setup
Wait for bearish confirmation inside the Order Block.
Enter only after a clear rejection.
Stop Loss: Above 64,650.
Take Profit: 62,400 → 61,900 → 61,600 → 61,300.
✅ Buy Setup
Consider long positions only after a confirmed breakout and close above the Order Block.
Avoid buying before confirmation, as it may result in a false breakout.
⚠️ Risk Management
📌 Wait for proper confirmation before entering any trade.
📌 Risk only 1–2% of your capital per trade.
📌 Avoid chasing the market.
📌 Always follow your trading plan and use proper risk management.
📌 Conclusion
Bitcoin's short-term market structure has turned bearish after confirming a Change of Character (ChoCH). The current pullback into the Order Block is a critical area to watch. If sellers defend this zone, BTC could continue its decline towards the 61,600–61,300 support area. A strong breakout above the Order Block would invalidate the bearish setup and increase the chances of further upside.
⚠️ Disclaimer: This analysis is for educational purposes only and should not be considered financial advice. Always do your own research and manage your risk carefully. 📉💼
BITCOIN'S $62,000 BATTLE: BTC Crashes to $50K... or Ignites BTCUSD Weekly Technical Report | Shift Theta Research
Markets rarely ring a bell at the top or bottom—but they always leave footprints. Bitcoin is now standing on one of the most important technical footprints of the entire 2025-2026 cycle.
________________________________________
Executive Summary
Bitcoin has entered a critical decision zone after suffering a sharp correction from its all-time highs near $123,000. The weekly chart reveals that price has now returned to the intersection of multiple high-probability support levels including:
• Major Fibonacci retracement cluster
• Long-term ascending Gann fan support
• Weekly horizontal demand zone
• Psychological support around $62,000
The market is now at an inflection point where buyers and sellers are preparing for the next directional move.
Our view: The long-term bull market structure remains technically alive—but only if Bitcoin successfully defends the current support region.
________________________________________
Market Structure: Healthy Correction or Beginning of a Bear Market?
Bitcoin remains inside a larger secular uptrend despite the recent selloff.
After rallying from below $20,000 to above $120,000, the current decline appears more like a structural correction than a complete trend reversal.
The correction has erased weak speculative positions while bringing price back into institutional accumulation territory.
However, failure to hold current support would significantly weaken the bullish narrative.
________________________________________
Trend Analysis
Long-Term Trend
✅ Bullish
Medium-Term Trend
Neutral to Bearish
Short-Term Momentum
Bearish
The weekly candles continue to print lower highs and lower lows, indicating that short-term sellers remain in control.
Nevertheless, the larger trend has not yet broken.
________________________________________
Moving Average Analysis
20-Week EMA
68,588
Bitcoin is currently trading below the 20-week EMA, showing that short-term momentum has weakened.
Historically, BTC often experiences deeper corrections once this moving average is lost.
________________________________________
50-Week EMA
80,048
The 50-week EMA remains well above current prices.
This level now represents the first major resistance where institutional selling could emerge if Bitcoin attempts a recovery.
________________________________________
Support Analysis
Immediate Support
$61,500 - $62,500
This is currently the most important zone on the chart.
Several technical factors converge here:
• Previous breakout level
• Weekly horizontal support
• Gann Fan support
• Fibonacci confluence
A successful defense could trigger aggressive buying.
________________________________________
Secondary Support
$55,000-$57,000
If current support fails, this becomes the next institutional demand area.
________________________________________
Final Bull Market Support
$49,000-$51,000
Loss of this zone would invalidate much of the current bullish structure.
________________________________________
Resistance Analysis
First Resistance
$68,500-$70,000
This includes the 20-week EMA and recent supply.
Expect heavy selling pressure.
________________________________________
Second Resistance
$80,000
The 50-week EMA.
Breaking above this level would significantly improve market sentiment.
________________________________________
Major Resistance
$92,000-$95,000
Former breakdown region.
This area is likely to attract profit booking.
________________________________________
Gann Fan Analysis
One of the most interesting observations on the chart is Bitcoin's interaction with the long-term Gann Fan.
Price has retraced directly into an important ascending support angle that has historically acted as a launchpad during previous bull phases.
As long as BTC respects this angle, the broader trend remains constructive.
A decisive weekly close below it would increase the probability of a deeper correction.
________________________________________
Fibonacci Analysis
Bitcoin is currently trading around the 0.50 retracement zone, one of the most closely watched Fibonacci levels.
Historically, this level often separates:
• Healthy bull-market pullbacks
• Full trend reversals
A sustained move above the 0.382 retracement would indicate buyers are regaining control.
Failure here would expose the deeper 0.618 retracement, often the final line of defense for long-term bulls.
________________________________________
Momentum Indicators
RSI
Weekly RSI has cooled considerably from overbought conditions.
While momentum has weakened, RSI is approaching an area where long-term buyers historically begin accumulating.
No confirmed bullish divergence has formed yet.
________________________________________
MACD
MACD remains below its signal line, indicating bearish momentum still dominates.
However, histogram contraction suggests selling pressure is beginning to slow.
A bullish crossover would provide early confirmation of trend reversal.
________________________________________
Bullish Scenario (Probability: Moderate)
If Bitcoin successfully defends $62,000, the market could stage a relief rally toward:
• $68,500
• $80,000
• $92,000
A weekly close above $80,000 would likely attract fresh institutional buying and restore the long-term bullish trend.
________________________________________
Bearish Scenario (Probability: Moderate to High if $62K Breaks)
Failure to hold $62,000 could accelerate selling toward:
• $57,000
• $50,000
A breakdown below $50,000 would mark a significant deterioration in the long-term technical outlook and could delay the next major bull cycle.
________________________________________
Institutional Perspective
Professional money managers often wait for corrections into major support rather than chasing rallies.
Current price action suggests Bitcoin is entering a zone where long-term investors will closely monitor buyer participation.
The next two to four weekly candles may determine whether this correction becomes an accumulation opportunity—or the start of a broader distribution phase.
________________________________________
Key Levels to Watch
Level Significance
$62,000 Critical weekly support
$68,588 20-Week EMA
$80,048 50-Week EMA
$92,000 Major resistance
$50,000 Last major bull-market support
________________________________________
Shift Theta Research Conclusion
Bitcoin has arrived at one of the most consequential technical zones of the current market cycle. The convergence of Fibonacci retracement, Gann fan support, and historical demand around $62,000 makes this a high-stakes battleground between bulls and bears. While the long-term structure remains intact, the market requires a decisive weekly defense of this level to preserve the broader bullish outlook.
A sustained rebound above $68,500 would strengthen the case for renewed upside toward $80,000 and beyond. Conversely, a confirmed weekly close below $62,000 could trigger a deeper correction toward the $55,000-$50,000 region before meaningful buying interest re-emerges.
For investors and traders alike, patience is likely to be rewarded. Rather than reacting to short-term volatility, the next few weekly candles should provide the confirmation needed to distinguish between a healthy bull-market retracement and the early stages of a more prolonged downturn.
"The market has reached a point where conviction—not emotion—will determine who captures the next major move."
________________________________________
Disclaimer: This report is intended solely for educational and informational purposes and should not be construed as investment advice or a solicitation to buy or sell any financial instrument. Cryptocurrency investments are subject to high market risk. Shift Theta is not responsible for any profit, loss, or trading decisions made based on this report. Always conduct your own research and consult a qualified financial advisor before investing.
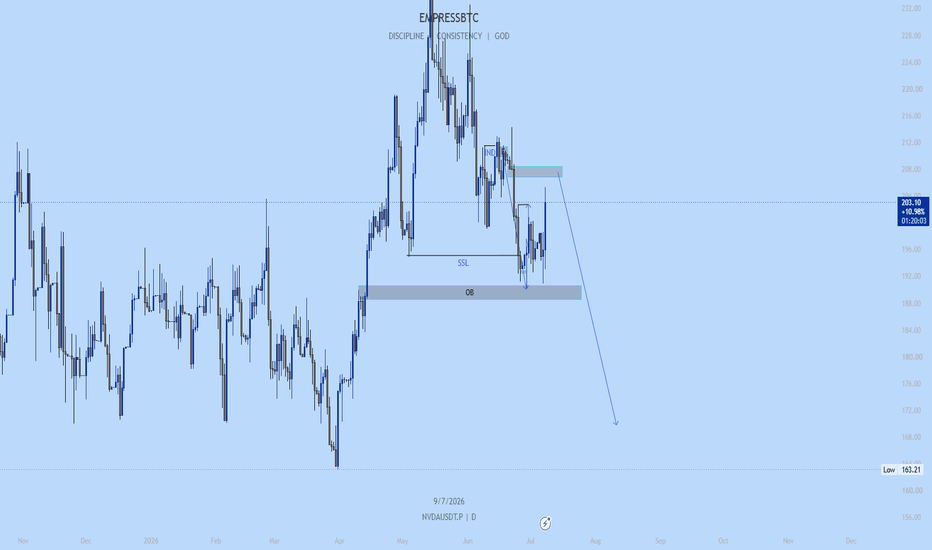
NVDA Daily: Don't Mistake This Bounce for the End of the SelloffJust like I explained in my previous NVDA analysis, I **don't believe the selloff is over.
The recent bounce has done exactly what I was watching for—it respected the bullish Order Block (OB) and reacted from it. But a reaction doesn't automatically signal a trend reversal.
To me, this looks more like price filling resting orders before deciding on its next move.
As long as the broader bearish structure remains intact, I'm treating this rally as a retracement rather than the start of a new uptrend.
My focus is on the bearish Order Block around $208, where I'm expecting sellers to step back into the market. If price rejects that area with confirmation, I'll be looking for a continuation lower, with the $180 OB remaining a key downside objective.
What I'm Watching
* Price has respected the bullish OB and swept sell-side liquidity.
* The current rally appears corrective within the larger bearish structure.
* The $208 bearish Order Block is the area I'm watching for potential rejection.
* A rejection there could open the door for another leg toward the $180 demand/OB.
How I'm Trading It. NFA!! Just From Personal Experience
Fast executions matter if you are looking for a clean setup and one thing, I've found useful is being able to act on these setups without switching between different platforms if not it can be confusing and tiring. At most, miss trade.
Since rNVDA tracks the real market 1:1, I can execute the same analysis directly from my existing crypto trading account instead of waiting to fund or log into a separate brokerage and miss again. When momentum is moving quickly, reducing that extra friction can make a difference.
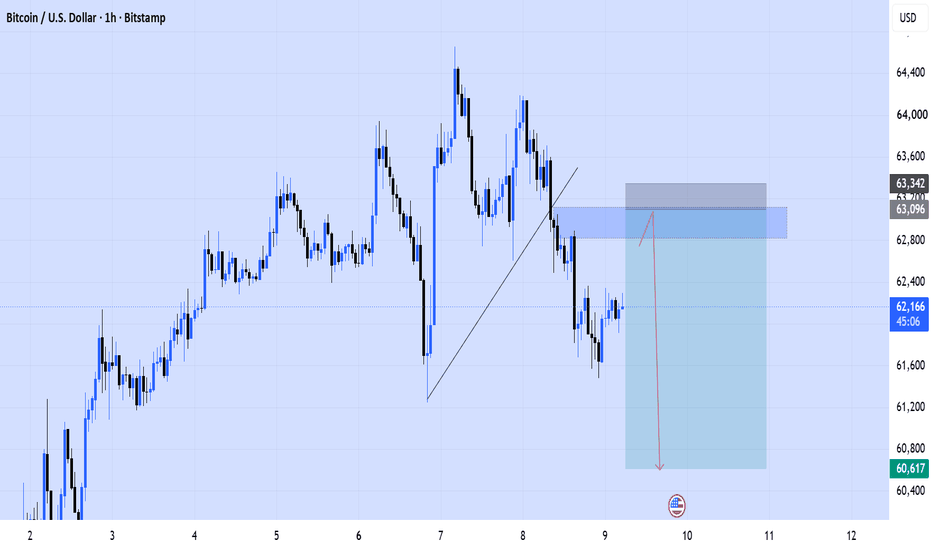
#BTCUSD Technical Analysis Update#BTCUSD Technical Analysis Update 📉
Bitcoin has broken below its internal ascending trendline, signaling a potential shift in momentum on the hourly timeframe. Following a sweep of internal liquidity, price action is pointing toward a bearish correction as it respects the newly formed supply structure. 🐻
We are monitoring a key premium area for a potential short setup on a valid retest:
🔹 Entry Zone: 62,800 – 63,100 (Supply / Breaker Block Zone)
🔴 Invalidation / SL: Closes above 63,350
🎯 Target Area: 60,600 (Sell-Side Liquidity Pool)
The plan is to observe lower timeframe distribution or rejection within the marked supply zone before anticipating the next leg down. Let the price action confirm the setup. 🔍
Trade with discipline and manage your risk accordingly. 💼🚀
High Win Rate Doesn't Mean High ProfitOne of the biggest misconceptions in trading is believing that a high win rate automatically leads to consistent profitability.
It doesn't.
Many traders proudly advertise an 80% or even 90% win rate; but very few talk about how much they lose when they're wrong. A single oversized loss can erase the profits from several winning trades.
Trading isn't about winning the most trades—it's about making more than you lose over time.
Imagine two traders.
Trader A
• Wins 90% of trades.
• Makes $100 on each winning trade.
• Loses $1,200 on one losing trade.
After ten trades:
9 Wins = +$900
1 Loss = -$1,200
Net Result: -$300
Now look at another approach.
Trader B
• Wins only 45% of trades.
• Risks $100 to make $300 on each winning trade.
• Accepts small, controlled losses.
After ten trades:
4 Wins = +$1,200
6 Losses = -$600
Net Result: +$600
Despite winning less than half of the trades; Trader B finishes with a better overall result.
Why?
Because profitability depends on the relationship between your average winner and your average loser—not simply how often you win.
Successful traders focus on:
• Maintaining a favorable Risk-to-Reward ratio.
• Keeping losses small and consistent.
• Letting winning trades reach their planned targets.
• Following their trading plan instead of chasing a high win rate.
• Measuring long-term expectancy rather than short-term results.
A trader with a 40–50% win rate and disciplined risk management can outperform someone with an 80% win rate who refuses to cut losses.
The goal isn't to be right every time.
The goal is to ensure that when you're right; you earn enough to comfortably cover the trades that don't work out.
Many beginners become obsessed with increasing their win percentage. They move stop-losses, take profits too early, or avoid valid setups simply because they fear taking another loss.
Ironically; these habits often reduce profitability over the long run.
Professional traders think differently.
They understand that losses are a normal business expense—not a personal failure. Instead of trying to eliminate losses completely; they focus on making sure every losing trade remains controlled while every winning trade has room to deliver meaningful returns.
Key Takeaways:
• A high win rate does not guarantee profitability.
• Risk management matters more than accuracy.
• Your average winner should outweigh your average loser.
• Consistency beats perfection over the long term.
• Focus on expectancy—not ego.
The market doesn't reward traders for being right the most often. It rewards those who manage risk effectively, stay disciplined, and allow probability to work in their favor over hundreds of trades.
Would you rather have a 90% win rate with poor risk management, or a 45% win rate with consistent profitability? Share your thoughts below—I'd love to hear your perspective.
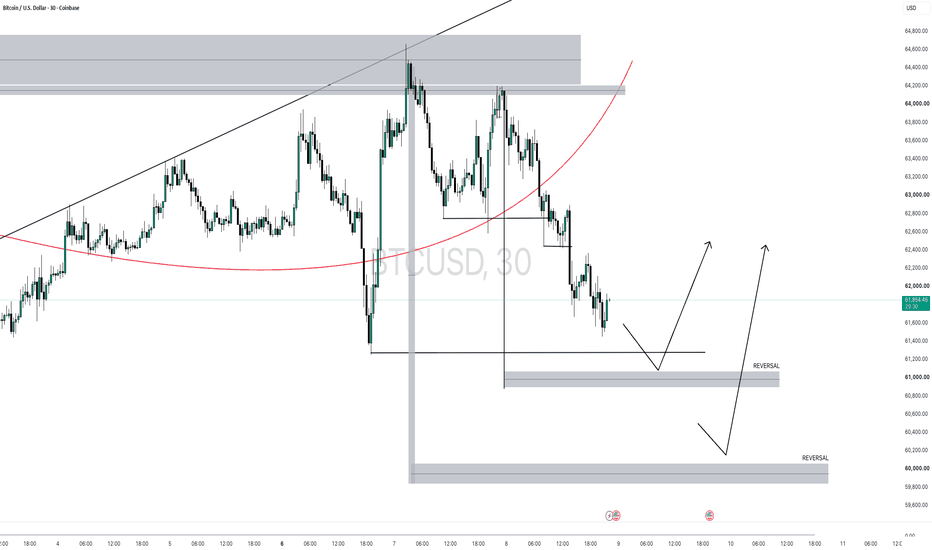
Bitcoin View 8-july 2026Market Footprinting Trading Concept
Timeframe: 30 Minutes
Bias: Bullish 📈
BTC/USD is currently approaching a high-probability Reversal Zone, where institutional demand is expected to absorb selling pressure. According to the Market Footprinting Trading Concept, the ongoing decline is forming a Decline Curve, a structure that often signals seller exhaustion before a bullish expansion.
The two highlighted grey areas represent Institutional Reversal Zones. These are the preferred areas to monitor for buying opportunities rather than chasing the market lower.
Market Footprinting Analysis
The market has been creating a series of lower highs while gradually moving into discounted pricing. As price approaches the marked demand footprints, bearish momentum continues to weaken, increasing the probability of institutional accumulation.
The Decline Curve suggests that this move is entering its final phase, where buyers are expected to defend liquidity and initiate the next bullish leg.
Reversal Zones for Buying
Primary Buying Zone
The first highlighted Reversal Zone is the preferred area for buyers.
Watch for price acceptance and signs of demand absorption.
This zone offers the highest probability for an early bullish reversal.
Secondary Buying Zone
If the first demand footprint fails to hold, the second highlighted Reversal Zone becomes the next institutional accumulation area.
A deeper liquidity sweep into this zone may provide an even stronger long opportunity before bullish continuation.
Both reversal zones should be treated as buying zones, not immediate entry signals.
Trading Plan
Bias: Bullish 📈
Buying Areas:
Primary Reversal Zone
Secondary Reversal Zone (if liquidity sweeps lower)
Entry:
After a confirmed 5-Minute Initial Reversal (I.R.)
CRT + ACS confirmation
Invalidation:
A strong close below the secondary reversal zone invalidates the bullish setup.
Targets:
Previous intraday resistance
Recent swing highs
Upper liquidity resting above the Decline Curve
Potential continuation toward the premium supply zone
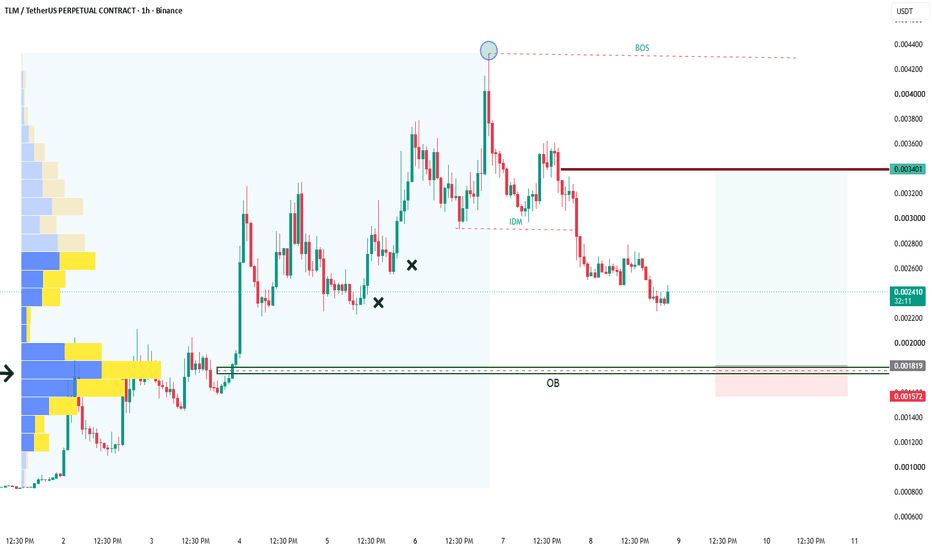
TLMUSDT Bullish SMC Setup | Order Block + Volume Profile ConflueThis chart highlights a potential bullish Smart Money Concepts (SMC) setup on TLMUSDT Perpetual (1H), combining Order Block analysis with Volume Profile for stronger trade confirmation.
Analysis Overview
✅ Bullish Break of Structure (BOS) confirmed
✅ Inducement (IDM) identified
✅ High-probability Bullish Order Block (OB) marked
✅ Volume Profile High Volume Node (HVN) aligns with the Order Block
✅ Waiting for bullish confirmation before entering
Trading Idea
After forming a Bullish BOS, the market completed an Inducement (IDM) and is now retracing toward a Bullish Order Block. The Order Block is supported by a High Volume Node (HVN) on the Volume Profile, adding extra confluence.
If buyers defend this area with strong bullish confirmation, the market could resume its uptrend and revisit the previous resistance/liquidity zone.
Invalidation
A strong bearish close below the Bullish Order Block would invalidate this setup and increase the probability of further downside.
This analysis combines Smart Money Concepts (SMC) with Volume Profile to identify high-probability trading opportunities. Always wait for confirmation before entering a trade.
Educational purposes only — Not Financial Advice.
#TLMUSDT #AlienWorlds #Crypto #SMC #SmartMoneyConcepts #OrderBlock #VolumeProfile #HVN #BOS #IDM #Liquidity #PriceAction #TradingView #CryptoAnalysis
BTCUSDT | 1H SMC Short Setup | Liquidity Sweep into Supply → MSS
BTC swept the previous liquidity resting above the equal highs and tapped directly into the 1H premium supply zone. Instead of accepting above resistance, price delivered a strong bearish displacement followed by a Market Structure Shift (MSS), confirming that sellers have regained control.
The rejection from the supply zone aligns with Smart Money Concepts:
✅ Liquidity sweep above recent highs.
✅ Reaction from a high-timeframe supply zone.
✅ Strong bearish displacement.
✅ 1H Market Structure Shift (MSS) confirms bearish order flow.
✅ Entry taken on the retest after confirmation rather than chasing the impulse.
As long as price remains below the invalidation zone, the expectation is for price to continue targeting the next major liquidity resting below the recent swing lows.
Trade Plan:
Bias: Bearish
Entry: Retest after MSS
Invalidation: Above the swept liquidity/high-timeframe supply
Target: Previous swing lows and external sell-side liquidity
Risk Management: Maintain a minimum 1:4+ Risk-to-Reward ratio.
Conclusion:
This setup follows a high-probability Smart Money framework: Liquidity Sweep → High-Timeframe Supply Rejection → Bearish MSS → Continuation toward Sell-Side Liquidity. Patience was key waiting for confirmation after the sweep significantly improved the probability of the trade.
This is my personal market analysis for educational purposes only and not financial advice.
ETHUSDT Bullish SMC Setup | Demand Zone + Volume Profile ConflueThis chart presents a potential bullish Smart Money Concepts (SMC) setup on ETHUSDT (1H), combining Demand & Supply Zones with Volume Profile for additional confluence.
Analysis Overview
✅ Demand Zone identified
✅ Supply Zone marked as the next target
✅ Inducement (IDM) formed before the pullback
✅ High Volume Node (HVN) aligns with the Demand Zone
✅ Waiting for bullish confirmation before entering
Trading Idea
Ethereum has completed a pullback into a high-probability Demand Zone, which also aligns with a High Volume Node (HVN) on the Volume Profile. This confluence suggests that buyers may become active if price shows a strong bullish reaction.
A confirmed bounce from the Demand Zone could lead to a continuation toward the Supply Zone, where liquidity and potential selling pressure may exist.
Invalidation
A strong bearish close below the Demand Zone would invalidate this bullish setup and increase the probability of further downside.
This analysis combines Smart Money Concepts (SMC) with Volume Profile to identify high-probability trading opportunities. Always wait for confirmation before entering a trade.
Educational purposes only — Not Financial Advice.
#ETHUSDT #Ethereum #SMC #SmartMoneyConcepts #VolumeProfile #HVN #DemandZone #SupplyZone #IDM #Liquidity #PriceAction #Crypto #TradingView #EthereumAnalysis
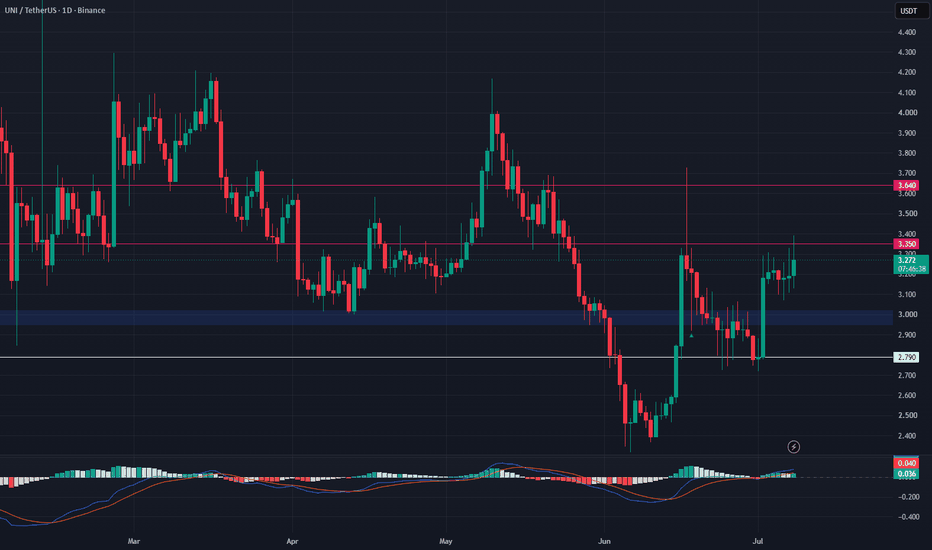
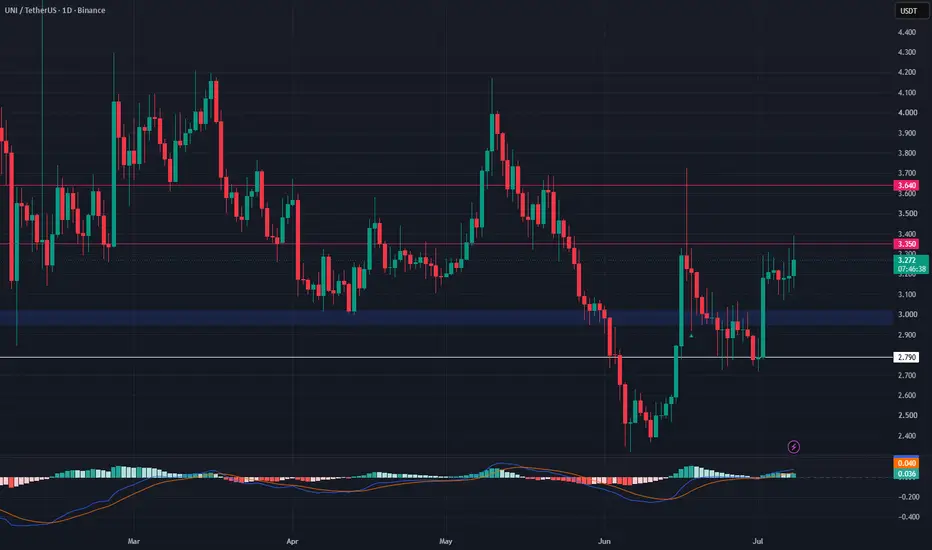
UNI Price Analysis: Key Support Zone to WatchUNI has surged almost 15% since our last analysis and is now trading in a strong short-term uptrend.
Momentum remains positive, but with geopolitical tensions increasing, a short-term pullback is still possible. If war-related headlines trigger another risk-off move, UNI may retest its major support zone, which could offer an attractive long-entry opportunity.
Our view is that if buyers defend the $2.95–$3.02 support area and market sentiment stabilizes, UNI could resume its upward move toward the next major resistance levels.
Trade Levels:
Entry Zone: $2.95 – $3.02
Take Profit 1: $3.35
Take Profit 2: $3.64
Stop Loss: $2.79
Bias: Bullish while UNI holds above the support zone.
BTCUSDT Bullish SMC Setup | Order Block Mitigation + External OrThis chart presents a Smart Money Concepts (SMC) analysis on BTCUSDT (1H), focusing on Order Block Mitigation and External Order Block reactions.
Analysis Overview
✅ Bullish Break of Structure (BOS) identified
✅ Inducement (IDM) completed
✅ Price revisiting a Bullish Order Block (OB Mitigation)
✅ External Bullish Order Block marked as a major demand zone
✅ Waiting for bullish confirmation before continuation
Trading Idea
After forming a Bullish BOS, the market created an Inducement (IDM) and is currently retracing into a Bullish Order Block Mitigation area.
If this mitigation zone fails to hold, the next high-probability reaction area is the External Bullish Order Block, where institutional buying interest may return.
I will wait for clear bullish confirmation before considering any long positions. This analysis focuses on market structure and liquidity rather than predicting price movement.
Invalidation
A strong bearish close below the External Bullish Order Block would invalidate this bullish outlook.
This analysis is based on Smart Money Concepts (SMC) and is shared for educational purposes only. Always wait for confirmation before entering a trade.
Not Financial Advice.
#BTCUSDT #Bitcoin #SMC #SmartMoneyConcepts #OrderBlock #OBMitigation #ExternalOrderBlock #BOS #IDM #Liquidity #PriceAction #Crypto #TradingView #BitcoinAnalysis
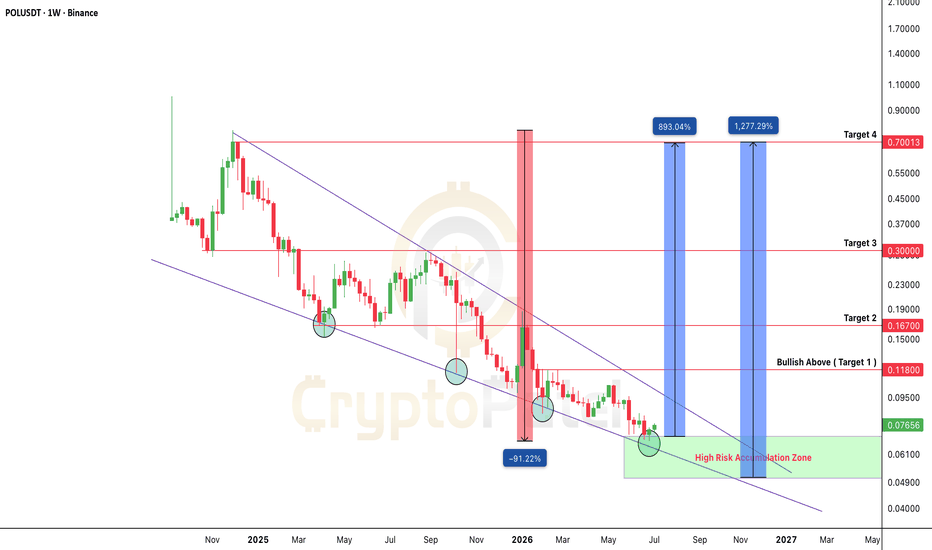
$POL DROPPED -91% FROM ITS LOCAL TOP: IS THIS 10x GEM?PSX:POL DROPPED -91% FROM ITS LOCAL TOP: IS THIS THE NEXT HIGH RISK-HIGH REWARD HTF ACCUMULATION?
#POL Is Currently Trading Inside A Multi-Year Weekly Descending Channel And Has Reached A High-Timeframe Accumulation Zone Following A Brutal -91% Correction.
The Last Time Price Tested Channel Support, It Delivered Strong Relief Rallies.
Now #POL Is Once Again Sitting At The Same Macro Support Area.
Current Technical Structure:
✅ Multi-Year Weekly Descending Channel Still Intact
✅ Price Testing Lower Channel Support For The Fourth Time
✅ High Risk Accumulation Zone Forming At HTF Demand
✅ Selling Momentum Continues To Weaken After A -91% Correction
✅ Bullish Confirmation Only Above $0.118 (Market Structure Shift)
CryptoPatel Targets If This Structure Holds: $0.12 | $0.17 | $0.3 | $0.7
Why Expect 2x–9x From Here?
The Current Positioning Offers One Of The Best Risk-Reward Opportunities Since POL Is Trading Near Multi-Year Channel Support Where Previous Reversals Started. If Buyers Successfully Defend This HTF Demand Zone And Price Reclaims $0.118, The Probability Of A Macro Trend Reversal Increases Significantly. The Longer POL Accumulates At These Discount Levels, The Stronger The Potential Expansion Phase Could Become.
Disclaimer: This Is Technical Analysis, Not Financial Advice. Markets Are Probabilistic, Not Guaranteed. Always Use Proper Risk Management And Do Your Own Research.
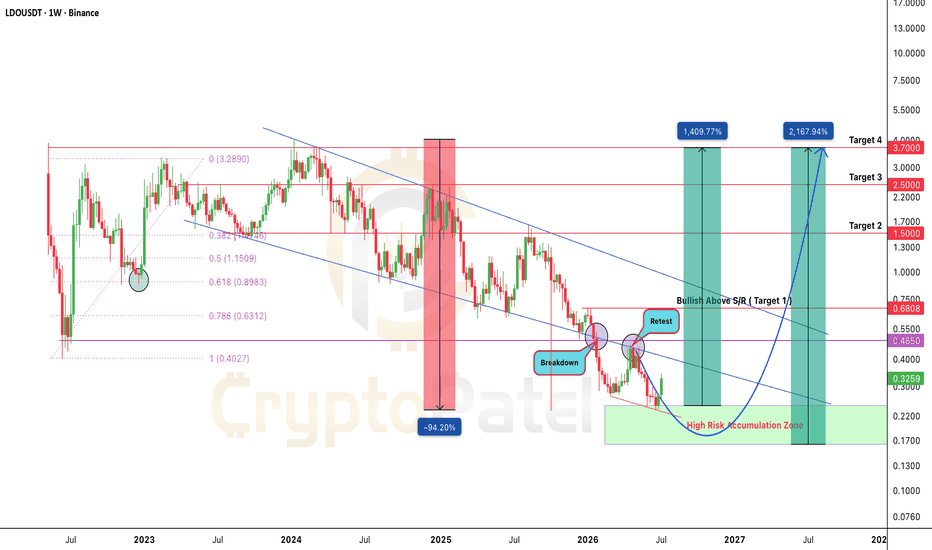
Everyone Ignored $LDO After A -94% Collapse. 21x Potential ?Everyone Ignored MIL:LDO After A -94% Collapse. The Technical Recovery Potential From Here Exceeds 2,100%
#LDO Is Currently Trading Inside A High Risk-High Reward HTF Accumulation Zone After A ~94.20% Correction From Its Cycle High. Price Is Sitting Near Multi-Year Demand While The Weekly Structure Approaches A Critical Inflection Point.
Technical Structure
✅ Previous Cycle High: ~$4.038 (Macro Liquidity High)
✅ Macro Correction: −94.20% Into Current Accumulation Range
✅ Multi-Year Descending Channel Still Defines HTF Trend
✅ Bearish Breakdown Followed By Retest & Rejection Of Channel Resistance
✅ Lower High Structure Remains Intact On Weekly Timeframe
✅ Price Holding Inside Major HTF Demand / Accumulation Zone
✅ Bullish Confirmation Only Above $0.68 (Weekly S/R Reclaim)
✅ Trend Reversal Confirmation Above $0.68 HTF Close
✅ Risk Invalidation: Sustained Weekly Acceptance Below Current Demand Zone
➡️ 2023-2024: Expansion Toward Cycle High Near $4.038
➡️ 2024-2026: -94.20% Corrective Decline Into Macro Demand
➡️ High-Risk Accumulation Zone: $0.25-$0.16
➡️ Current Phase: Late-Stage Accumulation Within Long-Term Downtrend
Structure Shift Requirements
1️⃣ Weekly Close Above Descending Channel Resistance
2️⃣ Reclaim + Acceptance Above $0.68 (Major S/R Flip)
3️⃣ Break Weekly Lower High At $1.50 To Confirm HTF Trend Reversal
Bull Cycle Targets (If Structure Shifts): $0.68 → $1.50 → $2.50 → $3.70
Invalidation: Failure To Hold The Current HTF Demand Zone And Continued Rejection Below The Descending Channel Would Keep The Macro Bearish Structure Intact.
The Current Zone Represents A High-Risk, High-Reward Accumulation Opportunity. However, The Higher Timeframe Trend Remains Bearish Until Price Reclaims $0.68 And Confirms A Structural Shift.
TA Only. Not Financial Advice. ALWAYS DYOR.
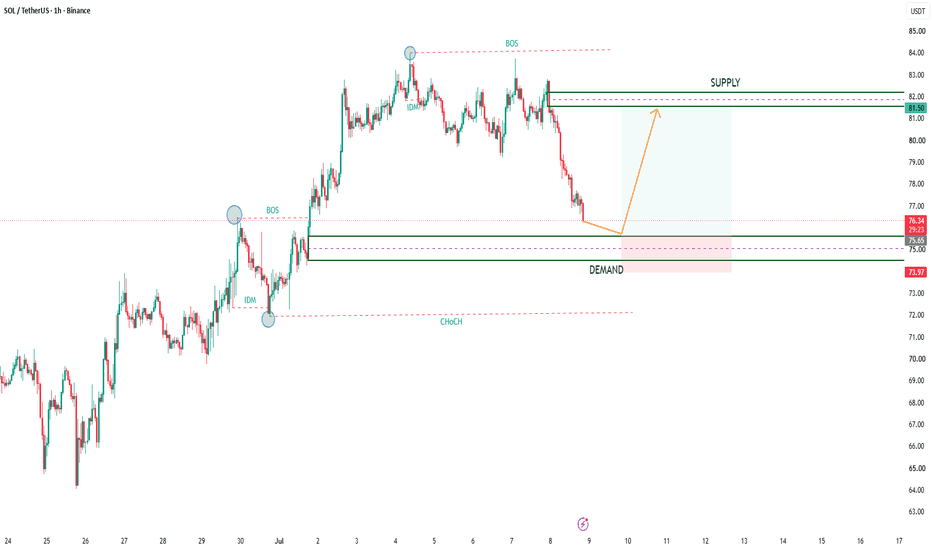
SOLUSDT Bullish SMC Setup | Demand Zone Retest + BOS + IDM (1H)his chart highlights a potential bullish Smart Money Concepts (SMC) setup on SOLUSDT (1H).
Analysis Overview
✅ Bullish Break of Structure (BOS) confirmed
✅ Inducement (IDM) sweep completed
✅ Price retracing into a high-probability Demand Zone
✅ Looking for bullish confirmation from the Demand Zone
✅ Target is the previous Supply/Liquidity area
Trading Idea
After confirming a Bullish BOS, the market created an Inducement (IDM) before entering a corrective move. Price is now approaching a well-defined Demand Zone, where buyers may step back into the market.
If the Demand Zone holds and bullish confirmation appears, the next objective could be a continuation toward the previous Supply Zone and liquidity resting above.
Invalidation
A strong candle close below the Demand Zone would invalidate this bullish setup and increase the probability of further downside.
This analysis is based on Smart Money Concepts (SMC). Always wait for confirmation before entering a trade.
Educational purposes only — Not Financial Advice.
#SOLUSDT #Solana #Crypto #SMC #SmartMoneyConcepts #DemandZone #SupplyZone #BOS #IDM #Liquidity #PriceAction #TradingView #CryptoTrading
BTCUSDT Bullish SMC Setup | Order Block Retest + IDM + BOS (1H)This analysis highlights a potential bullish Smart Money Concepts (SMC) setup on BTCUSDT (1H).
Analysis Overview
✅ Bullish Break of Structure (BOS)
✅ Inducement (IDM) sweep completed
✅ Price approaching a bullish Order Block (OB)
✅ Looking for a reaction from the Order Block before continuation
✅ Target is the previous supply/liquidity zone
Trading Idea
The market has already confirmed a bullish BOS, indicating strength from buyers. After sweeping liquidity (IDM), price is currently retracing toward a bullish Order Block.
If the Order Block holds and buyers step in with a strong bullish confirmation, the next objective could be a move toward the previous resistance/liquidity area.
Invalidation
A sustained close below the bullish Order Block would invalidate this setup and suggest further downside.
This is a market structure analysis based on Smart Money Concepts (SMC). Wait for confirmation before entering any trade.
Educational purposes only — Not Financial Advice.
#BTCUSDT #Bitcoin #SMC #SmartMoneyConcepts #OrderBlock #BOS #IDM #Liquidity #Crypto #TradingView #PriceAction #BitcoinAnalysis
Options TradingPCR means Put Call Ratio
It tells us how many Put options and Call options people are buying or trading.
Why it matters for institution trading
Big players mostly use options. So PCR helps us understand what big money may be thinking.
If PCR is high
More puts than calls.
Means traders are scared or taking protection.
Sometimes big players expect weakness.
If PCR is low
More calls than puts.
Means confidence in upside.
Sometimes market is bullish.
Why learn this
Price only shows movement.
Range-bound with a bearish bias.📊 Market Bias
Range-bound with a bearish bias.
🔑 Key Levels
Resistance: 64,100–64,500
Support: 61,700–62,000
💧 Liquidity Zones
Buy-side: Above 64,500
Sell-side: Below 61,700
🎯 Entry Setup
✅ Buy from support after confirmation.
✅ Sell from resistance after confirmation.
🛑 Stop Loss
Buy: Below 61,700
Sell: Above 64,500
🎯 Targets
Buy: 63,200 → 64,100 → 64,500
Sell: 62,500 → 62,000 → 61,700
⚖️ Risk : Reward
1 : 3
📈 Trade Probability
🟢 Bullish: 35%
🔴 Bearish: 45%
⚪ Neutral: 20%
⚠️ Retail Trap
Don't trade in the middle of the range. Let price reach support or resistance first.
🎥 One-Line Summary
Bitcoin is ranging between key support and resistance. The highest-probability trades come from the edges of the range, not the middle.
If price stays below 64,100, my bias remains bearish. A strong close above 64,500 would shift my bias toward bullish.
⚠️ DISCIPLE-FX Disclaimer: This analysis is shared for educational purposes only and reflects my personal market view. It is not financial advice. Always do your own analysis and manage your risk before taking any trade.
Imagine Putting $100K Into $TAC Yesterday..It's Only ~$7K TodayNYSE:TAC Just Crashed 93% of Its Value - A Brutal Reminder of Crypto's Biggest Risk.
This Is One of Crypto's Biggest Credibility Problems
NYSE:TAC (TAC Protocol) just suffered a massive collapse, wiping out around ~93% of its value Within Last 24 Hours.
Dumped From $0.05456 to $0.004024
Imagine Putting $100K Into NYSE:TAC Yesterday... It's Worth Only $7,380 Now Mean Pure $92,620 Loss in Just One Day
When Crash like this happen and there's little transparency or accountability from projects or exchanges, it becomes much harder to build trust.
Then we wonder why retail investors hesitate to enter the market.
NFA & DYOR