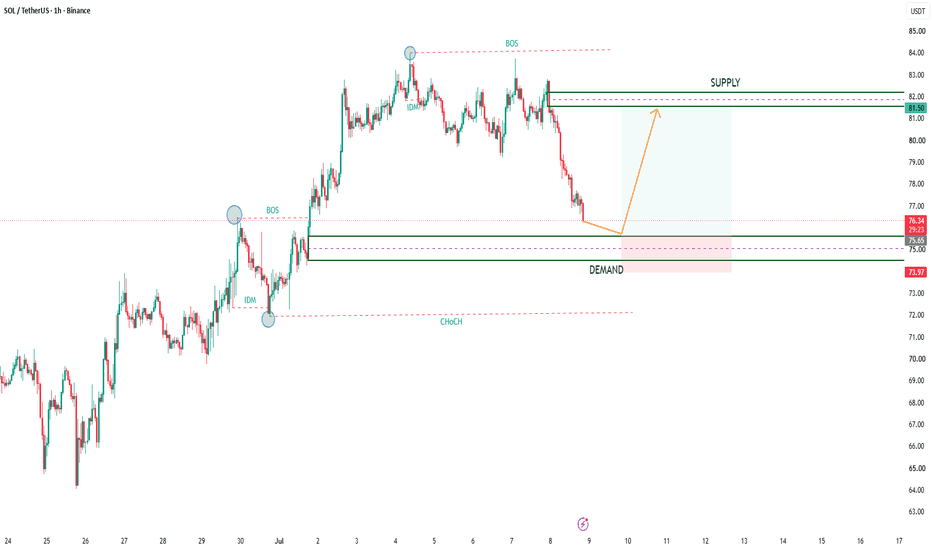
SOLUSDT Bullish SMC Setup | Demand Zone Retest + BOS + IDM (1H)his chart highlights a potential bullish Smart Money Concepts (SMC) setup on SOLUSDT (1H).
Analysis Overview
✅ Bullish Break of Structure (BOS) confirmed
✅ Inducement (IDM) sweep completed
✅ Price retracing into a high-probability Demand Zone
✅ Looking for bullish confirmation from the Demand Zone
✅ Target is the previous Supply/Liquidity area
Trading Idea
After confirming a Bullish BOS, the market created an Inducement (IDM) before entering a corrective move. Price is now approaching a well-defined Demand Zone, where buyers may step back into the market.
If the Demand Zone holds and bullish confirmation appears, the next objective could be a continuation toward the previous Supply Zone and liquidity resting above.
Invalidation
A strong candle close below the Demand Zone would invalidate this bullish setup and increase the probability of further downside.
This analysis is based on Smart Money Concepts (SMC). Always wait for confirmation before entering a trade.
Educational purposes only — Not Financial Advice.
#SOLUSDT #Solana #Crypto #SMC #SmartMoneyConcepts #DemandZone #SupplyZone #BOS #IDM #Liquidity #PriceAction #TradingView #CryptoTrading
Crypto market
BTCUSDT Bullish SMC Setup | Order Block Retest + IDM + BOS (1H)This analysis highlights a potential bullish Smart Money Concepts (SMC) setup on BTCUSDT (1H).
Analysis Overview
✅ Bullish Break of Structure (BOS)
✅ Inducement (IDM) sweep completed
✅ Price approaching a bullish Order Block (OB)
✅ Looking for a reaction from the Order Block before continuation
✅ Target is the previous supply/liquidity zone
Trading Idea
The market has already confirmed a bullish BOS, indicating strength from buyers. After sweeping liquidity (IDM), price is currently retracing toward a bullish Order Block.
If the Order Block holds and buyers step in with a strong bullish confirmation, the next objective could be a move toward the previous resistance/liquidity area.
Invalidation
A sustained close below the bullish Order Block would invalidate this setup and suggest further downside.
This is a market structure analysis based on Smart Money Concepts (SMC). Wait for confirmation before entering any trade.
Educational purposes only — Not Financial Advice.
#BTCUSDT #Bitcoin #SMC #SmartMoneyConcepts #OrderBlock #BOS #IDM #Liquidity #Crypto #TradingView #PriceAction #BitcoinAnalysis
Options TradingPCR means Put Call Ratio
It tells us how many Put options and Call options people are buying or trading.
Why it matters for institution trading
Big players mostly use options. So PCR helps us understand what big money may be thinking.
If PCR is high
More puts than calls.
Means traders are scared or taking protection.
Sometimes big players expect weakness.
If PCR is low
More calls than puts.
Means confidence in upside.
Sometimes market is bullish.
Why learn this
Price only shows movement.
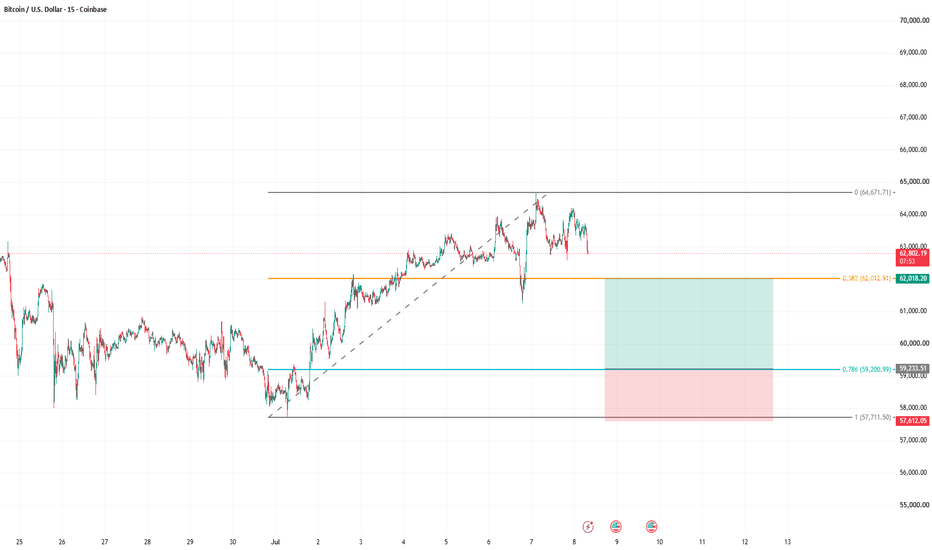
Range-bound with a bearish bias.📊 Market Bias
Range-bound with a bearish bias.
🔑 Key Levels
Resistance: 64,100–64,500
Support: 61,700–62,000
💧 Liquidity Zones
Buy-side: Above 64,500
Sell-side: Below 61,700
🎯 Entry Setup
✅ Buy from support after confirmation.
✅ Sell from resistance after confirmation.
🛑 Stop Loss
Buy: Below 61,700
Sell: Above 64,500
🎯 Targets
Buy: 63,200 → 64,100 → 64,500
Sell: 62,500 → 62,000 → 61,700
⚖️ Risk : Reward
1 : 3
📈 Trade Probability
🟢 Bullish: 35%
🔴 Bearish: 45%
⚪ Neutral: 20%
⚠️ Retail Trap
Don't trade in the middle of the range. Let price reach support or resistance first.
🎥 One-Line Summary
Bitcoin is ranging between key support and resistance. The highest-probability trades come from the edges of the range, not the middle.
If price stays below 64,100, my bias remains bearish. A strong close above 64,500 would shift my bias toward bullish.
⚠️ DISCIPLE-FX Disclaimer: This analysis is shared for educational purposes only and reflects my personal market view. It is not financial advice. Always do your own analysis and manage your risk before taking any trade.
Imagine Putting $100K Into $TAC Yesterday..It's Only ~$7K TodayNYSE:TAC Just Crashed 93% of Its Value - A Brutal Reminder of Crypto's Biggest Risk.
This Is One of Crypto's Biggest Credibility Problems
NYSE:TAC (TAC Protocol) just suffered a massive collapse, wiping out around ~93% of its value Within Last 24 Hours.
Dumped From $0.05456 to $0.004024
Imagine Putting $100K Into NYSE:TAC Yesterday... It's Worth Only $7,380 Now Mean Pure $92,620 Loss in Just One Day
When Crash like this happen and there's little transparency or accountability from projects or exchanges, it becomes much harder to build trust.
Then we wonder why retail investors hesitate to enter the market.
NFA & DYOR
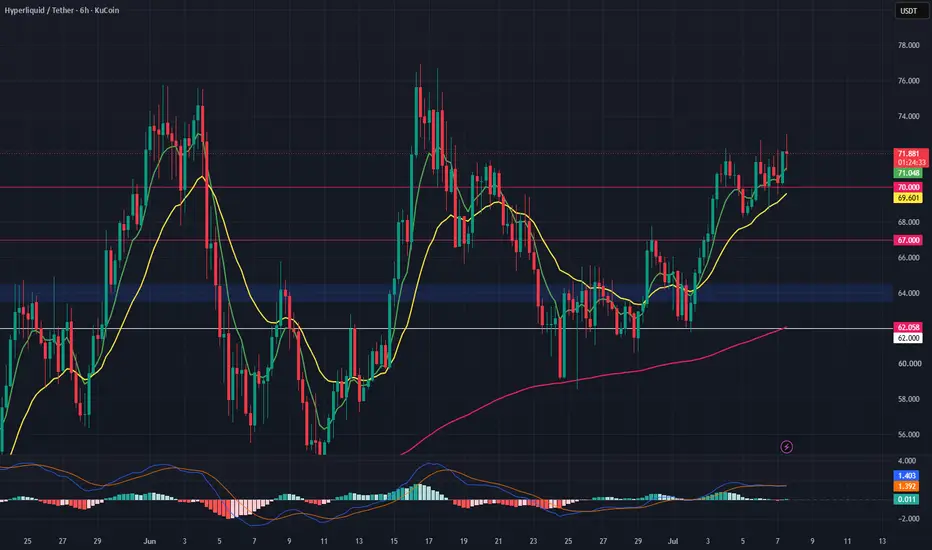
HYPE Bullish Structure Holding — Pullback Entry SetupHYPE remains one of the strongest charts in the market after breaking out of its multi-week downtrend.
The price is now holding above all key moving averages, which keeps the overall structure bullish. However, instead of chasing the rally, the better setup is to wait for a pullback into the $64.50 support zone.
If geopolitical tensions create a temporary sell-off and this level continues to hold, it could present a high-probability entry for a continuation move toward the recent highs.
Trade Levels:
Entry Zone: $63.50 – $64.50
Take Profit Targets: $67 and $70
Stop Loss: $62
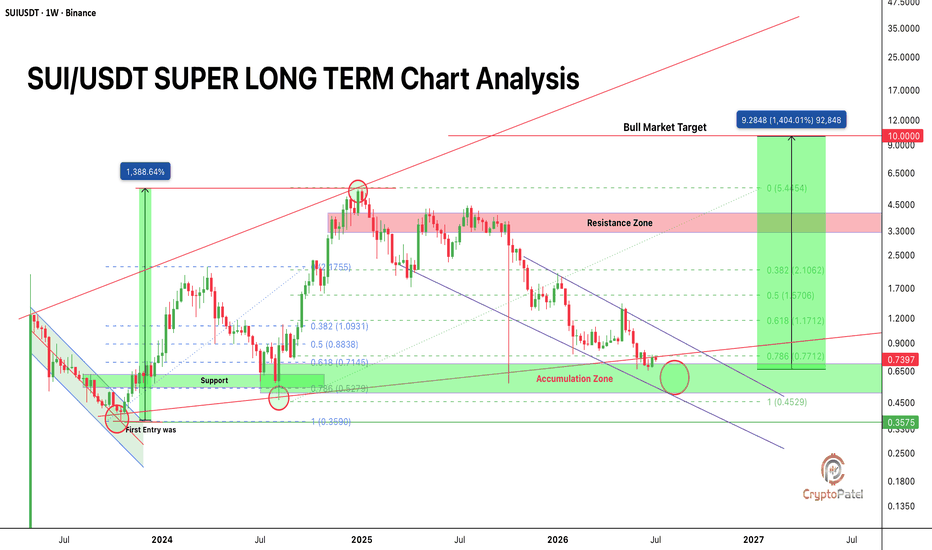
Will $SUI Ready for $10-$20 Potential Rally?CRYPTOCAP:SUI Is Being Accumulated So Cleanly That $10 - $20 Looks Like Just A Matter Of Time.
#SUI Is Holding A Tight Range. Buyers Are Stepping In On Every Dip. Sellers Are Running Out Of Steam. This Is Exactly What It Looks Like Before A Big Move.
Entry Zone: $0.70 - $0.50
Targets: $5 | $10 | $20
The Downside Is Small. The Upside Is Huge. That's The Kind Of Setup You Wait For.
When It Finally Breaks Out, It Won't Wait For Anyone.
Save This. Mark Your Levels. Come Back When It Plays Out.
Not Financial Advice. ALWAYS DYOR.
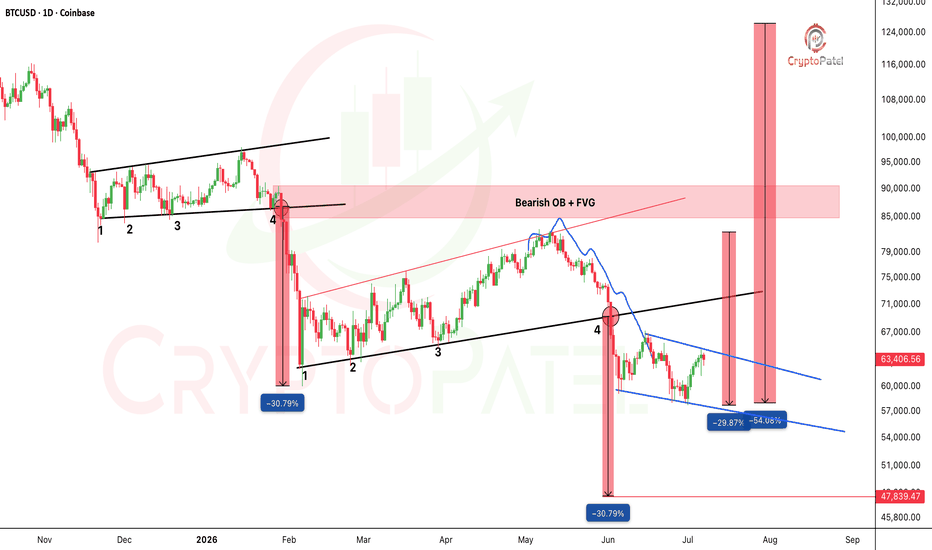
Will Bitcoin Still Chance to hit $48000?CRYPTOCAP:BTC : The Higher-Timeframe Structure Continues To Respect A Clear Bearish Fractal.
Current Price Action Is Repeating The Same Distribution Sequence Seen Earlier This Cycle:
→ Rising Channel
→ 1-2-3 Formation
→ Point 4 Rejection
→ Aggressive Markdown
The First Fractal Produced A −30% Decline.
Now, The Second Fractal Has Also Completed Point 4 Rejection, Suggesting The Markdown Phase May Already Be Underway.
Technical Levels:
🔹 Major Supply: $85K–$90K (Bearish Order Block + Fair Value Gap)
🔹 Primary Target: $47,839 (−30% Measured Move)
🔹 Extended Downside: A Breakdown Below $47.8K Could Open The Door To A −54% Correction.
Price Continues To Trade Inside A Descending Channel While Printing Lower Highs, Keeping Bears In Control.
A Confirmed Daily Close Above The $74,156 Trendline Would Invalidate This Bearish Structure.
Until Then, Every Relief Rally Into Resistance Should Be Viewed As A Distribution Opportunity Rather Than A Trend Reversal.
NFA & ALWAYS DYOR
$FET at Macro Accumulation: HTF Setup With 5,500% Upside PotentiNYSE:FET at Macro Accumulation: HTF Setup With 5,500% Upside Potential
#FET is trading inside a multi-year Weekly Bullish Order Block after a deep correction, with price now sitting in a high-confluence accumulation zone that has historically triggered strong expansion phases.
Technical Structure:
✅ Multi-Year Bullish Order Block Holding
✅ Descending Channel Nearing Breakout
✅ Sell-Side Liquidity Grab Completed
✅ Rising Macro Trendline Still Intact
✅ 78.6% Fibonacci Support Around $0.128
✅ HTF Accumulation Zone Active ( $0.09-$0.055 )
✅ Bullish Bias Above $0.30 (Weekly Close)
CryptoPatel HTF Targets: $0.26 → $0.43 → $0.7 → $5+
Invalidation: Weekly Close Below $0.052
A confirmed weekly breakout above the descending channel and reclaim of $0.26 could trigger the next macro markup phase.
Previous Cycles:
🔹 Cycle 1: +15,600%
🔹 Cycle 2: +6,400%
🔹 Cycle 3: Potential +5,500%
Model: SMC + ICT + HTF Liquidity Mapping
TA Only. Not Financial Advice. ALWAYS DYOR.
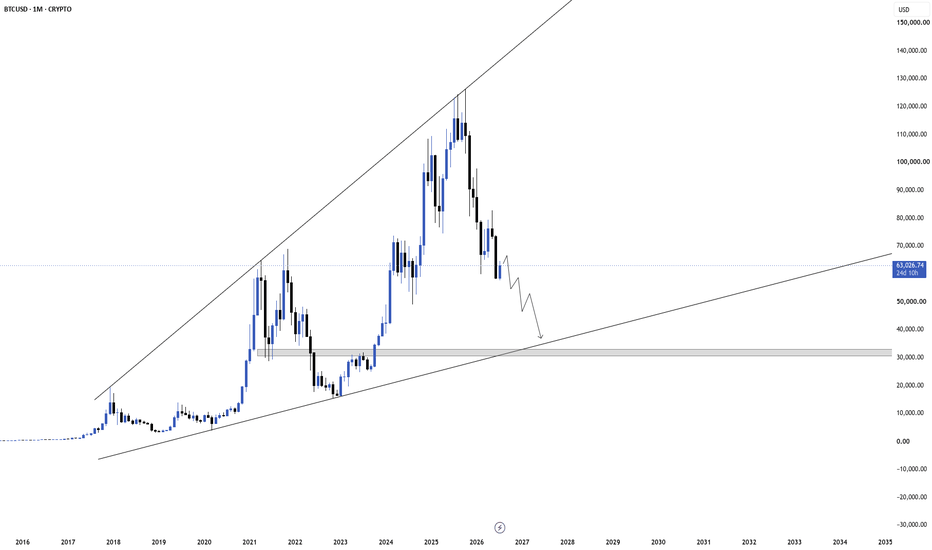
BTCUSD | Monthly Chart | Long-Term Rising Channel AnalysisBitcoin has once again reached the upper boundary of its long-term rising channel and faced a strong rejection. Historically, every major touch of this resistance has been followed by a significant correction before the next expansion phase.
Key Observations
• Price rejected from the upper trendline after printing a new all-time high.
• Bearish momentum is currently dominating on the monthly timeframe.
• The highlighted gray zone around $30,000–35,000 represents a major historical support and demand area.
• This zone also aligns closely with the lower boundary of the long-term channel, making it an important area to watch.
Possible Scenario
If selling pressure continues, BTC could gradually move toward the long-term support region over the coming months. A reaction from that area could determine whether the long-term bullish structure remains intact or breaks down.
What I'm Watching
✅ Monthly candle closes
✅ Reaction around the long-term support trendline
✅ Buyer strength inside the $30k–35k demand zone
This is a technical analysis based on price structure and historical market behavior—not a prediction or financial advice. Markets can invalidate any setup at any time, so always manage your risk.
How I am Positing Long Term SPCX Bullish move - 15 Min TFNote: This is not a Financial Advice but my personal thought on how i am approaching SPCX stock
SpaceX has officially joined the Nasdaq-100, becoming one of the fastest companies ever to enter the index after listing.
Why does this matter?
Because index inclusion creates mechanical demand.
It isn't about emotions.
It isn't about retail FOMO.
It's about how passive investing works.
Every ETF and index fund that tracks the Nasdaq-100 (think QQQ, QQQM, and similar funds) now has to purchase SpaceX shares to match the index. Analysts estimate roughly $4.3 billion of passive buying tied to the inclusion.
That buying happens regardless of whether fund managers are bullish or bearish.
It's simply how index tracking works.
This is why index inclusion often becomes a structural price catalyst, not just a one-day news event.
How I'm approaching
I'm accumulating real SpaceX shares because I still believe this company has multiple long-term growth engines:
• Starlink
• AI infrastructure
• Starship
• Government contracts
• Global connectivity
For short-term?
Momentum around major catalysts create volatility. This is where this trade place out. In the 15min TF, I am expecting a short retracement around the 150 15MIn OB then a push up to 1hr FVG around 170
well, i will also have my spot trade around that 150 section and not worries about waiting for regular U.S. market hours because i can catch the move swiftly bitget 24/7 trade... So as i am entering a long so also, I am entering to buy
Using 1 stone to hit 2 birds...
Other key Takes that is Supporting mu Fundamental Catalyst:
Less than 5% of SpaceX shares are publicly floated after the IPO, meaning a relatively small supply is available while passive funds are required to buy. Limited float plus large institutional demand can amplify price moves.
Wall Street firms have started publishing research after the IPO quiet period ended, with several major brokerages initiating bullish coverage based on long-term growth prospects.
Many investors are already watching for potential future inclusion in the S&P 500, which if eligibility requirements are metcould create another wave of passive demand
.
Note: This is not a Financial Advice but my personal thought on how I am approaching SPCX
IS $PENDLE THE GENERATIONAL BUY BEFORE 1,600% RALLY?CRYPTOCAP:PENDLE DROPPED -87% FROM ATH: IS THIS THE GENERATIONAL BUY BEFORE 1,600% RALLY?
#PENDLE Has Completed A Brutal -87% Correction From Its $7.53 Cycle High And Is Now Building A Rare, High-Timeframe Rounding Accumulation Base On The Weekly Chart.
The Last Time This Setup Formed, PENDLE Delivered:
2023: +1,521% (15x From The Accumulation Zone)
2026: +1,700% (17x Potential)?
Current Technical Structure:
✅ Weekly Bullish Order Block ($1.17–$0.99) Tapped, Entry 1 Filled
✅ Price Consolidating At The 0.618 Golden Pocket ($1.350)
✅ Rounded Accumulation Base Forming, Classic Wyckoff Behavior
✅ 0.786 Fib At $0.845 Remains The Deeper Sweep/Entry Zone
✅ Last Accumulation Zone $0.55–$0.65, Invalidated Below
✅ Bullish Mode Confirmed Only Above $2.201 (Weekly MSS Trigger)
CryptoPatel Targets: If Structure Flips Above $2.201: $3 → $6 → $15
Cycle Extension: A Full Macro Expansion Opens The Door Toward $30 (5,300%+ From The Base).
Why Expect 2x–10x From Here? Deep Discount Pricing At HTF Demand With Smart Money Re-Accumulation Footprints And Defined Invalidation Creates Heavily Asymmetric Upside. The Longer The Base, The Higher The Space.
This Is Not A Chase Setup, This Is An Accumulation Setup. Patience Until $2.201 Flips, Or Scale In On A $0.845 Sweep With Tight Invalidation.
Disclaimer: This Is A TA, NFA. Markets Are Probabilistic, Not Guaranteed. Always Manage Risk And Do Your Own Research.
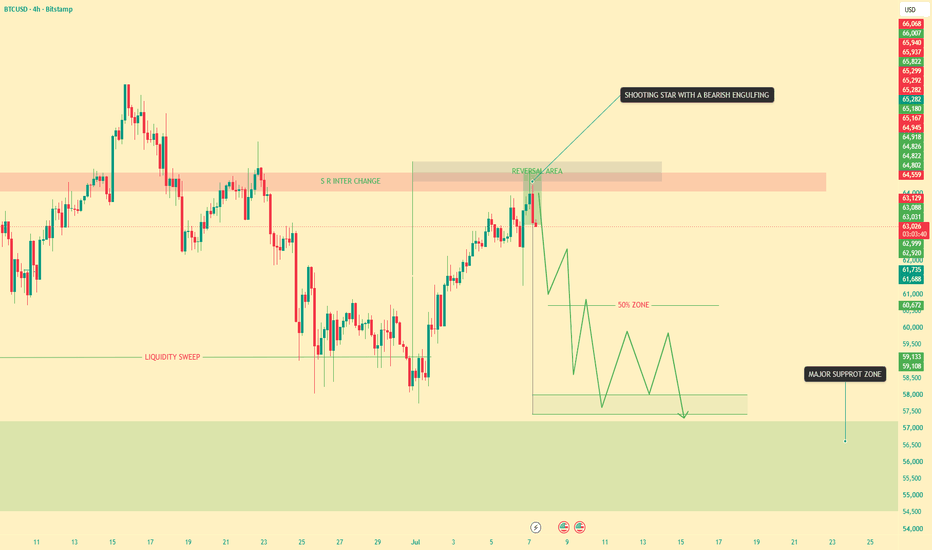
PREDICTION ON BTCUSD 4H TFBITSTAMP:BTCUSD is currently trading inside a high-probability reversal area, which also aligns with a major Support-Resistance (SR) interchange level. This is a significant zone because it previously acted as support before turning into resistance, and from this exact region the market experienced a strong impulsive decline. The current retest suggests that sellers may once again defend this level.
The rejection around the reversal area strengthens the bearish case for the week. If this resistance continues to hold, the market could begin forming lower highs and lower lows, shifting momentum back in favor of the bears.
The overall expectation for this week remains bearish, with the current rejection from the reversal area serving as the primary confirmation. As long as price remains below the SR interchange zone, the path of least resistance appears to be to the downside.
A temporary bullish retracement cannot be ruled out. If buyers manage to regain some momentum, the most probable retracement target would be around the 50% level of the projected bearish move. This area could provide another opportunity for sellers to step back into the market before the next leg down.
If the bearish scenario unfolds as expected, BTC could continue its decline toward the Major Support Zone highlighted on the chart. This area has historically acted as a strong demand zone where price has repeatedly produced meaningful bullish reactions. A move into this region would be a logical destination for the current bearish structure and may become the next area to monitor for a potential trend reversal or significant bounce.
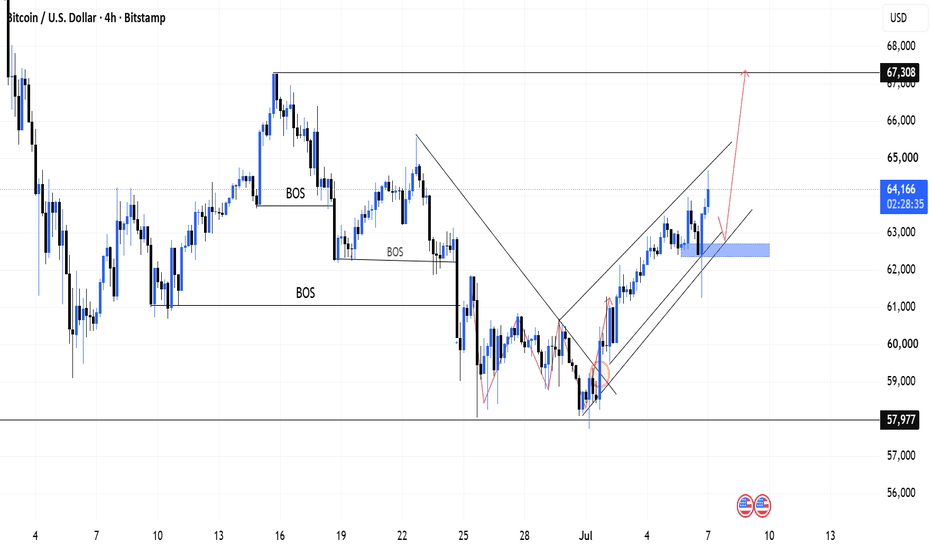
BTCUSD (4H) Analysis: Internal Bullish Relief BTCUSD (4H) Analysis: Internal Bullish Relief Within Major Bearish Structure 📊
Market Overview 🌐
Looking at the 4-hour timeframe, Bitcoin's overall higher-timeframe market structure remains fundamentally bearish, characterized by consecutive Breaks of Structure (BOS) to the downside. However, after tapping the lower liquidity pool near the $58k–$59k region, the market has initiated a local bullish counter-trend shift.
Technical Breakdown 🔍
Higher-Timeframe Trend: The dominant trend is still bearish due to previous structural breaks, suggesting that any upside movement should currently be treated as a corrective phase or internal relief rally. 📉
Internal Order Flow Shift: Locally, the price has established a series of higher highs and higher lows, forming a well-defined ascending channel. This indicates strong internal bullish momentum in the short term. 📈
Potential Retest / Mitigation Zone: The immediate area of interest is the demand zone/mitigation block highlighted around $63,000 (blue box). A healthy corrective pullback into this zone could potentially happen to mitigate orders and build liquidity. 🎯
Upside Target: If the internal bullish structure holds and respects the key support/mitigation zone, we could potentially see an extension targeting the major structural swing high near $67,308. 🚀
Trading Perspective 🧠
This is a classic scenario of trading an internal counter-trend movement within a larger bearish structure. Patience is key. Watching for lower timeframe confirmation (CHoCH/Flip) within the highlighted demand zone could provide a clearer invalidation setup for the upside projection. ⚖️
Always manage your risk appropriately and wait for confirmation. 🔥
Disclaimer: This analysis is for educational and informational purposes only and does not constitute financial advice. Trading involves significant risk
Options TradingPCR means Put Call Ratio
It tells us how many Put options and Call options people are buying or trading.
Why it matters for institution trading
Big players mostly use options. So PCR helps us understand what big money may be thinking.
If PCR is high
More puts than calls.
Means traders are scared or taking protection.
Sometimes big players expect weakness.
If PCR is low
More calls than puts.
Means confidence in upside.
Sometimes market is bullish.
Why learn this
Price only shows movement.
PCR shows mindset behind movement.
Institutions think different
Retail people chase candles.
Institutions manage risk first.
$ONDO After a Brutal -90% Wipeout: 40x Potential for 2026-2027?LSE:ONDO After a Brutal -90% Wipeout: Accumulation Zone Filled, Is a 40x Macro Reversal Loading for 2026-2027?
#ONDO is trading at $0.33 after completing a full -90.58% markdown from the $2.14 ATH, with price now expanding out of a filled macro accumulation zone on the weekly timeframe.
Technical Structure:
✅ Weekly Bearish Divergence at the $2.10+ Top Marked Macro Distribution
✅ Long-Term Ascending Trendline Broken with Force
✅ Clean BreakDown + Retest Confirmed at $0.75--$0.80
✅ Strong Support Became Strong Resistance (Classic S/R Role Reversal)
✅ Full -90.58% Markdown Flushed All Weak Hands
✅ Macro Demand Zone Tapped: $0.18--$0.23 (2024 Rally Origin)
✅ Bullish Order Flow Confirmed: Accumulation Zone Filled
✅ First Impulsive Leg Printed: +118% Reaction Off the Lows
✅ Structure Now Reads Re-Accumulation, Not Distribution
CryptoPatel HTF Expansion Targets: $0.55 → $0.80 → $1.20 → $2 → $5 → $10
Invalidation: Weekly Close Below $0.17
If the $0.18--$0.23 base continues absorbing sell-side pressure, ONDO/USDT could be positioning for a major 2026-2027 markup phase driven by the RWA narrative and tokenization sector rotation.
Important Note:
The $5 (+2,900%) and $10 (+4,340%) projections are macro cycle expansion targets measured from the accumulation range, not short-term trade levels. Expect deep pullbacks and range-building along the path. A weekly close above $0.80 (old trendline flip zone) fully confirms the macro bullish structure shift.
Model: SMC + Order Flow + HTF Demand Zone Mapping + Wyckoff Accumulation Structure
TA Only. Not Financial Advice. ALWAYS DYOR.
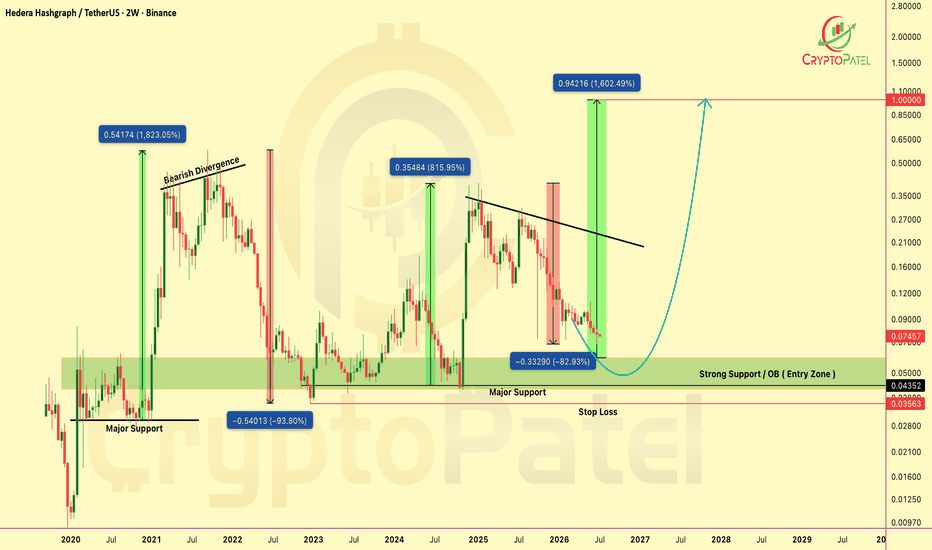
$HBAR TO $1? The 1,600% Macro Setup Is Quietly Taking Shape CRYPTOCAP:HBAR TO $1? The 1,600% Macro Setup Is Quietly Taking Shape 🚀
#HBAR has corrected nearly 83% from its local high and is now trading Near a major weekly demand zone that has historically launched explosive rallies of 800%–1,800%.
Structure Breakdown:
HTF price has returned to a strong weekly Order Block (OB) + major historical support, a zone where institutional buyers have previously stepped in.
The macro correction has brought price back into a high-confluence accumulation area, while the descending trendline remains the final barrier before trend reversal confirmation.
Key Levels:
✅ Weekly Bullish OB / Demand Zone: $0.058–$0.042
✅ Major Historical Support Holding
✅ HTF Structure Remains Valid Above $0.0356 (Weekly Close Below = Invalidation)
✅ Breakout Trigger: Reclaim & Weekly Close Above The Descending Trendline
Upside Targets: $0.16 ➜ $0.35 ➜ $1
Potential 1,600% upside if the next macro expansion follows previous cycle behavior.
Macro Cycle Outlook:
➜ 2020: Macro Accumulation At Major Support
➜ 2021: +1,800% Explosive Bull Run
➜ 2022–2023: ~94% Bear Market Correction
➜ 2024: +800% Relief Rally
➜ 2025–2026: ~83% Reset Back Into Weekly Demand (You Are Here)
Smart Money Accumulates At Major Support, Not After The Breakout.
As long as CRYPTOCAP:HBAR holds this weekly Order Block, the macro risk/reward remains highly attractive.
If Price Hold Above $0.058-40.042 Level could mark the beginning of the next expansion phase, with $1.00 as the primary macro target.
Purely TA Based | Not Financial Advice | DYOR
What Is Your HBAR/USDT Target This Cycle? Drop It Below 👇
Like + Share + Bookmark
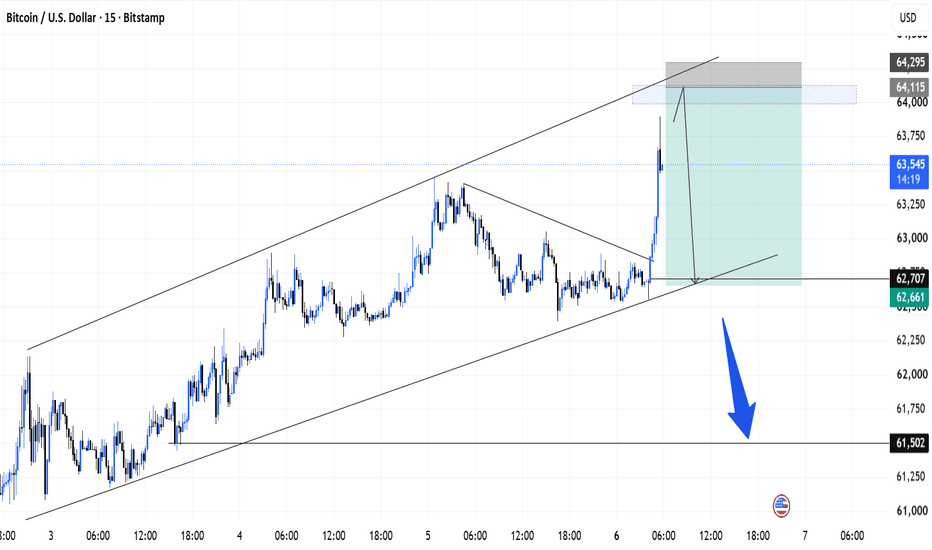
BTCUSD Intraday Setup: Spotting Signs of Near-Term Exhaustion📉 BTCUSD Intraday Setup: Spotting Signs of Near-Term Exhaustion (15m) ⚡
🧩 Market Context & Structural Alignment:
The 15-minute chart of Bitcoin (BTCUSD) reveals price action closely respecting an expanding bearish wedge / ascending channel framework. Currently, the asset is displaying an aggressive push toward the upper boundary of this structure, approaching a significant liquidity pool and intraday resistance ceiling around the $64,250 - $64,350 cluster.
We are tracking this specific mitigation zone for a potential shifts in order flow, looking for structural rejection patterns that could trigger a corrective rotation back toward the lower structural support.
🛡️ Tactical Trade Management:
Instead of chasing the momentum, the focus here is strictly on high-probability execution with tight capital preservation parameters.
Trade Horizon: Intraday Short Bias 🔴
Risk Protection (Stop Loss): Positioned stringently just above the overhead resistance invalidation level to maintain a heavily asymmetric risk-to-reward ratio. 🛑
Downside Objective (Take Profit): Aiming for a retest of the lower channel equilibrium and structural liquidity pools below. 🎯
⚠️ Critical Disclaimer:
This publication is intended purely for behavioral chart observation and technical indexing. Trading cryptocurrencies involves extreme volatility and risk. It does not constitute financial or execution advice
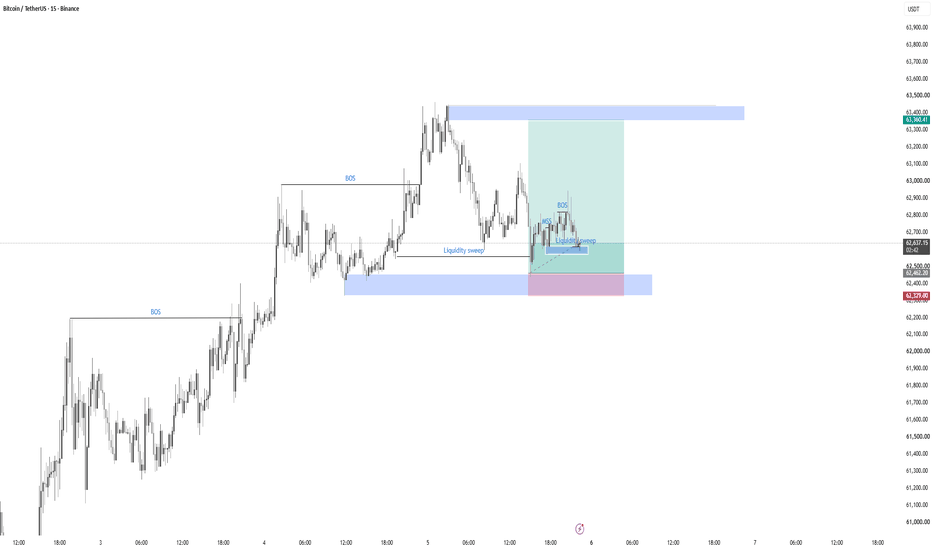
BTCUSDT 15M | Liquidity Sweep + Market Structure Shift + Demand Trade Idea
Price has been trading in a bullish market structure, printing consecutive BOS (Break of Structure) before reaching a premium supply area. After tapping the highs, buyers failed to continue the expansion and the market delivered a strong bearish displacement.
The sell-off swept liquidity resting below the recent equal lows before price found support inside a 15-minute demand zone. From this demand, the market formed a Market Structure Shift (MSS) on the lower timeframe, signaling that buyers are attempting to regain short-term control.
Rather than chasing the move, I waited for:
✅ Liquidity sweep below recent lows.
✅ Bullish MSS after displacement.
✅ Retest of the swept liquidity area.
✅ Entry from the demand zone with defined risk.
Target
The primary objective is the unmitigated supply zone above, where previous selling originated. This area also aligns with premium pricing, making it a logical location for buyers to secure profits.
BTCUSDT Rejected at ResistanceBTCUSDT on the 1-hour timeframe is showing signs of weakness after failing to break above the 63,090 resistance level. Price attempted a recovery but was rejected from the resistance area, indicating that sellers are defending this zone.
The highlighted 62,700–62,950 resistance zone remains a key supply area. As long as BTC trades below this region, the short-term bias favors a bearish continuation. A loss of the current consolidation support could trigger increased selling pressure.
Key Levels
Major Resistance: 63,300 – 63,550
Resistance: 62,700 – 62,950
Invalidation: Hourly close above 63,090
Target 1: 62,360
Target 2: 62,080
Trade Idea
Watch for continued rejection or bearish confirmation below the resistance zone.
A breakdown beneath the current consolidation may open the door toward 62,360, followed by 62,080.
If buyers reclaim 63,090 with strong momentum, the bearish setup would be invalidated, and BTC could retest the major resistance zone.