 Short
Short
 Long
Long
GOLD COULD FOOL THE ENTIRE MARKET BEFORE ITS REAL MOVE!Gold is currently trading inside an important range between roughly $4380 and $4440, and I believe what happens around this range could decide the next major move.
If you look at the last two sessions, Monday trapped sellers, while Tuesday trapped buyers.
Now, when I zoom out and look at the bigger structure, there is no doubt that the broader structure still looks bearish. Because of that, I believe more traders are naturally becoming interested in selling Gold.
Tuesday made this psychology even stronger.
Many traders were waiting for Gold to break above the $4440 area, but instead of getting that breakout, price rejected from there and delivered a sharp move lower.
So now think about what the majority is likely seeing:
“$4440 rejected. The larger structure is bearish. If support breaks, Gold should continue lower.”
And this is exactly why the downside becomes interesting to me.
We are still inside a range. Once either side of this range breaks, traders will naturally start building positions in the direction of that breakout.
On the downside, I’m watching roughly the $4392–$4370 area very closely. From a higher-timeframe perspective, this is an important liquidity area.
If Gold breaks below this zone, especially below approximately $4365, I expect that breakdown to attract even more sellers.
Traders who were already bearish may add positions, while some traders who were previously bullish may finally flip bearish because they’ll believe the downside continuation has been confirmed.
But this is where my view becomes different.
When an important HTF area and previous liquidity are being taken at almost the same time, I don’t automatically treat the breakdown as genuine continuation.
I first ask:
Is Gold actually accepting lower prices — or is the market simply using the breakdown to attract sellers and collect liquidity?
That distinction is extremely important.
So for Wednesday, I actually WANT to see another push lower first.
I want Gold to attack the downside liquidity, potentially break below $4365, and make the bearish continuation look convincing enough to attract more sellers.
But I will NOT buy simply because $4365 gets swept.
I need confirmation.
If the breakdown happens and then strong buying volume enters the market, price starts reclaiming the broken area, and the counter-move shows that buyers are genuinely stronger than the sellers who entered on the breakdown, THAT is where I become interested.
I would then look for a pullback to execute the buy rather than chasing the initial reversal.
My upside objective would be the Monday/Tuesday highs, with the broader level I’m interested in chasing sitting around $4450.
So my Wednesday plan is simple:
I’m not interested in randomly buying the current range.
I want the market to move lower first, attract sellers below an important liquidity area, and then show me that those sellers are getting trapped.
DOWNSTROKE → SELLERS ENTER → LIQUIDITY TAKEN → STRONG BUYING RESPONSE → RECLAIM → PULLBACK → BUY.
If that sequence doesn’t appear, there is no reason for me to force the trade.
For me, Wednesday is not about predicting the bottom.
It’s about waiting for the market to reveal who is actually stronger after the downside liquidity is taken.
Let the crowd react to the breakdown.
I’ll react to what happens AFTER the breakdown. 🎯
Short 
XAU/USD - Trendline Pressure Builds, Bulls Eye 4,550Nice new day, Traders!
OANDA:XAUUSD is compressing beneath a long descending trendline while holding inside the 4,370–4,430 buy zone. Price has repeatedly reacted from this support area, and the Ichimoku structure is beginning to flatten, suggesting the bearish pressure is losing momentum.
The setup becomes much cleaner if buyers continue defending 4,370–4,430 and price breaks decisively above the descending trendline. That would confirm a stronger short-term shift and open the way toward:
🎯 Target: 4,550
I wouldn’t chase before the breakout. The better sequence is support holds → trendline breaks → continuation.
A sustained H1 move below 4,370 would weaken the bullish setup and suggest sellers still control the broader structure.
AURICVERSE View: Gold is sitting at an important decision point. Buyers already have the support zone; now they need the trendline. If that resistance finally gives way, 4,550 becomes the next level on my radar.
Breakout next, or one more sweep of the buy zone first? Long 
XAUUSD – Consolidation Between Key LevelsXAUUSD: Gold Consolidating Above Key Support
Gold is consolidating around the 4,400 area on the 1-hour chart after recovering from lower levels.
The 4,365 zone remains an important support area, while 4,487–4,511 forms the key resistance region.
A sustained move above 4,487 could signal further upside toward 4,511. On the other hand, a break below 4,365 would weaken the current structure and shift attention toward lower levels.
Key levels:
Support: 4,365
Resistance: 4,487–4,511
This is a technical market analysis for educational purposes only, not financial advice. Long 
Short 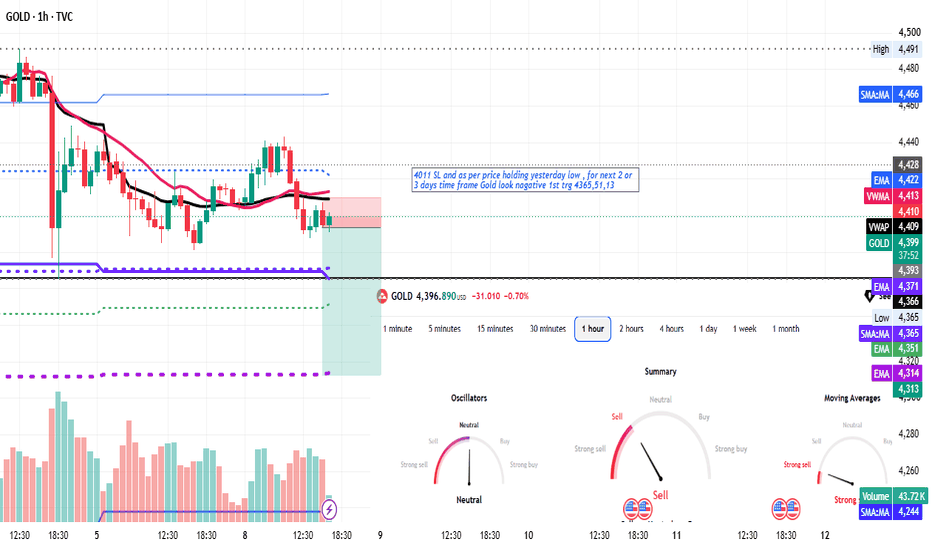
Long 
◈ XAUUSD — Buy Zone Holds, Wave 3 Next ◈ XAUUSD — Buy Zone Holds, Wave 3 Next
Gold is still holding above the short-term buy zone after the latest correction. From Kelly’s view, the chart suggests that XAUUSD may be preparing for another bullish Elliott Wave move while price stays above the Buy zone wave 3.
The key idea is simple: geopolitical tension around Iran and the Persian Gulf is still supporting safe-haven demand, but the market may remain volatile ahead of U.S. CPI data and the next Fed decision. Iran has warned that attacks on its assets could trigger retaliation, while reports also show rising pressure around Gulf shipping and energy assets. U.S. CPI is scheduled for Friday, and the Fed meeting is set for September 15–16, so gold may react strongly to both risk sentiment and rate expectations.
⟡ Market Structure
Gold is currently trading around 4,392–4,410, holding near the Buy zone wave 3. This area is important because it may act as the base for the next bullish impulse.
The previous bearish wave appears to have completed near 4,283, followed by a strong recovery. Price is now correcting inside a short-term structure, but as long as gold stays above 4,366, the bullish recovery scenario remains valid.
The first upside liquidity is around 4,441, followed by 4,476 and the stronger liquidity level near 4,510. If buyers can break above these zones, gold may continue toward the 4,585–4,605 Resistance Fibonacci + FVG area.
➤ Key Levels
◌ Current price area: 4,392–4,410
◌ Buy zone wave 3: 4,385–4,400
◌ Confirm sell / risk level: below 4,366
◌ Strong support: 4,283
◌ First liquidity: 4,441
◌ Second liquidity: 4,476
◌ Strong liquidity: 4,510
◌ Resistance Fibonacci + FVG: 4,585–4,605
◌ Final wave 5 target: 4,725–4,740
⌁ Elliott Wave View
The chart shows a possible bullish Elliott Wave recovery after the previous bearish wave 5 completed near 4,283.
Wave (1) may have formed from the lower support.
Wave (2) is correcting back into the buy zone.
If buyers defend 4,385–4,400, wave (3) may push toward 4,510 and then 4,585–4,605.
After that, wave (4) may create a short pullback before wave (5) targets the upper zone near 4,725–4,740.
This is why Kelly is not chasing price aggressively. The cleaner plan is to wait for confirmation that buyers are still defending the buy zone.
▸ Trading Scenario
Preferred bullish scenario
Entry: Buy around 4,385–4,400 if price gives bullish confirmation
Stop Loss: Below 4,366
Take Profit 1: 4,441
Take Profit 2: 4,476–4,510
Take Profit 3: 4,585–4,605
Take Profit 4: 4,725–4,740
Alternative scenario
If gold breaks below 4,366, the bullish wave 3 setup becomes weaker. In that case, price may retest the deeper support near 4,283 before any new bullish structure appears.
◌ Invalidation
The bullish view becomes weaker if gold loses 4,366 and fails to reclaim the buy zone. A clean breakdown below this level would shift the short-term focus back to downside risk.
⌁ Kelly’s View
Kelly’s main view remains bullish while gold holds above 4,385–4,400. Geopolitical tension may continue to support gold, but CPI and Fed expectations can create sharp volatility, so confirmation is important before entering.
If buyers defend the buy zone, gold may continue toward 4,441, 4,510, and then the larger resistance area around 4,585–4,605. The bigger Elliott target remains near 4,725–4,740.
Do you think gold will start wave (3) from this buy zone, or break lower first to retest deep support? Long 
Short 
XAUUSD Short Setup: Neutral to Negative Structure | 8/9/26XAUUSD is currently displaying a negative to neutral trend on the 15-minute timeframe. Following a significant sell-off from the 4,460 area, the price has established a lower high near 4,439 and is currently encountering resistance around the 4,428–4,430 supply zone. The market structure favors the downside, presenting a potential short opportunity if buying momentum continues to stall.
Trade Idea:
Look for bearish rejection or consolidation below the immediate resistance to enter a short position, targeting the liquidity zones and recent swing lows to the downside.
Key Resistance Levels (Supply / Invalidation):
4,439.37: Immediate resistance and recent lower high. A break above this level weakens the short-term bearish bias.
4,460.57: Major structural resistance.
Key Support Levels (Demand / Take Profit Targets):
4,418.79: Immediate downside target.
4,406.11: Secondary support.
4,393.22 – 4,385.53: Major liquidity zone and recent swing low. This is the primary target for the short setup.
4,363.50 & 4,351.86: Extended downside targets if bearish momentum accelerates.
Execution Plan:
Watch for confirmation of rejection around the current 4,428–4,439 resistance block. A breakdown below the 4,418.79 support will add confidence to the bearish continuation. Keep a strict stop loss above 4,440 to protect against unexpected bullish volume. Short 


XAUUSD – Gold Holds Support, 4,473 In Focus XAUUSD – Gold Holds Support, 4,473 In Focus
Gold is trading around 4,403 after a sharp pullback from the upper resistance area.
The short-term structure is now at an important decision point. Price has returned to the buy order liquidity zone near 4,399 – 4,410, which is also close to the rising trendline support on the chart. This area may decide whether gold continues the recovery or forms another bearish leg.
From the fundamental side, gold is still supported by geopolitical tension in the Persian Gulf. New threats from Iran and fresh risk concerns may keep safe-haven demand active. However, traders are also waiting for U.S. CPI data, and this can increase volatility because inflation data may affect Fed rate expectations.
Technical view:
Gold pulled back after rejecting from the upper FVG area.
Price is now reacting near the 4,399 – 4,410 buy order liquidity zone.
As long as this zone holds, the short-term recovery structure remains valid.
The first resistance to break is around 4,448.
If gold breaks above 4,448, the next target is the sell scalping liquidity zone around 4,473.
A stronger bullish continuation may push price toward the upper channel area near 4,520 – 4,540.
If gold loses 4,399, the recovery structure becomes weaker and price may retest lower support.
Key levels to watch:
Current price: 4,403
Buy order liquidity zone: 4,399 – 4,410
First resistance: 4,448
Sell scalping liquidity: 4,473
Upper resistance target: 4,500 – 4,520
Invalidation: below 4,380
Main scenario:
If gold holds above 4,399 – 4,410 and forms bullish confirmation, buyers may try to push price back toward 4,448 first.
A clean break above 4,448 can open the way toward 4,473.
If momentum stays strong, the next upside area will be around 4,500 – 4,520.
Alternative scenario:
If gold breaks below 4,399 and fails to recover quickly, sellers may regain short-term control.
In that case, price may move lower toward 4,380 before another reaction appears.
Hannah’s view:
Gold is still holding the key support area, but confirmation is very important today.
I do not want to chase the market while price is sitting inside the decision zone. The cleaner plan is to wait and see whether buyers can defend 4,399 – 4,410.
Main view: gold remains supported while holding above 4,399. A break above 4,448 supports continuation toward 4,473. No confirmation means no trade.
Do you think gold will defend the buy order liquidity zone, or will CPI pressure push price lower first?
Long 
Long 
BRIAN XAUUSD – GOLD RECOVERS, BUT 4,425 IS THE DECISION ZONE BRIAN XAUUSD – GOLD RECOVERS, BUT 4,425 IS THE DECISION ZONE
Gold is trying to extend its recovery from last week’s low near 4,283, supported by broad USD weakness.
The Japanese yen continues to strengthen as stronger wage growth and upgraded GDP data increase expectations that the Bank of Japan may tighten policy faster. That pressure on USD/JPY is also weighing on the US dollar, giving gold short-term support.
However, the technical chart is not fully clean yet.
Gold is recovering, but it is now reacting directly below a major volume resistance zone. This means buyers still have momentum, but they need to prove strength above value before the next bullish leg becomes reliable.
Technical structure
On the 45-minute chart, gold is trading around 4,408 after recovering from the lower area.
The key resistance is the POC + HVN – Major Volume Resistance zone around 4,420 - 4,430. This is where price is currently struggling. If gold cannot reclaim this zone, the recovery may slow down and rotate lower again.
Above that, the next important resistance is the Previous VAH – Upper Value Rejection zone around 4,470 - 4,480. This is the higher value area where sellers may react again if gold continues pushing upward.
Below current price, the VAL – Lower Value / Decision Zone around 4,375 - 4,385 is very important. If price drops into this area and buyers defend it, gold can rebuild momentum for another upside attempt.
If 4,375 fails, the deeper target is the Composite HVN – Major Acceptance Target around 4,320 - 4,330. This is the larger value base and may become the stronger buyer reaction zone.
Important zones
Current price area: 4,400 - 4,410
Gold is holding near the middle of the recovery structure.
POC + HVN resistance: 4,420 - 4,430
Main short-term decision zone.
Previous VAH resistance: 4,470 - 4,480
Upper value rejection area.
VAL decision zone: 4,375 - 4,385
First buyer defense area if price pulls back.
Composite HVN target: 4,320 - 4,330
Deeper value support and major reaction zone.
Trading scenario
Priority view: wait for reaction around 4,420 - 4,430
Sell reaction scenario
Entry:
Look for sell positions only if gold rejects clearly from 4,420 - 4,430 and fails to reclaim this volume resistance.
Stop Loss:
Above the rejection high or above the POC + HVN resistance.
Take Profit:
TP1: 4,375 - 4,385
TP2: 4,320 - 4,330
TP3: trail lower only if bearish momentum expands
This setup follows the idea that gold may need one more pullback before buyers return with stronger confirmation.
Buy continuation scenario
If gold breaks and accepts above 4,430, the recovery structure improves.
Entry:
Look for buy positions only after price reclaims 4,430 and retests it as support.
Stop Loss:
Below the reclaim zone or below the local sweep low.
Take Profit:
TP1: 4,470 - 4,480
TP2: 4,500
TP3: higher only if gold accepts above the previous VAH zone
Final view
Gold has a supportive macro background because USD weakness is helping the recovery. But technically, price is now sitting under a major volume resistance area, so chasing buy directly into 4,420 - 4,430 is risky.
For me, the map is simple:
Break above 4,430 = buyers regain short-term control.
Reject 4,420 - 4,430 = pullback toward 4,375 is likely.
Hold 4,375 - 4,385 = buyers can rebuild.
Lose 4,375 = deeper correction toward 4,320 - 4,330.
Break 4,480 = bullish continuation becomes stronger.
Gold is not weak, but it needs confirmation.
The next move depends on whether buyers can reclaim the POC + HVN resistance, or whether sellers force one more value reset first.
Will gold break above 4,430 and continue the recovery, or will sellers push price back into the 4,375 decision zone first?
Short 
Long 
Trendline pressure increases; gold's move may be sharp.Gold is currently compressed beneath the descending trendline, creating a clear technical decision point. After the sharp sell-off from the 4,500 area, price has recovered but remains capped below the trendline and the 4,440–4,450 Demand zone. The repeated inability to reclaim this resistance suggests that sellers are still defending the short-term structure, while the tightening price action raises the probability of a strong breakout once either side takes control.
From a macro perspective, Gold is still dealing with the aftermath of the stronger U.S. jobs report, which pushed expectations for a September Fed rate hike toward 60% and kept Treasury yields elevated. However, USD weakness today has allowed Gold to stabilize around 4,400. The next major catalyst is U.S. inflation: PPI on Thursday and CPI on Friday will be important for determining whether the Fed maintains a hawkish stance.
Technically, the key battle is now around 4,440–4,450. A rejection beneath the descending trendline would confirm that the current rebound is only corrective and could send Gold back toward 4,380–4,400, followed by the major 4,300–4,320 Supply zone. Conversely, if buyers can break and hold above the trendline with a confirmed H4 close, the bearish structure would begin to weaken and open the way toward 4,480–4,500.
Bearish Scenario — Preferred Bias
Gold fails to break the descending trendline and is rejected from 4,440–4,450. Sellers regain control, break below 4,380–4,400, and target 4,300–4,320.
Bullish Scenario
A clean H4 breakout above the descending trendline and 4,450 would be the first signal that sellers are losing control. Holding above this area could trigger a recovery toward 4,480–4,500, with 4,560 becoming the next major resistance.
At this stage, Lucas favors waiting for the breakout confirmation rather than anticipating it. The market is compressed, and the next decisive move could come from either the trendline breakout or a breakdown through 4,380.
BIAS: BEARISH — GOLD REMAINS UNDER THE TRENDLINE. WAIT FOR THE BREAKOUT CONFIRMATION. Short 
 Short
Short
XAUUSD: 4,382 Holds the Rebound Story XAUUSD: 4,382 Holds the Rebound Story
Market Context
Gold has ended its two-day decline with a decent rebound after buyers stepped back in below the 4,400 area.
The short-term recovery is supported by a weaker US Dollar, while the market is also watching the reaction around the 21-day SMA near 4,465. A clean move above that dynamic level would give buyers more confidence, especially with RSI improving.
But the chart is not fully bullish yet.
Gold is recovering, but price is still below the major premium zone at 4,470 - 4,490. This means the upside still has a serious resistance wall ahead.
Technical Structure
Gold reacted strongly from the Major Discount / Reversal Zone around 4,285 - 4,310, then pushed higher into the 4,480 - 4,490 area.
However, price failed to hold the upper reaction and started pulling back again. This tells us buyers are active, but sellers are still defending the premium area.
The most important intraday level now is 4,382. As long as gold stays above 4,382, the short-term rebound scenario remains alive. A hold above this level could support another push toward 4,440, then 4,465, and eventually 4,470 - 4,490.
But if 4,382 breaks clearly, gold may drop back toward 4,365 - 4,375 Key Demand. That zone becomes the next area where buyers must react.
Key Levels
Current Price: 4,402
Intraday Key Level: 4,382
Key Demand Zone: 4,365 - 4,375
Major Discount / Reversal Zone: 4,285 - 4,310
Short-term Resistance: 4,440 - 4,465
Premium / Bearish Reaction Zone: 4,470 - 4,490
Bullish Confirmation: Above 4,490
Bearish Continuation: Below 4,382
Trading Plan
Primary Buy Scenario
Entry: 4,382 - 4,400 after bullish confirmation
SL: Below 4,365
TP: 4,440 / 4,465 / 4,490
Condition: Price must hold above 4,382 and show a clear bullish reaction. If buyers defend this level, gold can continue the rebound toward the premium resistance zone.
Secondary Buy Scenario
Entry: 4,365 - 4,375 after strong bullish rejection
SL: Below 4,340
TP: 4,400 / 4,440 / 4,465
Condition: If gold breaks below 4,382 and sweeps into Key Demand, buyers need to respond quickly. This would be a deeper reaction buy, not a confirmed bullish continuation.
Primary Sell Scenario
Entry: 4,470 - 4,490 after bearish confirmation
SL: Above 4,520
TP: 4,440 / 4,400 / 4,382
Condition: If gold rebounds into the premium zone but fails to break higher, sellers may use this area to continue the short-term bearish pressure.
Breakdown Sell
Entry: Below 4,382 after breakdown and retest
SL: Above 4,410
TP: 4,375 / 4,365 / 4,310
Condition: Gold loses the intraday key level and cannot reclaim it. This would weaken the rebound structure and open the way back toward demand.
Bullish Continuation Scenario
Entry: Above 4,490 after breakout and retest
SL: Below 4,440
TP: 4,520 / 4,560 / 4,600
Condition: Buyers must break and hold above the Premium / Bearish Reaction Zone. Only then does the short-term bearish pressure begin to fade.
Overall Bias
Gold is trying to recover, but the recovery still needs confirmation.
Above 4,382, buyers still have a chance to push price toward 4,470 - 4,490. But below that premium zone, sellers can still create another rejection.
If 4,382 breaks, the rebound becomes weaker and gold may retest 4,365 - 4,375. If that demand also fails, the market could return toward the deeper reversal base around 4,285 - 4,310.
Best approach: do not chase the bounce into resistance. Watch 4,382 first, then wait for either a clean bullish hold or a bearish rejection from 4,470 - 4,490.
Will gold protect 4,382 and continue the rebound, or will sellers drag price back into Key Demand?
Short 
Long 
XAUUSD: Monday Pressure, 4,365 Decides the Rebound XAUUSD: Monday Pressure, 4,365 Decides the Rebound
Market Context
Gold starts the new week under short-term bearish pressure after failing to hold the recovery move above 4,470 - 4,490.
The market tried to rebound from the lower HTF demand area, but the reaction into the Main Mitigation Zone was not strong enough to confirm bullish continuation. Sellers stepped in again, and price is now trading around 4,402.
Monday sessions can often create false moves before the real weekly direction forms. That is why the key is not to chase the current movement, but to watch how gold reacts around the next liquidity support.
Technical Structure
The short-term structure remains bearish after the rejection from 4,470 - 4,490.
Gold formed CHoCH and BOS signals during the decline, showing that sellers still have control. The current pullback is moving lower from the mitigation area, and price has not reclaimed enough structure to confirm a clean bullish reversal.
The first important support is 4,365 - 4,375. This is the liquidity reaction zone buyers need to defend if they want to create another rebound. If gold reacts strongly from this area, price may recover back toward 4,440 first, then 4,470 - 4,490.
However, if 4,365 breaks and price retests it as resistance, the next downside target becomes the Major HTF Demand zone around 4,285 - 4,305.
Above the market, 4,470 - 4,490 remains the main decision zone. A rejection there keeps the bearish structure valid. A clean breakout above that zone would reduce selling pressure and open the door toward the Major HTF Supply area near 4,615 - 4,640.
Key Levels
Current Price: 4,402
Liquidity Reaction Zone: 4,365 - 4,375
Major HTF Demand: 4,285 - 4,305
Main Mitigation Zone: 4,470 - 4,490
Major HTF Supply: 4,615 - 4,640
Bullish Recovery: Above 4,490
Bearish Continuation: Below 4,365
Trading Plan
Primary Buy Reaction
Entry: 4,365 - 4,375 after bullish confirmation
SL: Below 4,340
TP: 4,420 / 4,440 / 4,470
Condition: Price must sweep into the liquidity reaction zone and show strong rejection. This is only a reaction buy unless gold reclaims 4,470 - 4,490.
Primary Sell Scenario
Entry: 4,470 - 4,490 after bearish confirmation
SL: Above 4,520
TP: 4,420 / 4,375 / 4,305
Condition: If gold rebounds into the Main Mitigation Zone and fails to break higher, sellers may use this area to continue the bearish move.
Breakdown Sell
Entry: Below 4,365 after breakdown and retest
SL: Above 4,400
TP: 4,330 / 4,305 / 4,285
Condition: Gold loses the liquidity support and cannot reclaim it. This would confirm that bearish pressure is expanding toward HTF demand.
Bullish Recovery Scenario
Entry: Above 4,490 after breakout and retest
SL: Below 4,440
TP: 4,540 / 4,600 / 4,615
Condition: Buyers must reclaim the Main Mitigation Zone with strength. Only then does the short-term bearish structure begin to weaken.
Overall Bias
Gold is still bearish in the short term, but 4,365 - 4,375 is the zone that can decide the first major reaction of the week.
If this zone holds, gold may rebound toward 4,470 - 4,490. But if that rebound fails, sellers remain in control.
If 4,365 breaks, the market can rotate lower toward 4,285 - 4,305, where the next major HTF demand sits.
Best approach: wait for confirmation. Do not chase sells into support and do not buy before reaction. Monday’s real story will likely be decided between 4,365 support and 4,490 resistance.
Will buyers defend 4,365, or will sellers drag gold back into 4,285 HTF demand?
Long 


