XAUUSD — Bullish Wave Structure Toward 4,490
From Kelly’s view, gold is rebuilding a bullish structure after breaking away from the previous descending trendline. Price is trading around 4,391, and the recent recovery suggests buyers are trying to establish a new impulsive sequence toward the upper Fibonacci resistance zones.
The key idea is simple: the main trend may stay bullish while price continues to form higher lows, with 4,405–4,415 acting as the first important resistance test before a potential expansion toward 4,459 and the 4,488–4,497 area.
⟡ Market structure
Gold has recovered strongly from the 4,240–4,260 swing-low area and is now trading above the former descending trendline.
The short-term structure has shifted toward higher lows, while the projected Elliott Wave path suggests another bullish impulse may be developing.
The first obstacle is the Fibonacci resistance zone around 4,405–4,415. If buyers can absorb selling pressure here, price could continue toward 4,433 and 4,459.
Above that, the major resistance and projected Wave (5) completion zone sits around 4,488–4,497, close to the 2.618 Fibonacci extension.
➤ Key levels
◌ Current price area: 4,390–4,395
◌ Main bullish retest zone: 4,375–4,390
◌ Strong support: 4,335–4,350
◌ First resistance: 4,405–4,415
◌ Key resistance: 4,433
◌ First target: 4,459
◌ Main target: 4,488–4,497
◌ Invalidation: Below 4,335
⌁ Elliott Wave view
Wave (1): The current recovery may extend toward the 4,405–4,415 resistance area.
Wave (2): A controlled pullback toward approximately 4,375–4,390 could follow if buyers take profit near resistance.
Wave (3): If the pullback holds and bullish confirmation appears, the stronger expansion could target 4,459.
Wave (4): Price may then consolidate or retrace toward the 4,430–4,440 area.
Wave (5): The final bullish leg could extend toward 4,488–4,497, where the major Fibonacci resistance and projected Wave (5) target overlap.
▸ Trading scenario
Preferred bullish scenario
Entry: 4,375–4,390 after bullish confirmation
Stop Loss: Below 4,335
Take Profit 1: 4,410–4,415
Take Profit 2: 4,459
Take Profit 3: 4,488–4,497
The cleaner plan is to wait for buyers to defend the projected Wave (2) retracement area rather than chase price directly into Fibonacci resistance.
Alternative scenario:
If gold breaks and holds above 4,415 without a deeper pullback, a confirmed retest of this zone could support continuation toward 4,433–4,459.
◌ Invalidation
The bullish structure would weaken if price loses the 4,335–4,350 support area and begins trading back below the recent higher-low structure. A sustained break below 4,335 would invalidate the preferred bullish wave sequence.
⌁ Kelly’s view
Kelly’s main view remains bullish while gold continues to defend its higher-low structure above 4,335–4,350.
The immediate test is 4,405–4,415. If buyers can break and hold above this Fibonacci resistance, the next wave may open the way toward 4,459, followed by the larger 4,488–4,497 Wave (5) target.
Do you think gold will complete this bullish wave structure toward 4,490, or retest the key support zone first?  Long
Long
XAUUSD – H2 Bullish Recovery Toward Supply
XAUUSD is trading around 4,354 after extending its recovery from the lower structural area. Price has broken above the recent descending trendline and printed an MSS, showing that short-term buyer momentum is improving. However, gold is now entering the first resistance / supply zone, so a controlled pullback may be needed before the next expansion.
Gold gained more than 2% on Thursday as the U.S. dollar weakened, oil prices eased and Treasury yields pulled back. Spot gold was still around 4,361 early Friday, while the U.S. 10-year yield moderated to roughly 4.94% and Brent slipped toward $103.77.
The broader macro backdrop remains restrictive. The Fed raised rates by 25 bp to 3.75%–4.00%, and 16 of 18 policymakers still expect at least one additional hike this year. That keeps higher real yields and a stronger-dollar risk in play even as gold attempts to recover.
Technical View
The H2 chart shows a meaningful recovery from the lower trendline structure around 4,260–4,280.
Price has now pushed back above the descending trendline and printed a bullish MSS, which weakens the immediate bearish momentum.
The first important obstacle is the 4,355–4,380 Resistance / Supply Zone. Because price is already testing this area, chasing the rebound offers weaker positioning.
The cleaner bullish location sits lower at the 4,300–4,320 Demand Zone. A controlled pullback into this area followed by bullish rejection, higher-low formation or another MSS would support continuation.
Above current resistance, the next major target is the 4,415–4,435 Major Supply Zone.
If buyers establish acceptance above that structure, the larger recovery objective sits around 4,495–4,510.
Key Zones
Current Price: 4,353.695
Resistance / Supply: 4,355–4,380
Buy Priority / Demand: 4,300–4,320
Major Supply: 4,415–4,435
Upper Supply: 4,495–4,510
Structural Support: 4,234.819
Trading Plan
Buy Priority: 4,300–4,320
Condition: wait for an H2 pullback into demand followed by bullish rejection, liquidity sweep + reclaim, higher-low formation or renewed MSS confirmation.
TP1: 4,355–4,380
TP2: 4,415–4,435
TP3: 4,495–4,510
Invalidation: sustained H2 acceptance below 4,300 would weaken the immediate recovery setup.
Buy/Sell View
The preferred idea is not to chase gold directly into resistance.
A retracement toward 4,300–4,320 would provide a cleaner location to evaluate buyer strength. If demand holds and structure confirms, the recovery can continue toward the higher supply zones.
If demand fails, the bullish recovery thesis should be reassessed rather than forcing another long.
Important Note
The Fed remains hawkish despite the current gold rebound. Lower oil and Treasury yields are helping buyers in the short term, but another rise in yields or renewed dollar strength could quickly cap the recovery.
Final View
Gold is showing an improving H2 recovery after breaking the descending trendline, but price is now testing its first important resistance.
The cleaner scenario is a pullback into 4,300–4,320 followed by confirmed bullish continuation, targeting 4,355–4,380, then 4,415–4,435, with 4,495–4,510 as the larger recovery objective.
Can buyers defend H2 demand before gold expands toward the major supply zone? Long 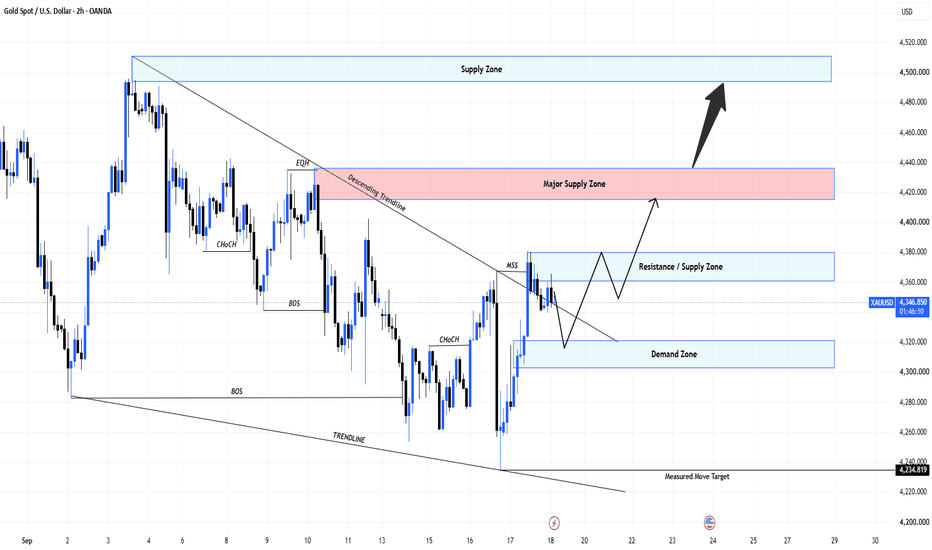
Brent Crude started to roll over - is this a final top?Brent achieved a little over 78.6% retracement of the previous fall from the war peak in oil prices. Recently, I published an ED pattern on Brent that shows a possible top. Brent has the same pattern on the hourly chart, and it has broken down. On the daily chart, this ED is wave 5 of C, which means that this move higher in Oil could technically be coming to an end. The chart below is a daily chart on an arithmetic scale. On this scale, it is also near the top end of a rising channel. At this level, sentiment was 91% bullish, which has now fallen back a bit with prices. Logically, if the wave count is correct, oil prices should slowly keep easing from here for months to come. Similar to what happened after June 2022, when the Russia-Ukraine war was in its 6th month.  Short
Short
Gold After FOMC: The Battle at 4,400–4,420After FOMC, Gold has absorbed almost the entire selling pressure and bounced strongly from 4,234. Buyers have now regained most of their previous position, while M15 & H1 have formed bullish structures.
🔴 Key Decision Zone: 4,400–4,420
This is the final line of defense for sellers.
Rejection: Watch the reaction closely and look for a potential Sell scalp.
Break & Hold: Shift focus to Buy on pullbacks, with potential targets at 4,460 → 4,480 → 4,500 → 4,580 → 4,600.
🟢 Support Levels:
4,340 → 4,305 → 4,260
📌 Today’s Bias:
Prioritize Buy the dip. Sell scalps can still be considered around resistance, but stop looking for Sell setups if price breaks and holds above 4,420.
Market Psychology:
Sellers made a strong effort to keep the bearish move alive after FOMC, but they have not been able to maintain the downside momentum. The key question now is no longer “Can Gold continue lower?” but:
“Can sellers defend 4,400–4,420?”
4,420 is the line that matters. A clean break could mark the beginning of a new bullish wave. Long 
XAUUSD — 4,290 Retest Before the Next Push?
Gold is trading around 4,317 after a strong post-Fed recovery.
M30 structure is improving, but price is still sitting inside a near-term decision area.
A bounce is not enough.
The pullback will tell us more.
The simple read
The key zone today is 4,285–4,298.
If buyers defend this pullback area, Gold may recover toward 4,335 first, then challenge the major resistance around 4,357–4,367.
A clean breakout above that zone could open the way toward 4,396–4,399.
If 4,285 fails, the 4,277 OB becomes the next support.
Key price zones
4,285–4,298 — key pullback zone
4,277 — OB support
4,357–4,367 — major resistance
4,396–4,399 — upper target
4,236–4,245 — major support
The recovery structure is improving, but I prefer the pullback rather than chasing price.
Can 4,290 hold and send Gold toward 4,36x? Long 
XAUUSD — Post-Fed Bullish RecoveryMarket Pulse
Gold is recovering strongly after the Fed raised rates by 25 bp to 3.75%–4.00%. The Fed still sees room for another hike this year, which keeps the medium-term rate backdrop restrictive. However, Gold has gained more than 1% today as the U.S. dollar eased from a seven-week high and oil prices moved lower.
Short-term Treasury yields remain elevated, so the recovery may stay volatile even if buyers keep control.
What the Chart Says
XAUUSD has made a strong bullish recovery on H1 after the sharp Fed-driven sweep toward the 4,260 area.
Price reclaimed 4,300, pushed through the 4,330–4,345 zone, and has now broken above the previous CHoCH around 4,365.
That shift shows buyers have regained short-term control.
Gold is currently trading near 4,370, so chasing the move higher is less attractive. A controlled pullback could give a cleaner continuation setup.
The first area I am watching is 4,330–4,345. If buyers defend this zone, price may continue toward the upper 4,388–4,398 resistance area.
A deeper correction could reach 4,295–4,305, which remains the stronger demand zone below.
Levels That Matter
4,388–4,398 — Main resistance
4,365–4,370 — Breakout structure
4,330–4,345 — First support / retest zone
4,295–4,305 — Main demand zone
4,260–4,270 — Post-Fed swing low
My Main Plan
The main plan is bullish.
I prefer waiting for a pullback toward 4,330–4,345 rather than buying after the current expansion.
If this zone holds and bullish confirmation appears, Gold could continue toward 4,388–4,398.
A deeper pullback toward 4,295–4,305 could still keep the recovery structure valid if buyers return there.
What I Need to See
I want price to hold above the reclaimed structure and continue forming higher lows.
A sustained H1 move below 4,295 would weaken the immediate bullish recovery idea and increase the risk of another deeper correction.
Final Read
The H1 picture has improved sharply after the post-Fed liquidity sweep.
For now, buyers have the short-term advantage, but Gold is already extended from the lows. I prefer waiting for the pullback and bullish confirmation rather than chasing price near resistance. Long 
XAUUSD — Post-Fed FVG Repricing Buy Setup
Gold is trading around $4,320 after a highly volatile post-FOMC session. The Fed raised rates by 25 bp to 3.75%–4.00% and signaled that additional tightening may still be needed, pushing the U.S. dollar to a seven-week high and lifting short-term Treasury yields. Despite that hawkish backdrop, Gold recovered more than 1% from the post-Fed low as traders reassessed positioning and oil prices eased from recent highs.
Brent crude has also pulled back toward $104, reducing some of the immediate energy-driven inflation pressure, although broader Middle East risks remain elevated.
SMC View
H1 price remains inside the broader descending channel, so the higher-timeframe structure is not fully bullish yet. However, the latest move swept buy-side liquidity near $4,350–$4,360, delivered a strong bearish displacement, and then reacted sharply from the lower portion of the channel.
The current rebound may represent bullish repricing after that liquidity event. The nearby FVG around $4,285–$4,305 is the key mitigation area to watch.
A controlled pullback into this imbalance, followed by a bullish MSS or CHOCH, could confirm that buyers are rebuilding short-term order flow toward the upper liquidity zones.
Main Trading Scenario
Buy Priority: $4,285–$4,305
Condition: Wait for Gold to retrace into the FVG / discount area and form bullish rejection, followed by a lower-timeframe bullish MSS or CHOCH.
Entry: $4,285–$4,305 after confirmation
SL: Below $4,260 and the reaction low
TP1: $4,345–$4,365
TP2: $4,390–$4,405
Key Zones to Watch
$4,401.403 — Premium Bearish OB
$4,345–$4,365 — Reclaimed buy-side liquidity / resistance
$4,285–$4,305 — Main FVG buy zone
$4,225–$4,245 — External SSL / Deep Discount Demand
$4,260 — Immediate bullish invalidation area
Descending channel resistance — Major structural barrier
Prime Gold View
The buy bias is focused on confirmed repricing from the FVG, not chasing the current recovery.
If buyers defend $4,285–$4,305 and produce a clean bullish structure shift, Gold could rotate back toward $4,350–$4,365, with the $4,400 Premium Bearish OB becoming the larger upside objective.
The broader channel remains bearish, so confirmation is essential before treating the recovery as sustainable.
No confirmation, no trade. Long 
Gold rises vs Fed — FOMO or liquidity trap?Gold is showing a strong technical rebound despite the bearish macro backdrop, recovering from the 4,250–4,280 area and pushing back toward 4,390–4,400. However, the broader H4 structure has not yet changed: price remains inside the descending channel and is approaching the upper trendline. This makes the current rally an important test rather than a confirmed bullish reversal.
The interesting part is the divergence between macro narrative and short-term price flow. The Fed delivered a 25bp rate hike and maintained a relatively hawkish stance, while the latest U.S. jobless claims also showed a resilient labor market. Normally, this combination should create pressure on Gold. However, Treasury yields subsequently pulled back, the USD weakened, and oil prices eased as concerns over supply disruptions diminished. These moves helped Gold rebound more than 2% on Thursday.
From the institutional-flow perspective, this is exactly why FOMO should be avoided. Gold is rising, but the rally is occurring into a major technical resistance area while the broader H4 structure remains bearish. If price reaches 4,400–4,420 and fails to break the descending trendline, this rebound could become another liquidity trap before sellers return.
Bearish Scenario — Preferred Bias
If Gold is rejected around 4,390–4,420 and fails to break the descending trendline, sellers could regain control and push price back toward 4,330–4,350, followed by the 4,260–4,280 Supply zone.
The ideal setup is therefore not to chase the current rally, but to wait for rejection and confirmation before following the bearish flow.
Bullish Scenario
If buyers can produce a clean H4 close above the descending trendline and hold above 4,420, the bearish structure would begin to weaken. In that case, Gold could extend toward 4,450–4,480.
For now, the market is giving us an important message: Gold can rally even when the headline macro narrative looks bearish if USD and yields reverse lower. Therefore, the next move should be judged by the interaction between price and the trendline, rather than simply assuming that the Fed hike must immediately push Gold lower.
KEY LEVELS:
🔴 4,390–4,420 — Descending trendline / key resistance
🔴 4,450–4,480 — Major recovery zone
🟢 4,330–4,350 — Near-term support
🟢 4,260–4,280 — Major Supply / downside target
BIAS: BEARISH — NO FOMO. WAIT FOR REJECTION AT THE TRENDLINE OR A CONFIRMED BREAKOUT.
The question now is not “Gold is going up, should we buy?” — but “Is this a genuine structural breakout, or liquidity being built before the next sell-off?” Short 
XAUUSD 4384 recovery — 4475 is the trap XAUUSD 4384 recovery — 4475 is the trap
Gold is trying to breathe again.
After the heavy selloff into the 4,235 area, price finally found a reaction base and started pushing back above the old sellside liquidity zone. That recovery matters. Sellers did not get a clean continuation lower, and buyers are now trying to rebuild structure around 4,350 - 4,385.
But I still don’t see a clean bullish market yet.
Price is sitting under the next liquidity pocket, and the chart is showing a possible recovery into resistance first, not a free breakout. The first key level is 4,422. If gold can reclaim that area, the next draw is 4,475 — and that is where I would start paying close attention.
Why?
Because 4,475 is not just a target. It is also a trap zone.
That area sits above recent buy-side liquidity, and if price runs into it while traders chase late buys, sellers may use that move as a better short entry. With market caution still strong after the Fed decision, plus oil and geopolitical headlines creating unstable flows, gold can spike first and reverse fast.
Main bias: short-term recovery while gold holds above 4,300 - 4,330.
But the bigger structure still needs confirmation. A push into 4,422 - 4,475 can happen, but I don’t want to chase the move after it is already extended.
Trading scenario:
Buy idea only if gold holds above 4,330 and breaks 4,422 with clean candles.
Entry zone: 4,350 - 4,422 after confirmation
Deeper buy zone: 4,300 - 4,330 if price sweeps and reclaims
Stop loss: below 4,280
TP1: 4,422
TP2: 4,475
Sell reaction only if gold reaches 4,475 and rejects hard.
Sell zone: 4,422 - 4,475 after rejection
Stop loss: above 4,500
TP1: 4,350
TP2: 4,300
TP3: 4,260 if bearish momentum returns
No reclaim, no chase.
No rejection, no sell.
If gold breaks below 4,280 with pressure, the recovery idea is cooked. Then sellers can target the lower liquidity again.
For now, I’m reading this as a recovery from the 4,235 low, but 4,475 is where the real test begins.
You think gold grabs 4,475 first, or rejects before touching the trap?
Long 
XAUUSD Bearish SetupThe previous bullish setup did not trigger, as Gold failed to break our key resistance level. The descending trendline continues to act as a strong dynamic resistance, and the potential breakout structure has now failed.
Since forming the high of 4,694.26 on 25 August 2026 , Gold has been respecting a clear Lower High (LH) and Lower Low (LL) structure on the 4H timeframe.
For me, the bullish case is therefore not ready yet. If Gold wants to make a meaningful bullish reversal, I would like to see a 4H bullish divergence first — and that divergence is still due.
📉 Current Structure
The price is compressing toward the downside, while the descending trendline continues to cap the upside.
Rather than anticipating a reversal, I will look to play the 4H FVGs and let price come to my predefined entry.
🎯 Trade Setup
I will place two Buy Stop orders at the same entry level:
Buy Stop: 4,372.62
Stop Loss: 4,442.49
Trade 1
🎯 TP1: 4,283.89
Trade 2
🎯 TP2: 4,161.89
Once TP1 is hit, I will move the SL of the remaining trade to Breakeven and let the second position run toward TP2.
⚠️ Important
This is not a blind bullish call. The current 4H structure remains bearish, and the previous bullish breakout setup has already failed.
My approach here is to use the FVG entry + predefined risk, while waiting for the market to confirm whether the larger reversal is actually developing.
4H LL/LH structure remains intact → bullish divergence still due → watching the FVG for the next setup. Short 
XAUUSD | 1H 18 Sep 2026, MARKET ANALYSIS — Disciple-FX
XAUUSD | 1H 18 Sep 2026, ~09:36 IST
Educational/analytical purposes only — not financial advice.
Market Structure
Current structure: Bullish recovery inside a bearish channel.
Price rebounded strongly from the 4,250–4,275 demand zone.
The rally produced a visible CHOCH around 4,360–4,375.
Price is now consolidating around 4,355–4,365 underneath the bearish channel.
The larger visible structure still has significant overhead supply.
Key point: bullish momentum is developing, but confirmation above the upper supply/channel area is still needed.
Key Levels
Level Role
4,400–4,410 Major supply / resistance
4,375–4,400 Bear-channel + supply area
4,350–4,365 Current price / CHOCH area
4,325–4,345 FVG / reaction zone
4,300–4,325 Key zone + liquidity
4,250–4,275 Strong demand
Liquidity Zones
Buy-side liquidity: above 4,375–4,400, particularly around previous swing highs.
Sell-side liquidity: below 4,325, then around 4,300–4,275.
The 4,300–4,325 key zone is particularly important because it can act as a liquidity-reaction area.
BOS / CHOCH / FVG / Order Blocks / Sweeps
CHOCH: Visible near 4,360–4,375, showing a short-term shift from the preceding bearish movement.
BOS: Earlier bearish BOS levels remain visible toward 4,250–4,325, while the latest recovery has not yet produced a decisive higher-timeframe bullish break of the major supply.
FVG: Approximately 4,325–4,350. This is the nearest visible imbalance/retest area.
Order Block / Demand: 4,250–4,275 represents the strongest visible demand region.
Liquidity sweep: The sharp selloff into approximately 4,250–4,260, followed by aggressive recovery, resembles a sell-side liquidity sweep/rejection from the demand area.
Hypothetical Trade Setups
🟢 BUY Scenario
Entry: 4,330–4,350
Prefer a bullish rejection/reclaim of the FVG rather than buying blindly.
SL: 4,320–4,325
TP1: 4,375
TP2: 4,400
TP3: 4,435
Invalidation: sustained price acceptance below 4,300.
SELL Scenario
Entry: 4,380–4,400
Only if price reaches supply and shows bearish rejection/CHOCH confirmation.
SL: 4,410–4,420
TP1: 4,350
TP2: 4,325
TP3: 4,300
Invalidation: strong bullish acceptance above 4,400–4,410.
Pip note: XAUUSD pip conventions vary by broker. If your platform treats 1 pip = $0.01, then 50–100 pips = $0.50–$1.00. Adjust the actual SL to your broker's convention and volatility rather than forcing an SL that is too tight.
Risk : Reward
Using the zones above, the setups can potentially offer approximately 1:2 to 1:4+, depending on exact confirmation and entry. Calculate R:R from your actual fill price and stop—not from the chart's idealized level.
Technical Probability
These are subjective chart-structure estimates, not statistical probabilities or predictions:
Bullish continuation: ~55%
Bearish rejection: ~45%
The balance changes materially if price decisively breaks 4,400 or loses 4,300.
Retail Trap Areas
⚠️ Potential long trap: buying aggressively into 4,375–4,400 supply without confirmation.
⚠️ Potential short trap: selling directly into 4,325–4,300 support/liquidity after the recent bullish recovery.
The cleaner approach is to wait for liquidity → reaction → confirmation.
Beginner-Friendly Explanation
Think of the chart as:
Demand → strong bounce → CHOCH → FVG → resistance/supply.
Price has already bounced from demand and is currently approaching an area where sellers previously appeared.
So instead of chasing the current candle:
Above 4,400: bullish structure gets stronger.
4,325–4,350: watch for a bullish retest.
4,300: important structural support.
Below 4,300: bullish recovery becomes questionable.
4,250–4,275: major visible demand.
FINAL VERDICT
WAIT — confirmation required
Chart-structure confidence: 65/100
The chart currently sits between the bullish recovery zone and major overhead supply. The cleaner SMC approach is to wait for either:
BUY confirmation: FVG/demand reaction + bullish structure confirmation.
SELL confirmation: rejection from 4,375–4,400 + bearish confirmation.
Educational only — not financial advice. Trading carries risk.
If price stays above 4,300, my bias remains bullish; if price breaks and holds below 4,300, the bullish bias weakens and bearish structure becomes more relevant. Long 
Silver Weekly Analysis [21 Sep - 25 Sep, 2026]Probable Scenario Analysis of Silver TVC:SILVER for the week (21 Sep - 25 Sep, 2026).
⏺ Present Scenario:
Silver (XAGUSD) TVC:SILVER is undergoing a contraction phase. The range (67.5 - 62.5) has been the contraction region. A breakout or breakdown from the range would ensure a strong trend. Broadly, the view is indecisive to bearish unless a true bullish trend is established . A strong bullish move is only possible above 70. A strong bearish move is only possible below 60.
🟢 Bullish Scenario
If the price sustains above 67.5, then a weak bullish target would be 70. There will be strong resistance at 70. Next, if the price breaks out above 70, then strong bullish moves might be observed. The probable strong bullish targets above 70 would be - 72.5, 75, 77.5, and 80.
🔴 Bearish Scenario
Presently, an indecisive to bearish setup is active. Stay bearish below 65. A strong support zone (SSZ) is established in the region (65 - 62.5). A decisive breakdown below 62.5 would trigger a bearish trend. The first bearish target below 62.5 would be 60. There will be strong support at 60. Next, if the price breaks down below 60, then strong bearish moves might be observed. The probable strong bearish targets below 60 would be - 57.5 and 55.
🟡 No Trading Zone: (67.5 - 62.5).
⏺ Range of Consolidation (ROC): (70 - 60).
Here, 65 is the median of the ROC. The median works like a trading session sentiment evaluator. The price trading above the median would offer bullish sentiment, while the price trading below the median would trigger bearish sentiment within the ROC.
● Events (🔵 Low Impact, 🟠 Medium Impact, 🔴 High Impact):
- 21 Sep (Mon): FOMC Member Goolsbee Speaks (04:00 PM IST, 🔵 Low Impact).
- 22 Sep (Tue): ADP Weekly Employment Change (05:45 PM IST, 🔵 Low Impact). FOMC Member Williams Speaks (07:35 PM IST, 🔵 Low Impact).
- 23 Sep (Wed): Flash Manufacturing PMI (07:15 PM IST, 🔵 Low Impact). Crude Oil Inventories (08:00 PM IST, 🔵 Low Impact).
- 24 Sep (Thu): FOMC Member Williams Speaks (01:40 PM IST, 🔵 Low Impact). Unemployment Claims (06:00 PM IST, 🟠 Medium Impact). FOMC Member Paulson Speaks (07:40 PM, 🔵 Low Impact). Natural Gas Storage (08:00 PM, 🔵 Low Impact).
- 25 Sep (Fri): Durable Goods Orders m/m (06:00 PM, 🔵 Low Impact). Revised UoM Consumer Sentiment (07:30 PM IST, 🟠 Medium Impact). FOMC Member Hammack Speaks (11:30 PM, 🔵 Low Impact).
● Intraday, Weekly, and Monthly Bias
Establish bias with respect to the opening price (of the particular session - Intraday, Weekly, and Monthly). If the price sustains above the opening price, then don't think of shorting. Look for bullish trades only. On the contrary, if the price sustains below the opening price, then don't think of going long. Look for bearish trades in that case.
● Disclaimer + End Note
- All the analyses would fail in the case of a major gap up, gap down, or price structure anomaly. Thus, practice PRAGMATISM in the live session.
- Trade only if there is a set-up. Remember, not trading is an extension of the trading activity.
- Mark your points. Trade your points. Price is GOD. Anything can happen in the markets. Thus, trade what you see, not what you believe.
- Always PRACTICE RISK MANAGEMENT. Always PROTECT YOUR CAPITAL. Be RESPONSIBLE.
- Be Strategic. Be Courageous. Be Patient. Be Wise.
- Every day is a new day. Thus, do not carry the baggage of past successes or failures. Leave the gardens of winning and losing. Establish yourself in equanimity. Always think from a new perspective.
- Let the joy of trading drive your effectiveness, not greed or fear. Believe in Possibilities.
Happy Trading!  Short
Short
GOLD (XAUUSD) – WEEKLY FIBONACCI ANALYSISBased on the Fibonacci levels marked on your chart, Gold is currently around $4,378, positioned between the 0.786 and 0.618 Fibonacci retracement levels.
🔎 Current Structure
Gold made a strong advance and then entered a correction. The price is now recovering from the $4,000–$4,200 region and is holding above the 0.786 Fib at $4,297.
However, the 0.618 level at $4,576 is the immediate hurdle. The descending trendline shown on your chart is also approaching this area, making $4,576–$4,600 an important confirmation zone.
🟢 Bullish Scenario
A sustained weekly move above $4,576 could open the way toward:
$4,727 → $4,968 → $5,210
The $4,727 (0.5 Fib) level would be the next major resistance after $4,576.
🔴 Bearish Scenario
If Gold gets rejected around $4,576 and falls below $4,297, the correction could extend toward:
$3,942 (Fib 1.0)
A decisive break below $3,942 would significantly weaken the current recovery structure and bring the $2,916 (1.618 extension) into the longer-term Fibonacci picture.
📈 Momentum
RSI is around 50, which is essentially neutral. This means momentum has recovered from the previous weak zone but has not yet established strong bullish momentum.
🎯 My chart-based setup
Bullish confirmation: Weekly close above $4,576
Upside levels: $4,727 → $4,968 → $5,210
Key support: $4,297
Major support: $3,942
So, from the Fibonacci perspective, $4,297–$4,576 is the key decision zone. Holding $4,297 keeps the recovery structure intact, while reclaiming $4,576 would provide stronger bullish confirmation.
💬 Like • Comment • Follow for more setups!
DISCLAIMER:
For educational and informational purposes only. This is my personal technical analysis, not financial or trading advice or a recommendation to buy/sell. Do your own research before trading. Markets involve substantial risk, and all levels, targets and setups are illustrative and not guaranteed. Trade with proper risk management and never rely solely on this analysis.
Trade with logic. Risk with discipline.
Logic Trade Room Long 
 Short
Short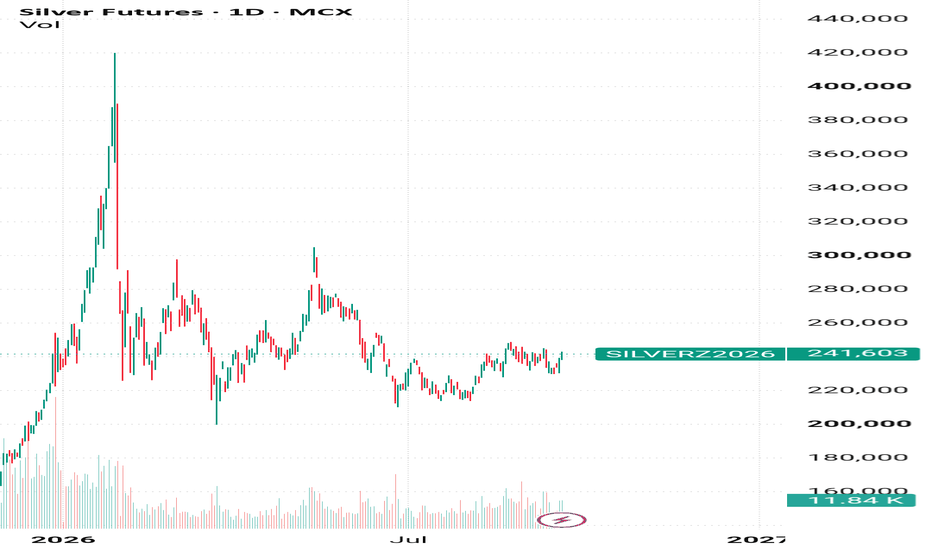
XAUUSD — 4,500 Is the Real Test XAUUSD — 4,500 Is the Real Test
Gold is trying to recover, but this is not the type of chart where I want to get emotional too early.
After the strong selloff from the late-August high, price broke the clean bullish structure and started building a wider bearish correction. That bigger damage is still there. But now gold is holding around the 4,350 area, and more importantly, price closed back above the 100-day SMA zone near 4,320. That tells me buyers are not fully gone yet.
The macro side also supports this pause. USD is trading more quietly as oil prices and US Treasury yields ease, while RSI on the daily chart is sitting in a more neutral zone. In simple words, sellers still have the bigger structure, but they are not pushing with the same strength right now.
From an SMC view, the current recovery looks like a move from the bullish OB / demand area around 4,250 - 4,290. As long as price holds above 4,320 - 4,330, I think gold can continue climbing toward the internal supply and bearish mitigation block around 4,460 - 4,500.
But here is the trap: a push into 4,480 - 4,500 does not automatically mean gold is bullish again. That area is exactly where sellers may try to reload. It is also close to the previous broken structure, so late buyers can easily get caught if price rejects there.
My main view is short-term bullish recovery while gold holds above 4,320, but I will treat 4,460 - 4,500 as the real decision zone. If buyers reclaim that area cleanly, gold can open a wider recovery toward 4,600 - 4,635. But if price rejects from there, the market may rotate back down toward 4,300 and possibly 4,250 again.
Key Price Zones to Watch
Current reaction area: 4,350 - 4,365
Main support / 100-day SMA area: 4,320 - 4,330
Bullish OB / demand zone: 4,250 - 4,290
Internal supply / bearish mitigation block: 4,460 - 4,500
HTF bearish OB: 4,630 - 4,690
Major downside support: 4,030 - 4,060
Bullish confirmation: clean reclaim above 4,500
Bearish rejection signal: failure around 4,460 - 4,500
Invalidation for recovery: clean break and hold below 4,320
Do you think gold can reclaim 4,500, or is this recovery only setting up another sell reaction from supply?
Long 
Pullback Before Another BSL TestFundamental Analysis
Gold is holding firm after posting its first weekly gain in four weeks, helped by easing oil prices and some reduction in inflation pressure. However, the U.S. dollar remains near a seven-week high, Treasury yields are around 5%, and markets still price roughly a 55% chance of another Fed hike in October.
Technical Analysis
On H1, Gold remains constructive after the recent bullish BOS, but price is now approaching the 4,395–4,410 BSL / major resistance.
The cleaner continuation setup is a controlled pullback into the 4,348–4,368 OB + Fibo zone. If buyers defend this area, the next bullish wave could retest upper liquidity.
Volume Profile also shows an important lower balance area around 4,300–4,318 POC.
Important Key Levels
4,395–4,410 — BSL / Major Resistance
4,348–4,368 — OB + Fibo
4,300–4,318 — POC
4,235–4,250 — SSL / Major Support
Trading Scenario
Buy priority remains on a pullback into 4,348–4,368 followed by bullish H1 confirmation.
Target: 4,395–4,410 BSL.
Invalidation: H1 acceptance below the OB + Fibo zone.
Overall View
The short-term structure remains constructive, but buying directly below BSL offers less attractive positioning. A pullback into support could provide the cleaner continuation setup.
Will Gold retest the OB + Fibo first before breaking 4,400? Long 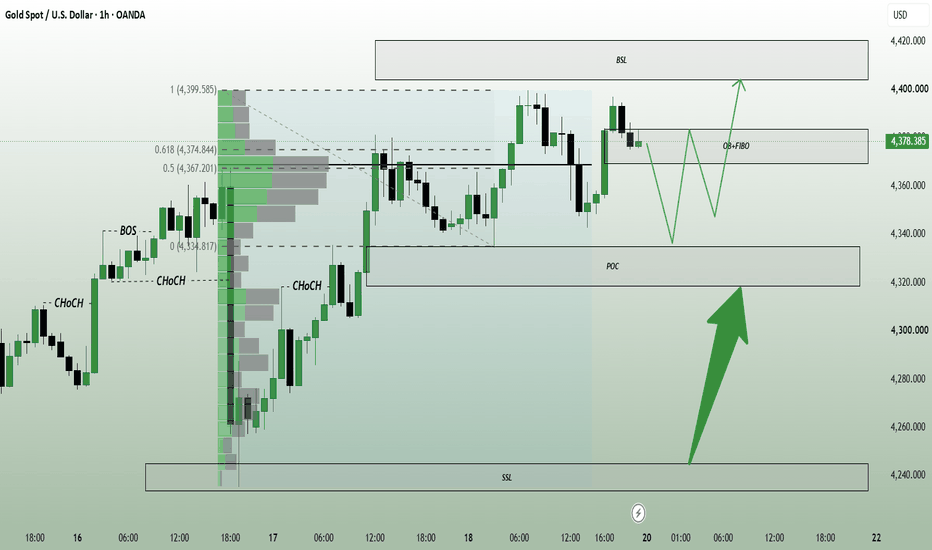
Long 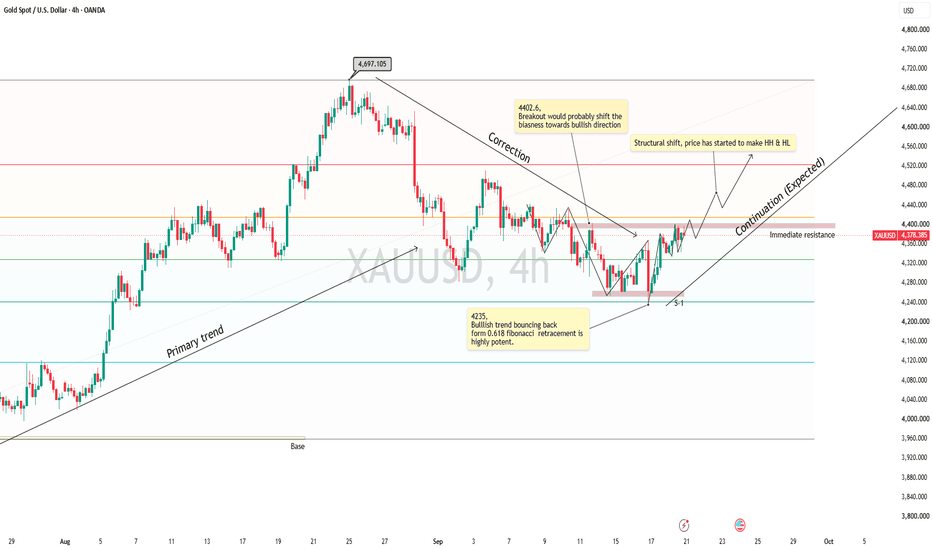
XAUUSD: Recovery Is Here, But 4,445 Is the Trap Zone XAUUSD: Recovery Is Here, But 4,445 Is the Trap Zone
Market Context
Gold is holding its recent recovery from the six-week low around 4,235, but the market is still cautious near the end of the week.
The US Dollar is trading quietly as oil prices and Treasury yields cool down, helping gold recover in the short term. Gold also closed above the 100-day SMA around 4,320, while the daily RSI remains neutral.
This tells us one thing: buyers are reacting, but they have not fully taken control yet.
Technical Structure
Gold is recovering into a sensitive resistance area after the strong rebound from the weak low.
Price is currently trading around 4,390 - 4,395, approaching the Main Sell Reaction Zone and LTF Supply area. This is where short-term buyers may start facing pressure again.
The key resistance zone is 4,420 - 4,445. This area overlaps with HTF Supply and the Major Premium POI, which makes it an important sell reaction zone. If gold pushes into this area and gets rejected, bearish pressure may return quickly.
Above that, 4,488 is the key liquidity reference. A clean break above 4,488 would weaken the bearish setup and open the door for a stronger recovery.
Below current price, 4,350 - 4,360 is the first reaction support. If gold loses this area, the next downside risk may return toward 4,280 and potentially the 4,235 weak low.
Key Levels
Current Price: 4,393
Main Sell Reaction Zone: 4,420 - 4,445
LTF Supply / Internal Bearish POI: 4,350 - 4,390
Key Liquidity Level: 4,488
First Support: 4,350 - 4,360
Weak Low: 4,235
Bullish Recovery Confirmation: Above 4,488
Bearish Pressure Zone: Below 4,420 - 4,445
Trading Plan
Primary Sell Scenario
Entry: 4,420 - 4,445 after bearish confirmation
SL: Above 4,488
TP: 4,360 / 4,320 / 4,280
Condition: Price recovers into the HTF Supply zone but fails to break higher. A rejection from this area would suggest sellers are still defending the premium zone.
Short-Term Buy Continuation Scenario
Entry: Above 4,445 after breakout and retest
SL: Below 4,390
TP: 4,470 / 4,488 / 4,520
Condition: Buyers must break through the Main Sell Reaction Zone and hold above it. Without acceptance above 4,445, the recovery remains vulnerable.
Support Reaction Scenario
Entry: 4,350 - 4,360 after bullish confirmation
SL: Below 4,320
TP: 4,390 / 4,420 / 4,445
Condition: Gold must show a clean reaction from the first support area. This is only a recovery setup unless price breaks above 4,445 with strength.
Breakdown Sell Scenario
Entry: Below 4,350 after breakdown and retest
SL: Above 4,390
TP: 4,320 / 4,280 / 4,235
Condition: Gold loses the recovery base and fails to reclaim it. This would expose lower liquidity again and keep the bearish structure active.
Overall Bias
Gold is recovering, but the recovery is moving directly into a dangerous supply zone.
The market may look bullish in the short term, but 4,420 - 4,445 is the real test. If buyers cannot break this area, sellers may use the recovery as another opportunity to push price lower.
Above 4,488, the bearish view starts to weaken. Below 4,350, the recovery loses strength and downside risk returns.
Best approach: do not chase the rebound late. Wait for either a confirmed rejection from 4,420 - 4,445 or a clean breakout above 4,488.
Will gold break through the premium supply zone, or will sellers turn this recovery into another trap?
Long 
Weekly Analysis - GoldHi Friends, here is detailed weekly analysis.
### Monthly View
The previous monthly candle closed with a positive bias, breaking above the monthly bearish FVG and subsequently inverting it. The resulting iFVG is currently acting as support. On Friday, price reacted precisely from the **CE of the monthly FVG**, indicating strong technical confluence at this level.
Weekly View
Price has formed a Dragonfly candle right at the iFVG area, creating a Turtle Soup setup at the nearest swing level. This is a positive sign for Gold. If price breaks the previous week’s high with conviction, we may witness a strong bullish move.
Daily View
From Monday to Wednesday, price remained bearish, with rejection at the previous week’s low. Wednesday was a good reversal day, where price formed a Turtle Soup setup, followed by a strong upside move on Thursday and Friday.
The move also coincided with major news events, and it appears price was holding the level ahead of these events.
On the daily timeframe, price has now closed above the trendline. If price breaks the current high in the coming week, the breakout could push price toward the next Daily bearish FVG.
Please do follow me if you liked the idea💡...
Disclaimer ⚠️: This analysis is for educational purposes only and does not constitute investment advice. Please do your own research (DYOR) and check with your financial advisor before making any trading decisions. 📚💰
XAUUSD — 4400 Is the Trap Zone XAUUSD — 4400 Is the Trap Zone
Gold gave us a messy week, but the story is actually pretty clear.
Earlier in the week, sellers were in control after price failed to hold the higher range. Every bounce was getting sold, and gold kept drifting lower toward the discount area. Then we saw the market defend the 4,235 - 4,280 zone, which created that short-term recovery into the end of the week.
But here is the part I don’t want to ignore.
This recovery is now pushing directly into a bearish mitigation area around 4,390 - 4,410. That is where trapped buyers from the previous breakdown may meet sellers again. Above that, the stronger HTF supply zone sits around 4,445 - 4,465. So even though gold bounced well from the lows, the bigger structure is still not fully repaired.
In simple SMC language: gold swept lower liquidity, bounced from discount, and is now retesting a zone where sellers may defend the trend.
The current price around 4,378 is sitting in the middle. Not cheap enough to buy. Not high enough to sell blindly. This is why patience matters here.
My main view is still bearish while gold stays below 4,410 - 4,465.
If price rejects from the bearish mitigation zone, I would expect a pullback toward the Bullish OB around 4,295 - 4,310. That zone is important. If buyers defend it, gold can build another bounce. But if price breaks below that OB, the next sell-side liquidity around 4,260 - 4,235 becomes exposed again.
For bulls to take real control, gold needs to break above 4,465 and hold. Without that, any move into supply still looks like a possible trap.
Key price zones to watch
Current price area: 4,378
Bearish mitigation zone: 4,390 - 4,410
HTF supply zone: 4,445 - 4,465
Main reaction support: 4,295 - 4,310
Lower sell-side liquidity: 4,260 - 4,235
Bullish confirmation: clean break above 4,465
Invalidation for bearish view: strong close above 4,465
For now, I’m reading this as a recovery into resistance, not a clean bullish reversal yet.
Do you think gold rejects from 4,400 first, or pushes into the HTF supply before dropping?
Short 


