$4,318 IS HERE — WILL GOLD CRASH AGAIN OR TRAP THE SELLERS?After seeing the selling on Tuesday, the confidence of many buyers in the market has clearly gone down. A lot of people who were sitting with a buying bias are now changing their bias toward selling. At the same time, there are still some buyers who are holding onto their last hope of a recovery.
So because of this, tomorrow is going to be quite interesting.
Gold has now reached an important key area, which is around $4,318. As you know, this was the same area from where we saw strong upside momentum in Gold during the month of August. So keeping that previous reaction in mind, there is a good possibility that we may see some important price reaction or psychological reaction around this area tomorrow.
But the biggest question is, after the continuous selling we have seen in Gold for the last two days, will the same selling continue tomorrow and will Gold finally break down the important $4,318 level?
Or can Gold show a short-term reversal from here?
And is it possible that this short-term reversal can actually turn into a genuine bigger reversal, which can take Gold significantly higher again?
So let's talk about what can actually happen.
### 🧠 Understanding the Recent Selling
The most important thing is that we have seen continuous selling in the market since Friday, and that selling has been quite straight.
We haven't really seen any proper liquid buying movement during this decline.
Whenever we see this kind of strong one-sided selling momentum, the market often moves by hunting the stop losses that are already available in the market.
So the traders who were taking fresh intraday buying positions also got trapped, while many of the previously available stop losses were also taken out during this move.
Now, after seeing this kind of selling for the last few sessions, traders have become much more cautious.
And that's one of the reasons why we started seeing some slowness in the New York session on Tuesday.
Keeping all of this in mind, Wednesday's plan becomes quite interesting.
### 🔥 $4,400 Breakdown Is Important
Look at what happened today.
The $4,400 level broke, and at the same time, Monday's low also broke.
So when you combine the breakdown of Monday's low with the breakdown of the important psychological level of $4,400, there is no doubt that the overall short-term structure is bearish.
And obviously, after seeing this breakdown, a lot of random sellers have jumped into the market.
But now Gold has reached an important key support area.
So at this point, psychology becomes extremely important.
From a psychological point of view, there is a possibility that Gold can respect the $4,400 level for the short term and slowly start moving back toward the upside in a zigzag manner.
### 🎯 My Focus: Trap the Late Sellers
One of my main focuses for tomorrow will be the sellers who entered below $4,400, especially the traders who entered around $4,390.
Why?
Because $4,400 was an important psychological level and we already got a sharp breakdown from this area during the London session.
At the same time, Monday's low was also broken.
So naturally, many traders have already entered selling positions.
And when a large number of traders enter late into selling after a major breakdown, the market can sometimes use those positions as liquidity.
This is why I am expecting the possibility of an upside move tomorrow that can trap these random late sellers.
If that happens, two things can happen at the same time.
First, the late sellers who entered around $4,390 and below $4,400 can get trapped.
Second, if Gold starts showing a strong reaction around $4,318, buyers who have been scared after watching the last two or three days of selling may again start thinking that buyers are becoming active.
They may start believing that a bigger reversal can come from this area.
And that can bring fresh buying into the market.
### 📌 My Wednesday Plan
My plan is going to remain quite simple.
I will focus on buying as long as Gold is holding above **$4,318**, and more importantly, above **$4,300**.
For tomorrow, I will treat every intraday low as a potential support area.
A lot of traders will try to find pullbacks to sell because the overall structure is bearish.
But according to the psychology I am seeing, some of these sellers can get trapped.
Remember what happened with the buying move we saw around August 19.
A lot of traders were looking for a retracement or support based on that previous buying volume.
But I had already explained that, according to the structure and psychology of the market, Gold could break $4,400.
I also gave the $4,346 level as a downside target, and today we saw that target getting achieved.
So I hope whoever followed my Tuesday analysis was able to understand the move and make some good profit from it.
### ⚠️ Don't Buy Aggressively
Now, one very important thing.
I am expecting a short-term reversal from the current area, and this reversal can potentially take Gold back toward **$4,400**.
But that doesn't mean you should start buying aggressively.
The reason is simple.
This support area can be tested multiple times tomorrow.
So just because Gold reacts once from $4,318 doesn't mean that a major bullish reversal has already started.
We need to watch the price action and see how the market behaves around these important levels.
For me, the psychology is simple:
**Above $4,318 → Buying remains the main focus.**
**Above $4,300 → Short-term bullish reversal remains valid.**
**Below $4,300 → We need to reassess the entire psychology.**
The objective is not to blindly predict the bottom.
The objective is to understand whether Gold is actually trying to trap the late sellers and whether genuine buyers are coming back into the market.
### 🚨 Final View
After two consecutive days of strong selling, fear has clearly entered the buying side.
And whenever one side of the market becomes too fearful or too confident, that's when things can become interesting.
So tomorrow, the main battle can be between late sellers who are expecting another downside move and buyers who are waiting around the **$4,318–$4,300** area.
If buyers successfully defend this area and Gold starts moving higher, trapped sellers can provide additional upside liquidity and we may see Gold moving back toward **$4,400**.
But again, this is a short-term reversal expectation.
Don't become aggressively bullish just because the market reaches support.
Wait for the price action, manage your risk properly, and don't forget your money management.
Good luck for Wednesday. I hope you all have a profitable and disciplined trading day.
And tell me in the comments — **what is your plan for Gold on Wednesday? Are you looking for buying around $4,318, or do you still expect another downside move?**
Trading Masterclass #1Institutional trading means trading like hedge funds, banks, prop firms, and professional desks. They do not trade based on emotions, random tips, or gambling. They use systems, probabilities, risk control, position sizing, discipline, and psychology.
Retail traders often lose because they focus only on “entry.” Institutions focus on:
Risk Management
Capital Protection
Position Sizing
Probability
Psychology
Consistency
Repeatable Edge
In options trading, if you think like institutions, your results can improve significantly
 Education

 Education

XAUUSDDescription:
Technical Analysis & Overview
Instrument: XAUUSD (Gold Spot / U.S. Dollar) — Daily Timeframe (OANDA)
Current Price: ~$4,454.99 (-3.20% drop on the day)
Market Structure: Following a recent pullback from local peaks, gold is consolidating within a macro trading range between key upper resistance and lower support levels.
Key Technical Levels
Primary Resistance / Sell Zone: $4,902.38 (Upper range boundary and key supply area)
Current Trading Zone: ~$4,450.00 – $4,550.00
Primary Support / Buy Zone: $4,357.67 (Lower range demand zone)
Major Range Low: $3,942.10
Trading Scenarios & Strategy
Bullish Scenario (Buy at Support): A disciplined entry near the $4,357.67 support zone, looking for confirmation of buyers stepping in before targeting a bounce back toward upper resistance levels.
Bearish Scenario (Sell at Resistance): If price rallies back up toward the $4,902.38 resistance zone, look for reversal price-action setups to take short positions back down toward range support.
Breakout Watch: A decisive daily candle close below $4,357 could signal further downside extension, while a close above $4,902 would reignite the multi-month uptrend , if breake above will see new all time high.
Disclaimer: This post is for educational and informational purposes only and does not constitute financial or trading advice. Always apply strict risk management and position sizing. Long 
XAUUSD: Which Team Were You On During This 700-Point Move?Looking at this chart, some people see candlesticks. Some see trendlines, support, and resistance. Some just see a headache. But when I look a little deeper, I see… blood, sweat, and tears from a lot of traders. 😂
Because this isn't just a price chart. Look closely enough, and you'll see an entire story about market psychology.
The first team: The Range Traders. Price moved sideways long enough that buying low and selling high became a habit. A few successful trades build confidence. More successful trades make you feel comfortable. And just when everyone starts believing the market will keep ranging… it changes character. 😂
The second team: The Breakout-and-Retest Traders. Price breaks the trendline and explodes higher, but they don't chase. They're waiting for a cleaner entry. A proper retest. The problem? This time, price doesn't really want to come back. Breakout, rally, a shallow pullback… and then it keeps going. Eventually, there's only one question left: “Wait… where's my retest?” 😂
The third team: The Former Winners. These are the traders who previously caught great SELL setups at 4,300, 4,400, 4,500, or 4,600. They were right before, so naturally, they become more confident. Price goes higher? SELL. Higher again? SELL more. “It can't keep going up forever.” But the market doesn't care how many times you've been right in the past. Sometimes, the most dangerous thing is simply… getting too comfortable with your previous victories.
The fourth team: The FOMO Traders. At first: “No way, it's already too far.” Price moves higher: “Maybe it still has room.” Higher again: “Alright, just a small position.” And just like that, FOMO officially enters the market. The more afraid you are of missing out, the easier it is to enter right when the market is preparing to test you. 😂
The fifth team: The Sideline Traders. No stop loss. No margin call. No blown account. Sounds pretty good, right? But it isn't always comfortable. Because what remains is… regret. Regret for seeing the opportunity but not taking it. Regret for waiting for a pullback that never comes. Sometimes, watching price run away without you hurts too. 😂
And finally, the winning team. 🏆 They weren't traders who never faced challenges. They also had to survive pullbacks, consolidation, volatility, and moments when taking profits early felt tempting. But they stuck to their plan, held their positions, and ultimately captured a move of nearly 700 points in Gold. Sometimes, finding the right entry isn't the hardest part. The harder part is having enough patience to stay in the trade when you're actually right.
Looking at the whole picture, one thing becomes clear: in the same market, every trader has a different trap. Some get trapped by habits formed during consolidation. Some are misled by previous victories. Some wait for the perfect entry. Some fall into FOMO. Some are left with regret.
And behind these candlesticks, there is more than just price.
There is greed, fear, confidence, FOMO, patience, and regret.
Maybe that's why we sometimes need to zoom out. Instead of only watching M1 or M5, take a look at H4 or even the Daily chart.
Look at the bigger picture.
Technical analysis helps us read the chart. But psychology helps us understand the people creating it.
So what about you? 😂 Be honest—where did your blood get spilled on this chart? XAUUSD — Rebound Setup From H1 SupportMarket Pulse
Gold remains under macro pressure. Treasury yields have climbed to their highest levels since early 2025, while the U.S. dollar is firm after Fed Chair Kevin Warsh’s hawkish message. Markets are now pricing around a 66% chance of a September rate hike. ADP employment and Friday’s Nonfarm Payrolls are the next major events to watch.
Middle East tensions have also pushed Brent oil above $92. This may give Gold some safe-haven demand, but higher energy prices also increase inflation risk and keep pressure on bond yields.
What the Chart Says
XAUUSD remains bearish on H1 after the strong breakdown from the 4,580 area.
Price has continued to make lower highs and lower lows, but the latest selloff has now reached the marked 4,350–4,375 FVG + liquidity zone.
This is an important support area, so selling directly here looks less attractive.
The chart suggests a possible recovery from this zone. The first area above is the 4,455–4,470 OB + liquidity zone.
If buyers can push through it, the next important retracement area is 4,500–4,520, where the FVG sits close to the 0.50 Fibonacci level near 4,503. The 0.618 level around 4,536 could become the next resistance if the recovery becomes stronger.
Levels That Matter
4,625–4,643 — OB + major rejection
4,572–4,585 — Liquidity resistance
4,500–4,520 — FVG + Fibonacci
4,455–4,470 — OB + liquidity
4,350–4,375 — FVG + major support
My Main Plan
The main idea is a short-term bullish recovery from support, not a full bullish trend change.
If 4,350–4,375 holds and buyers show clear confirmation, Gold could rebound toward 4,455–4,470 first.
A strong break above this area may extend the recovery toward 4,500–4,520.
What I Need to See
I want to see a clear bullish reaction and a short-term structure shift from the current support.
A sustained H1 break below 4,350 would weaken the rebound idea and keep sellers firmly in control.
Final Read
The larger H1 structure is still bearish, but price has reached a strong downside target after an extended selloff. For now, I prefer watching for a confirmed recovery rather than chasing new shorts into support. Long 
XAU/USD 45-Minute Professional Technical Analysis1. Market Structure
The chart shows a clear transition from a bullish structure into a sustained bearish sequence.
Price initially formed higher highs and higher lows, reaching the 4,680–4,690 region.
A bearish Market Structure Break (MSB) occurred around 4,620–4,630, signaling deterioration in the bullish trend.
Since then, price has produced a sequence of lower highs and lower lows.
The strongest bearish displacement occurred around 4,600 → 4,450, confirming aggressive selling pressure.
The latest leg has pushed price down toward 4,370, meaning sellers remain in control.
Structural bias: BEARISH
2. Current Demand / Order-Block Zone
The most important area on the chart is the green bullish order-block/demand zone around 4,340–4,375.
Price is currently trading inside/at the upper portion of this zone.
This is significant because:
It represents the last visible area where buyers may attempt to absorb selling.
Price has already experienced a substantial decline into the zone.
A reaction here could produce a short-term bullish retracement.
However, being inside demand does not automatically mean a long entry. Confirmation is needed.
Key demand levels
Level Significance
4,375 Immediate reaction area
4,350–4,360 Core demand
4,335–4,340 Lower boundary / invalidation area
A decisive 45-minute close below the lower demand boundary would weaken the bullish reversal thesis considerably.
3. Bullish Scenario
The chart's projected Take Profit is around 4,440–4,445.
For a professional long setup, I would want to see:
Sweep/hold of 4,340–4,375 → bullish displacement → lower-timeframe bullish structure break → retracement → long
Potential upside objectives:
TP1: 4,400
TP2: 4,430
TP3: 4,440–4,445
The 4,440 area is particularly important because it previously acted as a consolidation/resistance region during the recent decline.
A successful recovery above 4,440 would improve the short-term bullish structure considerably.
4. Bearish Scenario
The higher-timeframe intraday structure remains bearish, so the alternative scenario is a demand-zone failure.
If price:
Breaks below 4,340–4,350
Closes decisively below the zone
Retests the broken demand as resistance
Fails to reclaim it
then the bearish continuation setup becomes much stronger.
In that case, the current demand zone effectively becomes supply, and the market could continue searching for lower liquidity.
Important: I would avoid shorting directly into the middle of the green demand zone. The better bearish setup would be a confirmed breakdown and retest.
5. Major Supply Zone
At the top of the chart is a large red bearish order block around:
4,665–4,695
This is the major higher-timeframe supply zone.
If price eventually recovers toward this area, sellers could become active again.
Therefore, even if the current demand produces a bullish bounce, the broader chart does not become fully bullish until the market begins reclaiming the series of lower highs.
Professional Trade Bias
Primary bias: 🔴 Bearish
Tactical bias at current price: 🟢 Potential counter-trend long from demand, but confirmation required
The distinction is important:
The trend is bearish; the location is potentially bullish.
That means I would not treat the current green zone as an automatic buy. I would wait for evidence that buyers are actually defending it.
Best-quality setup
4,340–4,375 demand → liquidity sweep → bullish CHoCH/MSB → retest → long → 4,440 target
Bearish invalidation of the bounce idea
Strong 45M close below ~4,340 + failed retest
That would favor continuation rather than the projected 4,440 recovery.
Final Assessment
XAU/USD is currently in a bearish 45-minute market structure and has sold aggressively into a predefined demand/order-block zone. The immediate area around 4,340–4,375 is therefore the key decision zone.
A confirmed bullish reaction could reasonably target 4,400–4,440, matching the chart's projected take-profit area.
But if the demand zone fails, the safer interpretation is bearish continuation, because the dominant structure remains lower highs/lower lows.
My professional read:
Trend: 🔴 Bearish
Location: 🟢 Major demand
Immediate decision: Wait for confirmation
Bullish target: 4,440–4,445
Critical support: 4,340–4,350
Major supply: 4,665–4,695
Best approach: Don't chase the move; trade the reaction to the demand zone. Long 
Major Support Holds, Recovery Setup
Fundamental Analysis
Gold remains under pressure from higher Treasury yields and stronger Fed rate-hike expectations. U.S. employment data later this week could become the next major catalyst for USD, yields and Gold.
Technical Analysis
On H1, Gold has extended the bearish move into the 4,360–4,385 OB + Support and is starting to react from this area.
After such a strong decline, a corrective recovery may develop. The first important upside zone is 4,466–4,498 Fibo Zone, while Volume Profile shows stronger activity above current price.
If buyers reclaim this area, the recovery could extend toward the 4,630–4,650 BSL.
Important Key Levels
4,630–4,650 — BSL / Major Resistance
4,466–4,498 — Fibo Zone
4,360–4,385 — OB + Support
Trading Scenario
Buy priority remains only if 4,360–4,385 holds and H1 confirms a bullish reaction.
Target: 4,466–4,498 first, then 4,630–4,650 if momentum strengthens.
Invalidation: H1 acceptance below 4,360.
Overall View
The broader short-term structure remains weak, but Gold is now testing an important support zone. A confirmed reaction could start a corrective recovery toward the Fibo Zone.
Can buyers defend 4,360–4,385 and push Gold back toward 4,500?
Short 
Short 
XAUUSD: Bearish Structure Below Key ResistanceGold remains below a descending trendline on the 1-hour chart after a strong decline from higher levels.
Price is currently trading below the 4,400 reference level. The 4,440–4,460 area is marked as the main resistance zone, where a recovery could be tested for signs of renewed selling pressure.
If resistance continues to hold, the bearish structure could remain relevant, with the 4,310 area acting as the major support to monitor.
A sustained move above the resistance structure would weaken this bearish scenario and could shift attention toward the higher resistance level near 4,632.
Key levels:
Resistance zone: 4,440–4,460
Intermediate level: 4,400
Major support: 4,310
Higher resistance: 4,632
This analysis is based on price structure, trendline behavior, and key support/resistance levels. It is for educational and informational purposes only and is not investment advice. Short 
XAUUSD — The Market Is Still HeavyGold is not giving buyers an easy structure right now.
After the strong breakdown, price is trying to breathe around 4,430 - 4,440, but the overall pressure still belongs to sellers.
This is the type of market where a bounce can look attractive, but the main trend can still punish early buyers.
What I see on the chart
The first important support is 4,396.
If gold can hold above this level, a technical bounce toward 4,460 is possible.
But 4,460 is not a clean bullish zone for me.
It is the first Sell Scalping Zone.
That means I will watch this area for rejection if price returns there.
If gold pushes higher, the bigger test is 4,531.
This is the continuation selling zone and also the retest area of the broken structure.
As long as gold stays below 4,460 - 4,531, the bearish view remains valid.
If 4,396 breaks, the next major downside area is 4,342.
This is the OB Buy / End Liquidity zone, where price may finally create a deeper reaction.
Important levels
Current price area: 4,430 - 4,440
First liquidity support: 4,396
First sell reaction zone: 4,460
Major retest sell zone: 4,531
Deep liquidity / OB Buy zone: 4,342
Today’s plan
If gold bounces:
I want to see how price reacts at 4,460.
A weak reaction there may keep sellers in control.
If gold reaches 4,531:
This becomes the stronger resistance test.
Only a clear break above this zone can weaken the bearish plan.
If gold breaks below 4,396:
The downside path toward 4,342 becomes more open. Short 
XAUUSD — The Drop Is Clear, But Don’t Sell LateGold has made a strong bearish move after breaking down from the previous structure.
Price is now trading around 4,450 - 4,460, and the market is no longer showing a clean bullish continuation setup.
But after a sharp drop, selling too late can also be dangerous.
That is why I prefer to focus on reaction zones instead of emotion.
The simple read
4,432 is the first support reaction area.
If gold holds this zone, a short-term recovery toward 4,535 can appear.
But 4,535 is the key level I want to watch carefully.
This is the Sell Zone / Retest Breakdown Trend area.
If gold bounces into 4,535 and rejects, sellers may regain control again.
If 4,432 breaks clearly, the next deeper zone is 4,359.
This area can become an important OB Buy / trend retest reaction zone later.
Key price zones
Current price area: 4,450 - 4,460
First support reaction: 4,432
Main sell retest zone: 4,535
Deep OB Buy / trend retest zone: 4,359
Recovery improves above: 4,535
Bearish pressure remains active below: 4,535
Trading plan
If gold holds 4,432:
A bounce toward 4,535 is possible.
But I will not chase that bounce as a bullish reversal.
I want to see how price reacts at the retest zone.
If gold rejects from 4,535:
That can confirm the breakdown structure again.
Price may rotate lower toward 4,432, then 4,359.
If gold breaks below 4,432:
The downside pressure becomes stronger.
4,359 becomes the next main zone to watch for reaction. Short 
Long 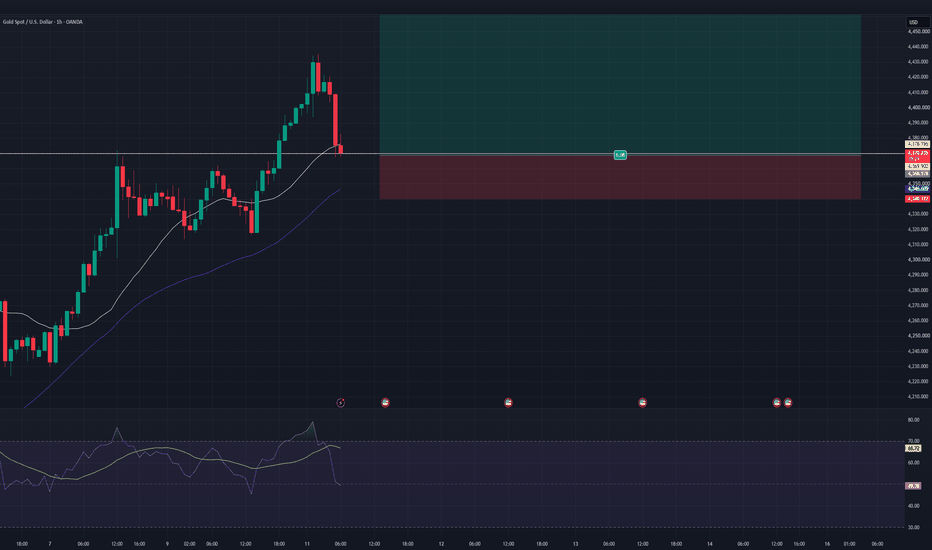
XAUUSD – Gold Weakens Before Key U.S. Data XAUUSD – Gold Weakens Before Key U.S. Data
Gold is starting the new week under pressure after failing to hold the previous recovery structure.
Price is now trading around 4,423 after a sharp bearish impulse from the 4,580 – 4,600 area. The move shows that buyers lost control in the short term, while sellers are trying to keep price below the broken structure.
The market is now waiting for important U.S. data, with the U.S. dollar supported by risk-off sentiment, rising Treasury yields, and stronger expectations that the Fed may keep a hawkish tone into September. This is important for gold because higher yields and a stronger dollar usually reduce demand for non-yielding assets.
Technical structure
On the H1 chart, gold rejected from the upper area and created a strong bearish leg toward 4,397. After that, price moved into a small consolidation range below the descending short-term trendline.
The nearest resistance zone is around 4,480 – 4,520, where Fibonacci 0.618 and the previous sell order zone are aligned. If gold retests this area and fails to break above it, sellers may continue to defend the trend.
The key low is around 4,396. If price breaks below this level with clear momentum, the next liquidity area around 4,340 – 4,360 becomes the main downside target.
However, if gold can reclaim 4,520 and hold above it, the bearish pressure may weaken and price could attempt a recovery back toward 4,560 – 4,580.
Key price zones
Current price: 4,423
Nearest low: 4,396
Main liquidity support: 4,340 – 4,360
Sell order 0.618 zone: 4,480 – 4,500
Sell order Fibonacci zone: 4,505 – 4,520
Recovery confirmation: above 4,520
Trading scenario
Primary scenario – Sell on recovery
Sell zone: 4,480 – 4,520
Entry condition: bearish rejection, failed retest, or lower-timeframe bearish confirmation
Stop loss: above 4,520
Take profit 1: 4,396
Take profit 2: 4,360
Take profit 3: 4,340
Alternative scenario – Bullish recovery
Condition: H1 candle closes back above 4,520 and holds
Target: 4,560 – 4,580 first
If buyers regain strength above 4,580, gold may try to rebuild a stronger recovery structure.
Hannah’s view
Gold is not in a clean buying area yet. The short-term structure still favors sellers while price remains below 4,480 – 4,520.
For now, I prefer watching the reaction around the sell order Fibonacci zone. A weak recovery into this area may give sellers another chance to push price lower.
The key level is 4,396. If this low breaks, gold may continue toward the deeper liquidity zone near 4,340 – 4,360.
Main view: wait for confirmation around 4,480 – 4,520. No confirmation means no trade.
Do you think gold will reject from the Fibonacci sell zone, or will buyers reclaim 4,520 before the U.S. data?
Long 
BRIAN XAUUSD – GOLD TESTS 4,400, SELLERS STILL HOLD 4,477 BRIAN XAUUSD – GOLD TESTS 4,400, SELLERS STILL HOLD 4,477
Gold has started the new week with a sharp value breakdown after failing to sustain the recovery above the higher range.
The market first tried to protect the 4,400 area on Monday, but the reaction was not strong enough to fully restore bullish momentum. Now gold is trading around 4,430 after erasing part of the previous rebound from the eight-day low.
Fundamentally, the pressure is coming from a stronger US dollar, renewed risk-off sentiment linked to US-Iran tension, and hawkish Fed expectations. Gold is still trying to hold around the 21-day SMA area near 4,400, but the chart shows that sellers are now controlling the short-term rhythm.
This is not a clean buy zone yet.
This is a decision area.
Technical structure
On the H1 chart, gold broke sharply from the upper value area after losing the Sell VAH zone around 4,550 - 4,565. That breakdown created a fast move into the lower structure.
The current resistance is the Sell zone POC around 4,470 - 4,480. This is the first area where sellers may defend again if gold rebounds. As long as price stays below this zone, the recovery remains weak.
The short-term trendline support is being tested around 4,420 - 4,430. If this trendline fails, price may sweep the weekly low near 4,397 before rotating deeper into the Buy zone POC around 4,350 - 4,360.
That lower POC zone is the cleaner buyer reaction area because it sits near the larger value base from the previous bullish move.
Important zones
Current price area: 4,420 - 4,435
Gold is sitting near the short-term trendline and 21-day SMA reaction area.
Sell zone POC: 4,470 - 4,480
Main short-term resistance and seller control zone.
Sell VAH: 4,550 - 4,565
Higher resistance if buyers reclaim momentum.
Weekly low: 4,397
Liquidity level that may be swept before any stronger rebound.
Buy zone POC: 4,350 - 4,360
Main buyer reaction zone if gold corrects deeper.
Strong support: 4,326
Last structural support if sellers extend the move.
Trading scenario
Priority view: wait for sell reaction from 4,470 - 4,480
Entry:
Look for sell positions only if gold rebounds into 4,470 - 4,480 and shows clear rejection.
Stop Loss:
Above the rejection high or above the POC resistance zone.
Take Profit:
TP1: 4,397
TP2: 4,350 - 4,360
TP3: 4,326 if bearish momentum expands
This setup follows the current value breakdown and respects the fact that sellers are still active below the POC resistance.
Alternative buy scenario
If gold sweeps the weekly low around 4,397 and then drops into 4,350 - 4,360 with strong bullish rejection, a reaction buy can appear.
But I would not chase buy in the middle. The better buy idea needs either a clean reclaim above 4,480 or a deeper reaction from the lower POC zone.
Final view
Gold is still holding near an important technical area, but the short-term structure has weakened after the sharp rejection from higher value.
For now, the chart favors a sell-on-rebound plan unless buyers can reclaim 4,470 - 4,480 with strength. If that zone rejects, gold may continue lower toward the weekly low and the Buy zone POC.
The key is simple:
Below 4,480 = sellers stay in control.
Lose 4,397 = deeper pullback toward 4,350 is likely.
Hold 4,350 - 4,360 = buyers may return.
Break above 4,480 = recovery momentum improves.
Gold is not at a place to guess. It is at a place to wait for confirmation.
Will sellers defend 4,477 again, or will buyers protect 4,400 and force a reclaim move?
Short 
Gold (XAUUSD) Trade Plan [01.09.2026: Tuesday]Probable Scenario Analysis:
⏺ Present Scenario:
Gold (XAUUSD) TVC:GOLD has been flat (sideways) after the flash crash on Friday. There is no sign of bullishness. The sentiment of the market is indecisive to bearish. Today is a high-impact event day: ISM Manufacturing PMI (07:30 PM IST). We have to study how the price behaves with respect to the event.
🟢 Bullish Scenario:
There is no sign of a bullish setup. There is a strong resistance zone (SRZ) in the region (4500 - 4475). Additionally, the region (4550 - 4500) is a non-tradable region. However, if the price sustains above 4550, then the probable bullish targets would be - 4575 and 4600.
🔴 Bearish Scenario:
The price structure is lower-lows and lower-highs (LLs and LHs). Thus, a bearish setup is active. If the price remains below 4450, then stay bearish. The probable bearish targets below 4450 would be - 4425 and 4400. There is a weak support zone (WSZ) in the region (4425 - 4400). Next, if the price decisively breaks down below 4400, then bearishness will rise. The probable bearish targets below 4400 would be - 4375, 4350, 4325, and 4300. There is a strong support zone (SSZ) in the region (4325 - 4300).
🟡 No Trading Zone: (4550 - 4450).
⏺ Range of Consolidation (ROC): (4500 - 4300).
Here, 4400 is the median of the ROC. The median works like a trading session sentiment evaluator. The price trading above the median would offer bullish sentiment, while the price trading below the median would trigger bearish sentiment within the ROC.
● Events:
- 31 Aug (Mon): No events.
- 01 Sep (Tue): FOMC Member Barr Speaks (06:30 PM IST, 🔵 Low Impact). ISM Manufacturing PMI (07:30 PM IST, 🔴 High Impact).
- 02 Sep (Wed): ADP Non-Farm Employment Change (05:45 PM IST, 🟠 Medium Impact). Factory Orders m/m (07:30 PM IST, 🔵 Low Impact).
- 03 Sep (Thu): Challenger Job Cuts y/y (03:00 PM IST, 🔵 Low Impact). Unemployment Claims (06:00 PM IST, 🟠 Medium Impact). ISM Services PMI (07:30 PM IST, 🟠 Medium Impact)
- 04 Sep (Fri): Unemployment Rate (06:00 PM IST, 🔴 High Impact).
● Intraday, Weekly, and Monthly Bias
Establish bias with respect to the opening price (of the particular session - Intraday, Weekly, and Monthly). If the price sustains above the opening price, then don't think of shorting. Look for bullish trades only. On the contrary, if the price sustains below the opening price, then don't think of going long. Look for bearish trades in that case.
● Disclaimer + End Note
- All the analyses would fail in the case of a major gap up, gap down, or price structure anomaly. Thus, practice PRAGMATISM in the live session.
- Trade only if there is a set-up. Remember, not trading is an extension of the trading activity.
- Mark your points. Trade your points. Price is GOD. Anything can happen in the markets. Thus, trade what you see, not what you believe.
- Always PRACTICE RISK MANAGEMENT. Always PROTECT YOUR CAPITAL. Be RESPONSIBLE.
- Be Strategic. Be Courageous. Be Patient. Be Wise.
- Every day is a new day. Thus, do not carry the baggage of past successes or failures. Leave the gardens of winning and losing. Establish yourself in equanimity. Always think from a new perspective.
- Let the joy of trading drive your effectiveness, not greed or fear. Believe in Possibilities.
Happy Trading! GOLD IS BEING SQUEEZED – WHERE WILL THE NEXT BREAKOUT GO?Gold remains in a short-term downtrend. However, after the sharp decline, price has started to consolidate and is being squeezed into a narrow 4,400–4,460 wedge.
The key question now is: Is this a base forming for another move higher, or simply a pause before sellers extend the downside?
Resistance
4,470–4,480 │ 4,515 │ 4,542
Support
4,400 │ 4,340 │ 4,320 │ 4,300
🎯 TRADING SCENARIOS
Bullish scenario:
If price holds 4,400 and breaks above 4,470–4,480, followed by a break of 4,515, the recovery could extend toward 4,542.
Bearish scenario:
If 4,400 breaks, especially if price then loses 4,340, selling pressure could extend toward 4,320 → 4,300.
👉 For now: look for BUY opportunities near the lower range and short-term SELL opportunities near the upper range. Trade the direction of the breakout.
🧠 PERSONAL VIEW
What matters most to me right now is that selling pressure is slowing, but it has not disappeared. Therefore, I am not ready to conclude that the 4,400 area has completed its base-building process.
Price could continue to consolidate and move sideways as the market absorbs buying and selling pressure before the next expansion.
The next major catalyst is NFP on September 4.
Last month, Nonfarm Payrolls fell by 23,000 jobs, while June payrolls were revised down to +20,000. This makes the upcoming NFP especially important in determining whether the labor market weakness was temporary or part of a broader deterioration.
This data could also have a major impact on Fed rate expectations for September, which in turn could directly affect the U.S. dollar and gold.
⚠️ KEY IDEA
Do not rush to predict the direction.
I will watch how Gold behaves within the 4,400–4,460 range, especially around both boundaries.
Holding support → potential base for a rebound.
Breaking support → sellers remain in control.
For now, let price reveal its hand through the economic data and prepare for the big battle of the week: NFP. Short 
H1 Major Demand Recovery Setup
XAUUSD is trading around 4,446 after the post–Jackson Hole selloff pushed price into the marked OB + Support area. Short-term structure remains bearish below the descending trendline, but price is now sitting near a major reaction zone where a recovery may develop.
Gold remains under pressure after Fed Chair Kevin Warsh’s hawkish Jackson Hole message lifted expectations for a September rate hike to around 64–65%. At the same time, renewed U.S.–Iran fighting has pushed Brent above $91 and the U.S. 10-year yield above 4.75%, increasing inflation concerns. Markets now turn to this week’s U.S. employment data for the next Fed catalyst.
Technical View
The H1 structure remains corrective bearish after price broke below the previous demand areas and stayed under the descending trendline.
However, gold is now holding the 4,420–4,450 OB + Support zone, with the recent swing low at 4,397.857 sitting directly underneath.
A liquidity sweep below the current support followed by an H1 reclaim would strengthen the recovery setup.
The first upside objective is the 4,485–4,515 Fibonacci zone. If buyers establish acceptance above this area, price could extend toward the 4,575–4,595 Volume Profile resistance.
A stronger recovery would then expose the 4,640–4,660 BSL / resistance zone.
Key Zones
Current price: 4,446.100
OB + Support: 4,420–4,450
Swing Low / Liquidity: 4,397.857
Fibonacci Zone: 4,485–4,515
Volume Profile Resistance: 4,575–4,595
BSL / Resistance: 4,640–4,660
Trading Plan
Buy Priority: 4,420–4,450
Condition: wait for a liquidity sweep, bullish rejection, reclaim or H1 CHoCH/MSS confirmation from support.
TP1: 4,485–4,515
TP2: 4,575–4,595
TP3: 4,640–4,660
Invalidation: sustained H1 acceptance below 4,397
Buy View
The preferred setup is a confirmed recovery from current demand rather than buying blindly into bearish momentum.
A sweep of 4,397 followed by a fast reclaim would offer stronger confirmation. If price accepts below the swing low, the bullish recovery thesis weakens and no long setup is preferred.
Final View
Gold remains under macro and technical pressure, but H1 has reached an important support area after an extended decline.
The cleaner plan is to wait for confirmation around 4,420–4,450, targeting 4,500 first and potentially 4,580–4,595 if the recovery gains momentum.
Will gold sweep the 4,397 low before starting the H1 recovery? Long 


