 Long
Long
XAU/USD: Liquidity Sweep Could Fuel A Rebound🔥📊 MARKET STRUCTURE
1H trend: Overall bearish after the sharp sell-off.
Clear BOS to the downside around 4,570.
CHoCH appeared near 4,470, confirming the shift in momentum.
Price is now consolidating around 4,430 after sweeping liquidity below recent lows.
Short-term momentum is attempting to turn bullish, but the larger structure remains bearish.
🔑 KEY LEVELS
🟢 Support/Demand: 4,360–4,390
🟡 Current area: ~4,432
🔴 Resistance/Supply: 4,590–4,615
🔴 Major resistance: 4,640–4,680
🎯 POSSIBLE NEXT MOVE
The liquidity sweep below ~4,400 may be the fuel for a short-term recovery.
Bullish scenario:
4,430 → 4,475–4,490 → pullback/retest → 4,590–4,615.
A clean 1H reclaim and hold above 4,615 could open the door toward 4,640–4,680.
Bearish scenario:
If price rejects below 4,480–4,500 and loses 4,400, sellers could target 4,360–4,390 again.
⚠️ INVALIDATION
A sustained break below 4,360 weakens the bullish-rebound idea.
A strong reclaim above 4,615 would invalidate the immediate bearish-rejection scenario.
🧠 TRADER PSYCHOLOGY
After an aggressive sell-off, liquidity sweeps often create sharp countertrend rebounds. The key is confirmation—not chasing the first green candles.
📌 Bias: Short-term bullish recovery ⚡ | Higher-timeframe structure: Bearish Long 
BUYERS OR SELLERS? WHO GETS HUNTED FIRST ON TUESDAY?Tuesday could be a very interesting day for Gold because I’m expecting a trap before the market shows its real direction. Monday gave us both a double top and a double bottom, which means liquidity has been building on both sides, but one side still looks much weaker to me. The market may not simply break out from here; instead, I believe it could first hunt one side, trap traders into the wrong direction, and then make the actual move. So tomorrow, the important question is not just whether Gold goes up or down. The real question is which side the market is going to hunt first, who is going to get trapped, and where the real momentum will begin.
If we look at the overall picture, Monday was mainly a consolidation day. And considering the way price action developed, I personally don’t think the market currently has enough fuel to sustain a strong upside move from these levels. Yes, sellers have entered the market, but the majority of traders are still bullish and continue to have more interest on the buying side. The main reason is the liquidity sweep around $4,400. From the perspective of the buyers, that sweep looks like a strong rejection and a potential buying opportunity, which is why many traders are expecting another upside move from here. Whether that move actually happens or not, we will understand in the coming sessions, but for now, the structure is not convincing enough for me to aggressively chase the upside.
This is exactly why I believe the maximum liquidity is currently sitting on the buying side. After the liquidity sweep around $4,400 on Monday, the market immediately reversed, and then we saw the market take support around $4,416 on two separate occasions. That kind of price action naturally gives buyers more confidence. On top of that, many traders were still entering buys around $4,420 near the market close and are now holding those positions into Tuesday. When such a large number of traders are positioned on one side, that side automatically becomes an attractive liquidity target for the market.
So, my expectation for Tuesday is that after the opening, Gold could spend some time consolidating below $4,459 and then potentially break down below $4,416, which is a very important level for me. If that breakdown happens, I would expect the downside move to accelerate toward $4,385 and $4,379. And if the selling momentum becomes strong enough, we could even see $4,346. But the important part is not simply the breakdown itself. The real opportunity could come from what happens after traders start believing that the market has completely turned bearish.
Think about the psychology. If $4,416 breaks, buyers who are currently holding positions may start feeling uncomfortable. Once price continues lower, many of them will start thinking that the market is heading into a deeper correction and that selling on retracements is now the safer option. This is where the crowd can completely change its bias. Remember the previous structure I explained, where the market consolidated between the 11th and 19th hour and then broke out around $4,450. When Gold came back to retest that $4,450 area, we saw another reaction from almost the same zone today. So, if the market breaks the Monday low tomorrow, traders may interpret it as confirmation that resistance has held and that Gold has officially turned bearish.
And that is exactly where I want to be careful. Once traders start selling the retracements and selling FOMO starts building, the market could potentially use that fresh selling liquidity to create another aggressive reversal. The first move could therefore be completely different from the actual move I’m looking for. I don’t want to blindly sell just because a level breaks. I want to see whether the market is actually accepting below the level or simply sweeping liquidity and preparing for a reversal.
For me, the key level remains $4,456. Below $4,456, I will stay bearish and look for $4,385 and $4,379. If the downside momentum becomes extremely strong, then $4,346 could also come into play. But if the market starts building buying momentum again and Gold manages to close back above $4,420, then the psychology changes completely. In that situation, the bearish breakdown could turn into a trap, and I would expect bullish momentum to start building again, potentially giving us a stronger upside move in the coming sessions.
So, for Tuesday, I’m not interested in simply predicting up or down. I’m watching where the crowd is positioned, where the liquidity is sitting, which side gets swept first, and how price reacts after that sweep. That reaction will tell us much more than the first breakout itself.
Stay patient, wait for confirmation, and don’t allow the first move of the market to force you into a trade. Sometimes the first move is designed to make you believe you already know the direction, while the real move comes only after the liquidity has been taken.
What’s your plan for Gold on Tuesday? Let me know in the comments.
Short 
Short 
 Long
Long
 Education

Education

Support Holds, Recovery Wave in Focus
Fundamental Analysis
Gold remains under pressure from a firm U.S. dollar and higher Fed rate expectations. However, renewed geopolitical tension may provide some safe-haven support. U.S. employment data this week could become the next major catalyst.
Technical Analysis
On H1, Gold has reacted from the 4,400–4,425 OB + Support after the recent strong sell-off.
Price is now recovering near 4,464. The first upside test is the 4,517–4,540 Fibo Zone. If buyers reclaim this area, the recovery could extend toward the high-volume region around 4,590–4,610 and eventually the 4,630–4,650 BSL.
Important Key Levels
4,630–4,650 — BSL / Resistance
4,590–4,610 — Volume Profile Resistance
4,517–4,540 — Fibo Zone
4,400–4,425 — OB + Support
Trading Scenario
Buy priority remains while 4,400–4,425 holds and H1 continues showing bullish recovery.
Target: 4,517–4,540 first, then 4,630–4,650 if momentum strengthens.
Invalidation: H1 acceptance below 4,400.
Overall View
Gold is still weak on the broader short-term structure, but the reaction from major support may develop into a corrective recovery. The Fibo Zone is the first important test for buyers.
Can Gold reclaim 4,540 and extend the rebound toward upper liquidity? Long 
XAUUSD — Sell the H1 FVG RetestFundamental Analysis
Gold enters the new week under pressure after Fed Chair Kevin Warsh’s hawkish Jackson Hole message sharply increased expectations for a September rate hike. The dollar remains near a two-week high, short-term Treasury yields are elevated, and renewed U.S.–Iran tensions have pushed oil above $90, adding further inflation risk. U.S. employment data this week may become the next major catalyst for Fed pricing and gold.
Technical Analysis
On the H1 chart, XAUUSD is trading near 4,456 after a strong bearish displacement from 4,643 and a sweep of the 4,396 low. Price is now attempting a corrective recovery, but the structure remains bearish below the broken support and overhead FVGs. The preferred sell zone is 4,485–4,525, where the first imbalance, Fibonacci 0.382 area, and previous breakdown structure converge. If price retests this area and rejects, sellers may resume toward 4,455, then the lower FVG around 4,415–4,430 and potentially 4,396.
Important Key Levels
Current price: 4,455.75
Main sell zone: 4,485–4,525
Short-term support: 4,445–4,455
Short-term resistance: 4,485–4,525
Liquidity area: 4,415–4,430
Main target: 4,396–4,430
Invalidation: above 4,550
Trading Scenario
Main Sell Setup
Entry: 4,485–4,525
Stop Loss: 4,555
Take Profit 1: 4,455
Take Profit 2: 4,415–4,430
Take Profit 3: 4,396
Sell Condition
Wait for a corrective rebound into the FVG and clear bearish confirmation. A long upper wick, bearish engulfing candle, failed reclaim above 4,500, or H1 close back below the zone may confirm renewed seller pressure. If price breaks and holds above 4,550, the immediate bearish setup should be reassessed.
Overall View
The H1 outlook remains bearish while XAUUSD trades below the broken structure and major Fibonacci resistance. After the sharp Jackson Hole selloff, chasing shorts around current price offers limited value. The preferred plan is to wait for a rebound into 4,485–4,525 before looking for continuation toward 4,430 and 4,396. Strong U.S. jobs data could reinforce the bearish repricing, while weak employment numbers may support a deeper corrective rebound.
Do you expect gold to retest the 4,485–4,525 FVG before continuing lower? Short 
XAUUSD — H4 Breakdown Keeps Sellers in ControlFundamental Analysis
Gold remains under pressure after Fed Chair Kevin Warsh’s hawkish Jackson Hole message increased expectations of another US rate hike. Markets are pricing in roughly a 60% probability of a September move, while Treasury yields and the US dollar remain firm.
At the same time, renewed US–Iran tensions have pushed oil prices above $90. This is providing Gold with some safe-haven support, but higher energy prices are also increasing inflation concerns and may keep yields elevated. US employment data later this week will be important in shaping expectations for the Fed’s next move.
Technical Analysis
XAUUSD has turned clearly bearish on the H4 timeframe.
Price initially rejected the 4,660–4,685 major resistance zone before beginning to form a weaker market structure. The strong breakdown below the 4,580–4,610 Small OB confirmed that sellers had taken control.
Gold has now also moved below the previous liquidity area around 4,440–4,455.
This opens the way towards the H4 FVG below. The 4,365–4,425 area is the first important downside zone where price may slow down or react.
If selling pressure continues through this imbalance, the stronger 4,290–4,325 support + liquidity zone becomes the next major target.
A short-term rebound is still possible after such a sharp decline, but for now it would be viewed as a corrective move within the broader bearish H4 structure.
Important Key Levels
4,660–4,685 — Major rejection
4,580–4,610 — Small OB / resistance
4,440–4,455 — Broken liquidity
4,365–4,425 — H4 FVG
4,290–4,325 — Major support + liquidity
Trading Scenario
The main plan remains bearish.
I prefer waiting for a minor recovery and watching whether sellers return below the broken structure.
If price remains below 4,440–4,455, the next bearish wave could continue through the FVG towards 4,290–4,325.
Sell Condition
Look for bearish rejection following a corrective rebound or a clean H4 continuation below the current structure.
A sustained recovery above 4,580–4,610 would weaken the bearish setup.
Overall View
The H4 structure has shifted strongly in favour of sellers. Gold continues to receive some geopolitical support, but elevated yields, a firmer US dollar, and stronger expectations of a Fed rate hike remain clear headwinds.
For now, I prefer following the bearish trend while price remains below the broken H4 resistance structure. Short 
XAUUSD 1H — Bearish Breakdown, Downside ContinuationThe 1H chart shows a strong bearish breakdown following the previous corrective structure. Gold rejected the upper 4,640–4,660 FVG, broke below the 4,580–4,600 structural support, and then accelerated sharply lower.
The latest sell-off is significant because price has now broken through the previous range and created a strong bearish displacement. The current price around 4,439 is trading well below the marked FVG zones, so chasing the move at current levels carries higher risk. A pullback into the nearby FVG could provide a cleaner bearish continuation opportunity.
📊 Technical Analysis
Current price: ~4,439
Immediate resistance / FVG: 4,480–4,520
Secondary resistance / FVG: 4,580–4,600
Major resistance / FVG: 4,640–4,660
Current structure: Strong bearish displacement
Immediate support: 4,400–4,420
Major downside target: 4,360
The sharp bearish candle from the 4,580–4,600 area confirms a major loss of bullish structure. Price has also left an imbalance/FVG around 4,480–4,520, which can potentially act as a retracement zone before another leg lower.
🔴 Bearish Setup
Preferred Sell Entry Zone: 4,480–4,520
A retracement into this FVG followed by bearish rejection would offer a cleaner short setup than selling directly at the current depressed price.
Stop Loss: 4,550–4,575
Take Profit 1: 4,420
Take Profit 2: 4,400
Take Profit 3: 4,360
📉 Alternative Scenario
If price does not retrace into the 4,480–4,520 FVG and instead breaks below 4,400 with strong 1H momentum, further downside towards 4,360 becomes increasingly likely.
However, after such an aggressive sell-off, a temporary relief bounce should not be ruled out.
⚠️ Invalidation
If Gold reclaims 4,520 and establishes sustained 1H closes above that zone, the immediate bearish continuation setup weakens.
A stronger recovery above 4,580–4,600 would be a significant warning for the bearish thesis, while a sustained reclaim of the 4,640–4,660 FVG would invalidate the current bearish structure.
🎯 Market Bias
Strongly Bearish below 4,520.
Preferred scenario:
Pullback → 4,480–4,520 FVG → bearish rejection → 4,420 → 4,400 → 4,360
The chart currently favours selling rallies rather than chasing the sharp downside move at 4,439. Short 
Short 
Gold (XAU/USD) Breakout Alert: The Bull Run ResumesGold Spot / U.S. Dollar is currently trading around 4,446.78 on the 45-minute timeframe, and the chart is screaming that the next major leg up is imminent. After finding solid footing following a recent pullback, the price action indicates that the precious metal is primed to resume its massive macro bull run directly from current levels.
Key Levels
Current Demand Zone: 4,440 – 4,450
Major Overhead Targets: 4,500, 4,600, 4,800
Crucial Support / Invalidation: 4,425
Trade Setup: Bullish Trend Continuation (~75% Probability)
Trigger: Buy near the current market price (4,446), as the setup indicates immediate readiness for upward expansion.
Targets:
Target 1: 4,500 (Immediate psychological resistance)
Target 2: 4,600 (Next structural liquidity zone)
Target 3: 4,800 (Macro swing high projection)
Stop-Loss: A strict close below 4,425.
Invalidation: A sharp breakdown below the 4,425 support floor shatters the immediate bullish structure, warning of a deeper correction and stopping out the trade.
Disclaimer: Technical analysis deals in probabilities. Always employ strict risk management and utilize stop-losses to protect your capital. Long 
XAUUSD 1H — Bearish Channel, Downside ContinuationThe 1H chart shows that Gold remains in a corrective bearish structure after the previous bullish trend. Price was rejected from the 4,650–4,680 FVG zones and has continued to form lower highs and lower lows inside a clearly defined descending channel.
The CHoCH around 4,600 marked the initial shift in structure, while the subsequent BOS to the downside confirms continued selling pressure. Price is now trading near the middle/lower portion of the bearish channel, with resistance overhead.
📊 Technical Analysis
Current price: ~4,599
Major resistance / FVG: 4,640–4,675
Key resistance: 4,620–4,640
Current structure: Descending channel
Key support: 4,560–4,575
Major downside target: 4,520–4,540
The 0.6805 Fibonacci retracement area is also acting as an important structural reference. As long as price remains below the descending trendline and fails to reclaim the upper FVG zones, the bearish continuation scenario remains favoured.
🔴 Bearish Setup
Sell Entry Zone: 4,595–4,610
Prefer confirmation from bearish rejection or a break-and-retest of the nearby structure.
Stop Loss: 4,640–4,655
Take Profit 1: 4,575
Take Profit 2: 4,540
Take Profit 3: 4,520
⚠️ Invalidation
If Gold breaks and holds above 4,640–4,655, the descending-channel setup becomes weaker. A sustained move above the 4,675–4,680 FVG would invalidate the current bearish structure and could signal a larger bullish recovery.
🎯 Market Bias
Bearish below 4,620–4,640.
The preferred scenario is a rejection from the current area followed by another move towards 4,560–4,575. If the lower channel support breaks, the next major downside objective is around 4,520–4,540. Short 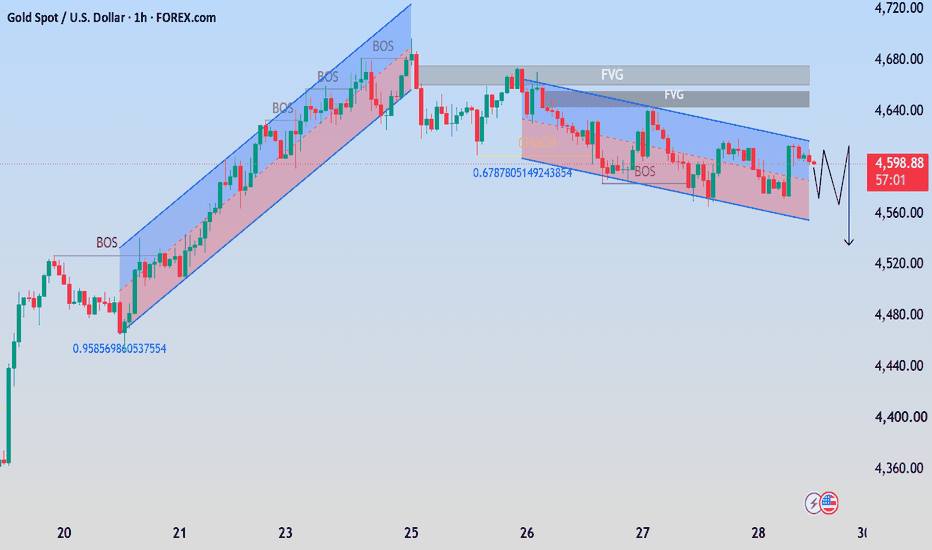
XAUUSD: Supply Rejection & Support Breakdown — Intraday Bearish Market Overview & Technical Bias:
Gold (XAUUSD) has shifted into strong intraday selling pressure after facing a clean rejection from the upper resistance block (~4,525 – 4,570 zone). On the 30-minute timeframe, price action has broken below immediate structural support, forming lower highs and lower lows with sharp red distribution candles confirming seller dominance.
Trade Execution Plan:
Bias: Short / Bearish
Entry Zone: 4,435 – 4,445 (looking for a pullback/retest of the immediate breakdown level)
Stop-Loss (SL): 4,460 (above the recent lower high / minor resistance)
Take-Profit 1 (TP1): 4,400 (key intermediate round number support)
Take-Profit 2 (TP2): 4,360 (major daily structural support level)
Key Confluences:
Supply Rejection: Clear rejection at the overhead resistance block around $4,527+.
Breakdown of Key Pivot: Loss of intermediate support levels confirms intraday bearish continuation.
Bearish Momentum: Heavy sell-off volume and candle closes below minor moving averages indicate persistent downside pressure.
Risk Disclaimer: Maintain strict position sizing and adhere to your stop-loss, as gold remains sensitive to high-impact macroeconomic data. Short 
XAUUSD – Gold Breaks Channel, 4,335 Now In Focus XAUUSD – Gold Breaks Channel, 4,335 Now In Focus
Gold is showing an important change in short-term structure after failing to stay inside the previous rising channel.
Price is trading around 4,433 after a strong bearish break from the channel support. The move is not only a normal pullback anymore. The clean break below the channel suggests that sellers are trying to take control of the short-term direction.
At the same time, the broader daily view still shows gold holding above the 100-day SMA and the middle Bollinger area. This means the larger trend is not fully broken, but the short-term chart is warning that gold may need a deeper correction before buyers can return with strength.
Fundamental view
Gold is still supported on the higher timeframe as long as buyers defend the major moving-average structure. The RSI around 54 shows that momentum remains slightly positive, but not strong enough to call the market overbought.
This creates a mixed environment.
On one side, gold still has medium-term support.
On the other side, the latest price action shows a clear loss of short-term bullish momentum.
That is why the next reaction around the lower support zone will be very important.
Technical view
From the chart, gold has broken below the rising channel and is now trading under the previous channel support.
The first resistance is now around 4,463. This is the nearest sell order area. If price retests this zone and fails to break back above it, sellers may continue to push gold toward the lower support.
Above that, 4,571 is the stronger resistance. This was the previous channel support area, and now it may act as a retest resistance if gold tries to recover.
The main downside target is around 4,335 – 4,362. This zone combines Fibonacci extension, previous reaction level, and strong support. If gold reaches this area and creates a bullish rejection, buyers may attempt a recovery from there.
Key price zones
Current price: 4,433
Nearest resistance: 4,463
Strong resistance: 4,571
Main support / target zone: 4,335 – 4,362
Short-term bearish pressure valid: Below 4,463
Recovery confirmation: Above 4,463
Stronger bullish recovery: Above 4,571
Deeper correction risk: Below 4,335
Trading scenario
Primary scenario – Sell on weak recovery
Sell Zone: 4,463
Entry: Wait for bearish rejection, failed retest, or lower-timeframe bearish confirmation
Stop Loss: Above the rejection high
Take Profit 1: 4,362
Take Profit 2: 4,335
Alternative scenario – Buy from support reaction
Buy Zone: 4,335 – 4,362
Entry: Wait for liquidity sweep, bullish rejection, or clear structure shift from support
Stop Loss: Below 4,335
Take Profit 1: 4,463
Take Profit 2: 4,571
My view
Gold is still not fully bearish on the higher timeframe, but the short-term structure has weakened clearly.
The break below the rising channel changed the immediate picture. As long as price stays below 4,463, sellers still have room to pressure gold toward 4,362 and 4,335.
For buyers, the best area to watch is not the middle of the move. The cleaner reaction zone is near 4,335 – 4,362, where support and Fibonacci target are aligned.
Main view: wait for confirmation around 4,463 or 4,335 – 4,362. A weak retest favors sellers. A strong rejection from support may open the next recovery attempt.
Do you think gold will defend 4,335, or will sellers extend the correction deeper this week?
Short 
Short 
Short 
BRIAN XAUUSD – GOLD BREAKS VALUE, BUT BUYERS MAY WAIT LOWER BRIAN XAUUSD – GOLD BREAKS VALUE, BUT BUYERS MAY WAIT LOWER
Gold starts the new week under pressure after failing to hold the higher value structure.
The main story is not that gold has turned fully bearish. The bigger picture still shows that sentiment toward gold remains supported, even if Fed Chair Warsh shifts into a more hawkish tone. A stronger Fed message can create short-term pressure on gold, but it may not be enough to completely reverse the broader bullish sentiment while positioning and macro narratives remain supportive.
That is exactly what the chart is showing now.
Gold is not collapsing from a weak structure. It is rotating lower after rejecting a high-value area, and the market is now looking for the next real buyer zone.
Technical structure
On the H1 chart, gold has broken down from the upper consolidation and is trading around 4,420.
The previous Sell zone POC near 4,590 - 4,600 acted as the key rejection area. After losing that structure, price dropped aggressively and is now testing the rising trendline area.
The current reaction zone is the Buy zone POC – Scalping around 4,390 - 4,405. This is the first area where short-term buyers may try to defend. However, because the rejection from above was strong, this zone needs confirmation before any buy idea becomes valid.
If gold only gives a weak bounce into 4,470 - 4,480, that area can become a POC sell zone again. Sellers may use that recovery to push price back down.
The deeper and cleaner buyer zone is the Buy VAL around 4,330 - 4,345. If gold loses 4,390, this lower value area becomes the next important reaction zone.
Important zones
Current price area: 4,420 - 4,430
Gold is testing the rising trendline after a sharp value breakdown.
Sell zone POC: 4,590 - 4,600
Major rejected value area from the previous structure.
POC sell zone: 4,470 - 4,480
First recovery resistance if gold rebounds.
Buy zone POC – Scalping: 4,390 - 4,405
Immediate buyer reaction zone.
Buy VAL: 4,330 - 4,345
Deeper value support and cleaner buyer area.
Trading scenario
Primary view: wait for reaction from 4,390 - 4,405
Entry:
Look for buy positions only if gold holds the Buy zone POC around 4,390 - 4,405 and shows clear bullish rejection.
Stop Loss:
Below the local sweep low or below the POC support zone.
Take Profit:
TP1: 4,470 - 4,480
TP2: 4,520
TP3: 4,590 only if buyers reclaim momentum
This is a reaction setup, not a blind buy. The price must show that buyers are actually defending the zone.
Alternative scenario
If gold rebounds into 4,470 - 4,480 and fails to break above it, that area can become a sell reaction zone.
A rejection from 4,470 - 4,480 may send price back toward 4,390. If 4,390 breaks, the next downside target becomes the Buy VAL around 4,330 - 4,345.
Final view
Gold remains supported in the bigger picture, but short-term structure has shifted into a correction phase.
The market is now testing whether buyers are strong enough to defend the rising trendline and the 4,390 - 4,405 POC zone. If they defend it, gold can rebound toward 4,470 - 4,480. If they fail, the cleaner buying opportunity may come lower around 4,330 - 4,345.
For me, the key is simple:
Below 4,480 = sellers still control the recovery.
Hold 4,390 = short-term bounce can happen.
Lose 4,390 = deeper VAL test is likely.
Break above 4,480 = buyers start to regain control.
Gold does not need to collapse to reset the structure. Sometimes the best bullish continuation comes after the market clears weak buyers first.
Will gold defend the 4,390 POC, or will sellers force one more flush into the 4,330 VAL before buyers return?
Short 
XAUUSD: 4,520 Holds the Bearish Story XAUUSD: 4,520 Holds the Bearish Story
Market Context
Gold starts the new week under heavy pressure after a sharp rejection from the upper structure. Price has dropped back toward the 4,420 area, while traders are watching Fed policy signals and geopolitical headlines closely.
Warsh’s warning that the Fed still has “work to do” on inflation keeps pressure on non-yielding assets like gold. At the same time, renewed US-Iran tensions can create short-term safe-haven reactions, but for now, the chart shows sellers are still controlling the structure.
Key point: gold can rebound, but below 4,472 - 4,520, that rebound still looks corrective.
Technical Structure
Gold has broken down aggressively from the previous high structure and is now trading inside the FVG support zone around 4,417 - 4,420.
The nearest liquidity area is 4,472. If price rebounds into this level and fails, sellers may step in again.
The main short-term resistance is the FVG Sell Zone at 4,490 - 4,520. This is the zone buyers must reclaim to weaken the bearish pressure. Without a strong reclaim above this area, the current bounce remains only a technical pullback.
The larger bearish structure only starts to weaken if price reclaims 4,631. Until then, sellers still have the advantage.
Below current price, 4,380 - 4,400 is the next reaction zone. If this area fails, gold may continue lower toward the deep demand / OB buy order around 4,340 - 4,350.
Key Levels
Current Price: 4,420
Nearest Liquidity: 4,472
FVG Sell Zone: 4,490 - 4,520
Major Buy-side Liquidity: 4,631
High Supply / Sell-side Liquidity: 4,670 - 4,700
FVG Reaction Zone: 4,380 - 4,400
OB Buy Order / Deep Demand: 4,340 - 4,350
Bullish Recovery: Above 4,520
Bearish Continuation: Below 4,380
Trading Plan
Primary Sell Scenario
Entry: 4,472 - 4,520 after bearish confirmation
SL: Above 4,540
TP: 4,420 / 4,400 / 4,380
Condition: Price rebounds into liquidity or the FVG Sell Zone and fails to reclaim structure. If sellers defend this area, gold can continue the bearish leg.
Breakdown Sell
Entry: Below 4,380 after breakdown and retest
SL: Above 4,420
TP: 4,350 / 4,340 / 4,300
Condition: Gold loses the FVG Reaction Zone and cannot reclaim it. This would confirm that sellers are pushing price into deeper demand.
Buy Reaction
Entry: 4,380 - 4,400 after bullish confirmation
SL: Below 4,360
TP: 4,420 / 4,472 / 4,490
Condition: Price must show strong rejection from the FVG Reaction Zone. This is only a short-term reaction buy, not a full reversal unless gold reclaims 4,520.
Deep Buy Re-entry
Entry: 4,340 - 4,350 after clear bullish reaction
SL: Below 4,300
TP: 4,380 / 4,420 / 4,472
Condition: If gold drops deeper, this OB Buy Order becomes the next major area where buyers may try to defend the larger structure.
Bullish Recovery Scenario
Entry: Above 4,520 after breakout and retest
SL: Below 4,472
TP: 4,560 / 4,600 / 4,631
Condition: Buyers must reclaim the FVG Sell Zone with strength. A clean hold above 4,520 would suggest sellers are losing short-term control.
Overall Bias
Gold is still trading under bearish pressure after the sharp breakdown.
As long as price remains below 4,472 - 4,520, sellers keep the advantage. A rebound into this zone can become another sell reaction.
If 4,380 - 4,400 holds, gold may create a short-term bounce. But if this area breaks, the next downside target is 4,340 - 4,350.
Best approach: do not chase buys after a sharp drop. Wait for either a bearish reaction from 4,472 - 4,520 or a clean bullish confirmation from the lower demand zone.
Will gold reclaim 4,520, or will sellers use the next bounce to drive price into 4,340?
Short 


