XAUUSD 4470 trap — 4350 is calling XAUUSD 4470 trap — 4350 is calling
That breakdown under 4,470 is the real story.
Gold was already losing strength near the top. We had the rising structure, then the market started printing weaker reactions under the buy-side liquidity area. Then boom — clean drop through the range, straight into 4,445.
That is not just a normal pullback anymore.
Price broke below the bearish retest trap zone around 4,470 - 4,500, and now that area becomes the problem. If gold pulls back into it and gets rejected, late buyers are basically walking into supply.
The FVG above 4,485 - 4,525 is even more dangerous. That is where I expect sellers to defend hard if the bearish pressure is real.
Macro fits the move too. Hawkish Fed tone from Jackson Hole, stronger September hike bets, and gold losing the 4,600 area earlier — yeah, that is not friendly for bulls.
Main bias stays bearish while gold trades below 4,470 - 4,525.
The next downside draw is 4,390 first. Below that, the Smart Money Bounce Base around 4,335 - 4,350 is the clean liquidity target. That zone can give a reaction, but I don’t want to call a bounce before price actually gets there.
Trading scenario:
Sell idea only if gold rejects 4,470 - 4,525 or breaks below 4,390 with strong pressure.
Entry zone: 4,470 - 4,500 after rejection
Deeper sell zone: 4,500 - 4,525
Stop loss: above 4,545
TP1: 4,390
TP2: 4,350
TP3: 4,335
No rejection, no sell. No breakdown, no chase.
If gold closes strong back above 4,525, this bearish idea gets messy. Then the drop may turn into a deep liquidity sweep before recovery.
For now, I’m reading this as bearish retest first, 4,350 liquidity next.
You think gold retests 4,500 first, or dumps straight into 4,350?
 Short
Short
XAUUSD: Bearish Continuation Scenario in FocusGold is showing short-term bearish momentum on the 1-hour chart after a sharp rejection from higher levels.
Price is currently trading around the 4,419 area, with the 4,460–4,461 zone acting as an important level to monitor. If price remains below this area and sellers maintain control, the 4,321 region could come into focus as a potential downside objective.
A sustained move above the invalidation area would weaken the bearish scenario and could indicate that the market is attempting to recover.
Key levels:
Resistance / Invalidation: 4,460–4,461
Current area: 4,419
Potential downside area: 4,321
This is a technical market analysis based on price structure and key levels. It is for educational purposes only and not financial advice. Short 
XAUUSD — Wave 4 Rebound Before Wave 5XAUUSD — Wave 4 Rebound Before Wave 5
Gold is showing a clear bearish Elliott Wave structure after the strong rejection from the upper area near 4,620–4,640. From Kelly’s view, the current chart suggests that XAUUSD may have already completed wave (3) into the 4,400–4,425 zone, and the market could now build a corrective wave (4) before continuing lower into wave (5).
The key idea is simple: gold may rebound first, but as long as the recovery stays below the sell FVG zone, the larger short-term structure still favors another bearish leg.
⟡ Market Structure
Price is currently trading around 4,421, right inside the Resistance Fibonacci wave 4 area. This zone is important because it may decide whether gold continues lower immediately or makes a temporary recovery first.
The recent selloff was strong and impulsive, which supports the idea that sellers are still controlling the market. However, after such a sharp drop, a short correction toward the upper FVG area is possible before the next bearish continuation.
The main sell reaction zone on the chart sits around 4,500–4,530, marked as the FVG Sell wave 5 area. If gold rebounds into this zone and fails to break higher, sellers may step in again for the next downside move.
➤ Key Levels
◌ Current price area: 4,421
◌ Resistance Fibonacci wave 4: 4,400–4,425
◌ FVG Sell wave 5 zone: 4,500–4,530
◌ Key sell reaction level: 4,507
◌ Main downside target: 4,280–4,300
◌ End wave 5 level: around 4,286
◌ Bullish invalidation: above 4,540
⌁ Elliott Wave View
The chart is showing a bearish 5-wave sequence.
Wave (1) formed after the first rejection from the top.
Wave (2) created a corrective rebound near 4,620–4,640.
Wave (3) pushed strongly lower into the 4,400–4,425 Fibonacci zone.
Wave (4) may now create a corrective rebound toward 4,500–4,530.
If that zone rejects price, wave (5) may continue lower toward 4,280–4,300.
This is why Kelly is not chasing sells at the current low. The cleaner setup is to wait for either a weak rebound into the sell FVG zone or a clear breakdown below the current support structure.
▸ Trading Scenario
Preferred bearish scenario
Entry: Sell around 4,500–4,530 if price gives bearish rejection from the FVG Sell wave 5 zone
Stop Loss: Above 4,540
Take Profit 1: 4,400–4,425
Take Profit 2: 4,340–4,320
Take Profit 3: 4,280–4,300
Alternative entry
If gold fails to recover and breaks below 4,400 with strong bearish momentum, sellers may look for continuation toward 4,286 without waiting for a deeper pullback.
◌ Invalidation
The bearish view becomes weaker if gold breaks above 4,540 and holds above the FVG sell zone. In that case, the wave (4) correction may extend higher and the wave (5) downside scenario would need to be delayed.
⌁ Kelly’s View
Kelly’s main view remains bearish, but not to sell blindly at the current price. Gold is sitting near an important Fibonacci reaction zone, so a short rebound can happen first.
If price pulls back into 4,500–4,530 and rejects, the bearish wave 5 setup becomes cleaner, with the main target near 4,280–4,300.
Do you think gold will retest the FVG sell zone first, or continue directly toward wave (5)? Short 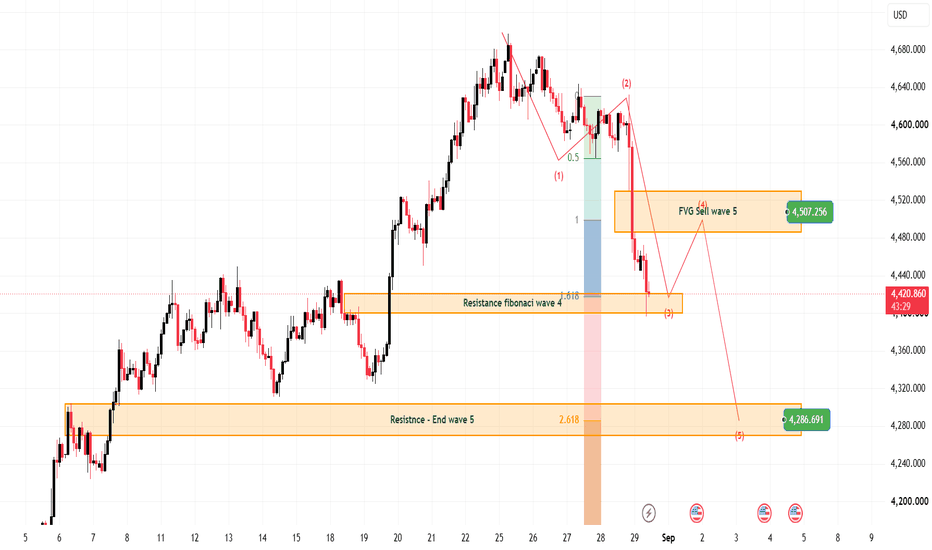
XAUUSD — 4,427 Break Opens 4,320 Next XAUUSD — 4,427 Break Opens 4,320 Next
Gold is starting the new week on the back foot, and this drop doesn’t look random.
Price has been rolling lower from the late-August highs after losing momentum inside that descending corrective channel. The important part now is that gold has already pushed down into the major FVG around 4,427 and is no longer holding the previous bullish structure. That tells me the market is shifting from “healthy pullback” into a more aggressive distribution phase.
Fundamentally, the pressure also makes sense. Warsh is still warning that the Fed has more work to do on inflation, which keeps rate expectations alive and gives the USD support. On top of that, fresh US strikes on Iranian rocket launchers add another layer of geopolitical tension, and that kind of backdrop can keep markets defensive rather than cleanly risk-on.
From the chart, I’m focused on continuation lower while price stays below the sell zone overhead. Any bounce from the current FVG looks more like a reaction than a confirmed reversal for now. If sellers keep price capped and the market fails to reclaim the broken structure, I think the next leg can extend into the first bearish target zone around 4,320.
So my main view this week is still bearish. Let price decide inside the current FVG first, but unless gold can reclaim the upper supply area, I’m treating rallies as pullbacks inside a broader downside move.
Key Price Zones to Watch
Current reaction zone: 4,427 area
Main FVG support: 4,360 – 4,427
First bearish target zone: 4,315 – 4,325
Intraday rebound zone: 4,480 – 4,520
Main sell zone / invalidation area: 4,600 – 4,630
Invalidation: clean reclaim and hold back above the sell zone
Do you see gold filling lower toward 4,320 first, or can buyers defend this FVG and force a deeper rebound?
Short 
Central Pivot Range (CPR) | Secret Revealed | Trader's Edge📊 CPR Trading Strategy: The 3-Line Zone That Can Reveal Market Direction
Most traders look at candles. Smart traders also look at where price is trading relative to the CPR. 🎯
If you trade Gold, Nifty, Bank Nifty, stocks or indices, understanding the Central Pivot Range (CPR) can give you a structured way to identify trend, support, resistance and potential breakout zones.
🔍 What is CPR?
CPR = Central Pivot Range
It is a three-level price zone calculated from the previous trading period:
Pivot (P) = (High + Low + Close) ÷ 3
Bottom Central (BC) = (High + Low) ÷ 2
Top Central (TC) = 2 × Pivot − BC
Together:
BC → Pivot → TC
These three levels create the Central Pivot Range.
Think of CPR as a market equilibrium zone — an area where buyers and sellers previously found balance.
🧠 How Does CPR Work?
The most important thing isn't simply knowing the CPR levels.
It's understanding where current price is in relation to CPR.
🟢 Price ABOVE CPR
Generally indicates stronger bullish conditions.
Look for:
Long opportunities
Pullbacks toward CPR
Breakout continuation
Higher support levels
🔴 Price BELOW CPR
Generally indicates bearish conditions.
Look for:
Short opportunities
Failed rallies toward CPR
Breakdown continuation
Lower resistance levels
🟡 Price INSIDE CPR
This can indicate consolidation or uncertainty.
Avoid blindly chasing trades.
Wait for:
Breakout + confirmation.
📈 CPR + Trend = Much Better
CPR becomes more useful when combined with:
✅ Price action
✅ Volume
✅ Moving averages
✅ Previous High/Low
✅ Support & Resistance
✅ Demand/Supply zones
✅ Breakout confirmation
CPR should be a framework — not a standalone buy/sell signal.
🟣🟢🔴 Narrow CPR
The CPR can be both narrow and wide. When the CPR is narrow, that means that all three lines, TC, BC and P, are very close to each other, then it indicates that the price has compressed. Price compression often leads to sudden expansion and increased volatility. Hence, we can see that when the CPR is narrow, a breakout becomes very likely.
🟣🟢🔴 Wide CPR
On the other hand, if the CPR is wide, it means there is a large gap between TC and BC, which suggests the market may have already experienced significant movement the previous day and is taking a breather today. A wide CPR usually leads to a range-bound or sideways market. A lot of times, the breakouts might happen, but those can be fake breakouts. The best strategy to trade on wide CPR days is reversal trading. That means when the market touches an important resistance zone, traders can go short, and when it touches an important support zone, they can go long.
🪙 APPLYING CPR TO THIS XAU/USD CHART
Now let's look at the attached Gold 1H chart.
The CPR cluster visible around:
4,602.68 – 4,603.21 – 4,603.74
acts as the central reference zone.
But look at where Gold is trading now:
🔴 Current price: ~4,454.99
That puts price well below the CPR zone.
This is an important observation.
The market has moved decisively away from the CPR rather than continuously trading around it.
What does that tell us?
The immediate structure shown on this chart is bearish.
The sharp decline from the CPR region toward 4,455 indicates strong selling pressure.
🎯 How I'd Read This Chart
🔴 CPR Zone
~4,602.68 – 4,603.74
This becomes an important overhead reference/resistance zone.
If price rebounds substantially, watch how it behaves around CPR.
Rejection → bearish continuation possibility
Sustained move back above CPR → bearish structure may weaken
📉 Current Market
Gold is trading around:
4,454.99
after a significant downward move.
The key lesson:
Don't automatically buy simply because price has fallen heavily.
A falling market can remain oversold longer than traders expect.
🚨 CPR Trading Rules
Setup 1 — Bullish
Price moves above CPR
⬇️
Retests CPR
⬇️
Holds above CPR
⬇️
Bullish confirmation
⬇️
Potential long setup
Setup 2 — Bearish
Price moves below CPR
⬇️
Retests CPR from underneath
⬇️
Fails to reclaim CPR
⬇️
Bearish confirmation
⬇️
Potential short setup
Setup 3 — CPR Breakout
Price consolidates around CPR
⬇️
Breakout occurs
⬇️
Volume/price action confirms
⬇️
Retest holds
⬇️
Continuation becomes more probable
✅ Advantages of CPR
1️⃣ Simple to understand
Three levels provide a clear framework.
2️⃣ Helps identify market bias
Above CPR ≠ automatically bullish, but it can support a bullish bias. Below CPR can support a bearish bias.
3️⃣ Useful for intraday trading
Especially on indices, stocks, commodities and forex.
4️⃣ Helps identify breakout areas
A narrow CPR can sometimes precede expansion in volatility.
5️⃣ Works across multiple timeframes
Daily, weekly and monthly CPRs can provide different levels of context.
⚠️ Limitations of CPR
CPR isn't magic. ❌
It can produce false signals during:
Choppy markets
Low-volume sessions
News-driven volatility
Sudden geopolitical events
Extremely volatile markets
And remember:
CPR does NOT predict the future.
It provides a reference framework for decision-making.
💰 How Should You Actually Trade It?
My preferred approach:
CPR + Price Action + Risk Management
Don't enter because:
❌ "Price touched CPR."
Instead ask:
1. Where is price relative to CPR?
2. Is the broader trend bullish or bearish?
3. Is price rejecting or accepting the CPR?
4. Is there volume confirmation?
5. Where is the invalidation/stop-loss?
6. Is the potential reward worth the risk?
That's where a trading indicator becomes a trading system.
🧠 THE GOLDEN RULE
CPR tells you WHERE to look.
Price action tells you WHAT is happening.
Risk management determines WHETHER you survive long enough to profit. 💰
📌 Educational Takeaway
On the attached XAU/USD chart, the most important CPR lesson is not simply the three numbers around 4,603.
It's this:
When price is trading significantly below CPR, don't fight the trend blindly. Wait for price to reclaim the CPR or look for confirmation of continuation.
Learn the framework. Understand the context. Manage the risk. Then trade. 📊🧠
🔥 Follow for more
📈 Market Analysis
📊 Trading Concepts
🧠 Technical Analysis
💰 Risk Management
🤖 Algorithmic Trading
Follow Globus Capitas for more practical trading education and market insights.
This content is for educational purposes only and should not be considered investment advice or a recommendation to buy or sell any security. Education 
H2 Major Demand Recovery Setup
XAUUSD is trading around 4,464 after Friday’s aggressive selloff drove price directly into the marked Major Demand + OB + POI. The H2 structure has weakened significantly, but price is now sitting at an important reaction area where a corrective recovery could develop.
Gold fell more than 3% after Fed Chair Kevin Warsh’s Jackson Hole remarks pushed September rate-hike expectations sharply higher and lifted the U.S. dollar and short-term Treasury yields. Today, gold is showing a modest recovery while renewed U.S.–Iran tensions are lifting oil and safe-haven demand. However, higher oil prices also increase inflation concerns, keeping yields and Fed-hike expectations elevated.
Technical View
The H2 bullish channel has broken down after a strong bearish displacement from the 4,600 area.
Price has now reached the 4,445–4,475 Major Demand + OB + POI, which is the main decision zone on the chart.
The preferred scenario is a bullish reaction from this demand rather than chasing the completed selloff. A confirmed reclaim could first drive price toward the 4,500–4,525 intermediate demand zone.
If buyers regain stronger control, the next recovery objective sits around 4,580–4,600, followed by the 4,675–4,695 premium supply / buy-side liquidity zone.
Key Zones
Current price: 4,463.710
Major Demand + OB + POI: 4,445–4,475
Intermediate Demand: 4,500–4,525
Demand Zone: 4,580–4,600
Premium Supply / BSL: 4,675–4,695
Major Swing High / BSL: 4,697.533
Trading Plan
Buy Priority: 4,445–4,475
Condition: wait for an H2 liquidity sweep followed by bullish rejection, reclaim or higher-low confirmation from major demand.
TP1: 4,500–4,525
TP2: 4,580–4,600
TP3: 4,675–4,695
Important Note
The macro environment is still challenging for gold. Warsh stressed that inflation remains well above the Fed’s 2% objective and that policymakers still have work to do, while markets now see the September meeting as live.
At the same time, renewed U.S.–Iran escalation is pushing oil higher, which can support safe-haven flows into gold but also reinforce inflation and higher-rate risks. Confirmation from demand is therefore essential.
Final View
Gold has completed a major bearish repricing and is now testing the 4,445–4,475 H2 demand zone. The cleaner plan is to wait for buyers to confirm control here rather than chase the decline.
If demand holds, a recovery toward 4,520, then 4,580–4,600, could develop before price potentially challenges premium liquidity again.
Will H2 major demand absorb the Jackson Hole selloff and start the next recovery? Long 
XAUUSD Bearish Breakdown – Sellers Eye Lower Liquidity
Technical Outlook:
Market Structure: Bearish shift with Lower Highs (LH) and Lower Lows (LL) developing.
Trendline: Price respected the descending trendline and rejected from resistance.
Liquidity: Sell-side liquidity around 4,450–4,455 has been taken, confirming downside momentum.
BOS: Strong bearish displacement below the 4,479 support, signaling a potential Bearish BOS.
FVG / Imbalance: The sharp sell-off created a bearish FVG around 4,480–4,532. A retracement into this zone could provide a potential short-entry area.
Ichimoku: Price is trading below the Ichimoku cloud, supporting the bearish bias.
Key Resistance: 4,520–4,532 FVG, with 4,600 acting as broader resistance.
Downside Targets:
🎯 TP1: 4,393
🎯 TP2: 4,315 — major sell-side liquidity
SMC Scenario
If price retraces into the 4,480–4,532 FVG and shows rejection, bears may continue targeting 4,393, followed by the deeper 4,315 liquidity pool.
Invalidation: A strong reclaim above the FVG/4,532 area would weaken the immediate bearish setup.
Bias: 🔴 Bearish | Sell the retracement, not the impulse. Short 
GOLD WILL FOOL BUYERS & SELLERS AGAIN? SEPTEMBER GAME PLAN!So, after the selling momentum we saw last Friday, quite a lot of buyers are now trapped in the market, while some sellers have also started entering again. But the most important question for the coming week and for the overall month of September is whether the selling momentum we saw during the final week of August was simply profit booking and whether the market is still bullish. And secondly, is the market now preparing for a deeper correction? Let’s talk about it.
If you have followed all of my analysis from last week, I clearly mentioned that whenever a month becomes extremely bullish, we usually see some kind of correction or profit booking during the final week of that month. And that is exactly what we saw. The market broke below $4600, then also broke below $4500, and eventually closed around $4450.
Now, if we look at why this selling momentum came into the market, the most important thing is to look at the momentum we saw between August 10 and August 19. During that period, the market was consolidating, and then on August 19, Gold broke above the $4448 level. Some traders started buying randomly after the breakout, while the traders who were waiting for a proper buying opportunity followed the classic price action rule and waited for a retest. That retest came during the London session on Thursday, August 20, and because of that, quite a lot of buyers entered around $4450, expecting continuation toward the upside.
However, the market failed to give a clean breakout above $4700, which resulted in some choppiness throughout the week, and eventually we saw strong selling momentum on Friday. So, this was the psychological reason behind the selling move.
Now the most important question is what we can expect from the market next week. The $4500 level is extremely important here. If you look closely at Friday's closing period, the market broke below $4500 with sharp selling momentum, and the most important part is that this breakdown happened only a few hours before the weekly close. Because of this, I believe a lot of random retail sellers have already entered below $4500. Whenever the market makes a sharp move and breaks a major psychological level, retail traders usually jump into the move. So, there are definitely sellers positioned below $4500 right now.
This is exactly why I am expecting some upside momentum at the start of next week. I expect the price to slowly move higher, reclaim $4500, and trade slightly above it. If that happens, the sellers who entered randomly below $4500 will start getting trapped. At the same time, some buyers will regain confidence and may start re-entering their buying positions.
But I don't expect that upside move to continue for too long. My expectation is that around Tuesday or Wednesday, we could see the market coming back below $4500 again, with the possibility of Gold moving toward the $4400 area. We may even see a liquidity sweep around $4400 before the market gives another reversal.
Now, let me explain the psychology behind this move. When the market starts selling again around $4500, many traders will think that the buyers around $4450 are getting another opportunity. They may assume that this is simply another retest or another round of profit booking, and that Gold will move higher again from there. But I don't expect the first attempt to give traders the move they are looking for.
If the market fails to sustain above $4500 and then starts moving sharply lower again, traders will begin to interpret the strong selling we saw on Friday as something more than just a simple retracement. The traders who were expecting a deeper downside move but missed the Friday selling will then start treating the next downside move as a fresh selling opportunity. That is where I expect another wave of fresh sellers to enter the market.
Overall, I believe the market could trap the buyers who enter during Monday, Tuesday and Wednesday. Once their confidence starts weakening and they begin to believe that the market is preparing for a deeper correction or turning bearish, that is when I expect the market to start recovering again toward the end of the week.
So, my expectation is that Thursday and Friday could bring another recovery, and by the end of the week, I would not be surprised to see Gold closing strongly back above $4500.
Overall, I am still bullish on Gold. The main reason is that the market is still holding above the important $4389 support level. Because of that, I am currently treating last Friday's selling momentum as profit booking rather than a confirmed major reversal. I don't personally expect the market to reverse completely from a major top this quickly, especially while we are still holding above the key support level.
So, my overall bias remains bullish, but I am expecting a psychologically complicated start to the week where both buyers and sellers could potentially get trapped before the market shows its actual direction.
As always, make sure you trade with proper risk management, wait for confirmation before entering, and focus on profit booking rather than forcing trades.
Now, I want to know your view on Gold. Do you expect a deeper correction, or do you think this is simply profit booking before the next bullish move? Let me know your view in the comments.
Thank you.
GOLD CRASHED 3% — WHAT’S NEXT? XAUUSD SHORT SETUPGold just experienced a major bearish regime shift.
Friday's XAUUSD selloff pushed Gold from around $4,630 to $4,445 , closing near $4,455 after hawkish Fed commentary triggered a sharp repricing in rate-hike expectations.
The key question now:
Will Gold continue lower - or deliver a relief rally before the next leg down?
Our 1H bias is currently:
BEARISH — SHORT ON RETRACEMENT
I am NOT interested in chasing Gold at $4,455 .
Instead, I want to see a retracement into the previous support/supply area and then look for bearish confirmation.
🎯 MY PRIMARY XAUUSD SHORT SETUP
SELL ZONE: $4,520–$4,555
This is the area I'm watching for a potential short.
Why?
• Previous support zone
• Potential supply on retest
• Near the $4,550 psychological level
• Friday's bearish displacement
• Potential liquidity sweep/rejection
• Bearish 1H market structure
MACRO: THE BIGGEST BEARISH CATALYST
The fundamental picture has also shifted against Gold in the short term.
Hawkish Fed
Warsh's Jackson Hole comments caused markets to significantly increase expectations for a September rate hike.
That creates the traditional bearish Gold chain:
Hawkish Fed
→ Rate expectations ↑
→ Treasury yields ↑
→ DXY ↑
→ Gold ↓
At the same time, the U.S. 10Y yield finished around 4.73%, while the dollar strengthened.
Gold is now facing pressure from both sides:
Higher yields + stronger USD
Trade Plan:
Short Entry: $4,535
Stop Loss: $4,610
TP1: $4,415
TP2: $4,350
Risk/Reward: 1:2.00 → 1:2.85
Disclaimer:
This is my personal market view and not financial advice. Always manage risk according to your own account size and trading plan.
Your feedback drives our content and keeps everyone trading smarter. Let’s make those pips together!
Happy Trading!
The InvestPro Team
Short 
MCX Gold: Correction May Continue Toward 140077MCX:GOLD1! appears to be forming a larger W-X-Y corrective structure on the daily chart. The first leg, Wave W, developed as an A-B-C correction, followed by an X-wave recovery.
Within Wave Y:
Wave A: 1,64,497 → 1,39,801
Wave B: 1,39,801 → 1,64,773
Wave C: currently developing
The important point is that Wave B reached 1,64,773 , slightly above the start of Wave A at 1,64,497 . This makes the current Y-wave look more like a flat correction rather than a normal zigzag. In a regular flat, Wave B normally returns close to the beginning of Wave A, while Wave C generally moves slightly beyond the end of Wave A.
For short-term traders: 149511 - 140077 is the first major downside zone.
The 1,39,801 level is also important because it is the end of Wave A. A move below this level would provide additional confirmation that Wave C is extending lower.
For positional traders: Deeper downside possibility - 124815
In short:
MCX Gold is currently in a corrective phase, with Wave C of the preferred Y-wave structure potentially developing. The first important downside zone is 1,49,511 , while 1,40,077 is the main target. A stronger decline below 1,39,801 could expose Gold to the deeper 1,24,815 level.
Key Economic Events This Week: Traders should keep an eye on the following major economic releases, particularly the US Crude Oil Inventories on Wednesday and the US Nonfarm Payrolls, Unemployment Rate and Average Hourly Earnings data on Friday, as these high-impact events may increase market volatility. Short 
GOLD: SELL BIAS AFTER JACKSON HOLE?After Jackson Hole, Gold remains in a short-term bearish channel, and sellers have gained clearer control of the current move. However, price is now approaching support zones that previously served as important accumulation bases.
The key point I am watching is that the decline is slowing as price approaches support. This could be a technical rebound before another leg lower, or it could mark the beginning of a new accumulation phase.
Resistance:
4,570 │ 4,600 │ 4,630–4,645 │ 4,700 │ 4,740
Support:
4,440–4,400 │ 4,350–4,340 │ 4,310
🎯 TRADING SCENARIOS
Rebound scenario: If 4,440–4,400 holds, I will watch for a rebound toward 4,570 → 4,600 → 4,630–4,645. This would only be a short-term buying opportunity.
Bearish scenario: If price clearly breaks below 4,440–4,400, the decline could extend toward 4,350–4,340 → 4,310.
🧠 MY VIEW
I still prefer to SELL on rallies into resistance, while BUY positions are only for short-term trades around support. I do not want to chase SELL positions after a sharp decline.
4,640–4,645 is the key barrier for the sellers. If price breaks above this zone, the bearish scenario will weaken significantly. On the other hand, if 4,440–4,400 is lost, sellers will gain further control and price could extend lower.
For now, my view is that it is too early to commit fully to either side. Let price react at support and confirm the next move.
For now, I am also watching the 4,440–4,480 area closely.
The Monday session may continue to absorb Friday's news, unless new developments or statements emerge from Trump over the weekend.
For safer trading, I would rather wait for the market to fully digest the news before taking a position.
Have a great weekend, everyone! Short 
XAUUSD: How to trade next week?This month, driven by various bullish news and data, gold surged sharply, peaking near 4700, the high point of this rally. However, I have repeatedly warned that once all bullish catalysts are priced in, gold will lose solid support and a large‑scale downward correction is inevitable. The market has once again proven my view, and our orders have generated substantial profits.
After the sharp downward correction on Friday, gold is unlikely to keep falling next week. It is expected to range‑bound between 4420‑4520 in the short term. A new trend will emerge once the market breaks out either downward or upward. We only need to trade along with this new market trend.
If gold breaks down below 4420 next week, we can go short following the market, targeting around 4400. If gold breaks above 4520, it signals the end of the bearish correction and the start of a fresh uptrend; price will retest the resistance zone near 4700, and we should go long accordingly.
Therefore, do not over‑guess the market. Simply wait for a confirmed trend and trade in its direction. I will keep delivering accurate signals to help you seize new trading opportunities. Short 
XAUUSD Bearish Setup – Liquidity Sweep Incoming?
🔴 Bearish SMC Outlook
XAUUSD is showing signs of short-term weakness after rejecting the 4,660–4,680 resistance / liquidity zone.
📌 Key Levels
• Buy-Side Liquidity: 4,660–4,680
• Bearish Order Block: 4,640–4,660
• Support / SSL: 4,580
• Downside Targets: 4,560 → 4,540
Price is trading beneath a descending trendline and remains capped by the Ichimoku cloud. A rejection from the 4,640–4,660 OB followed by a break of 4,580 could confirm bearish continuation.
🎯 SMC Scenario:
Sweep BSL → Reject OB → Break SSL → Target 4,560 / 4,540
⚠️ A sustained 1H close above 4,660–4,680 would invalidate the bearish setup.
#XAUUSD #Gold #GoldTrading #SMC #SmartMoneyConcepts #PriceAction #Forex #TradingView DISCIPLE-FX | XAUUSD 4H SMC ANALYSIS August 30, 2026DISCIPLE-FX | XAUUSD 4H SMC ANALYSIS
Market Structure
Overall Structure: BULLISH
The larger visible move remains bullish, with a strong rally from the lower demand area and a sequence of higher highs.
Short-Term Structure: BEARISH CORRECTION
The recent sharp sell-off from the upper supply area shows bearish momentum. Price is now testing an important lower imbalance/support region.
Key Support & Resistance
🔴 Resistance / Supply
4,560–4,580: Visible unmitigated supply zone
4,630–4,650: Intermediate resistance
4,680–4,700: Major swing high / buy-side liquidity
🟢 Support / Demand
4,400–4,425: Important FVG / imbalance support zone
4,000–4,120: Major unmitigated demand zone
Liquidity Zones
Buy-Side Liquidity
Above 4,560–4,580
Above the previous highs around 4,680–4,700
🔴 Sell-Side Liquidity
Below the current support/FVG around 4,400
Deeper liquidity sits toward the major demand zone
A break and sweep below the nearby support could trigger sell stops before a possible reversal.
SMC: BOS / CHOCH / FVG / Order Blocks
BOS
The larger bullish expansion previously created multiple upward structural breaks.
Short-Term Structure Shift
The latest aggressive bearish move indicates a short-term bearish shift/correction after rejection from the upper supply region.
FVG
A visible FVG / imbalance zone around 4,400–4,425 is currently important. This is the first area to watch for buyer reaction.
Order Block / Supply
The visible unmitigated supply around 4,560–4,580 remains a major potential sell zone.
Liquidity Sweep
The recent sharp decline appears to be targeting downside liquidity. Confirmation is still required before assuming a complete bullish reversal.
🟢 BEST BUY SETUP — CONDITIONAL
Entry Zone
4,405–4,430
Wait for:
Strong bullish rejection
Bullish displacement
Lower-timeframe bullish CHOCH/BOS confirmation
Stop Loss
Below 4,385
Targets
TP1: 4,480
TP2: 4,560
TP3: 4,650–4,700
Estimated Risk:Reward
Approximately 1:2 to 1:5+, depending on confirmation and entry.
BEST SELL SETUP — CONDITIONAL
The better sell opportunity is not to chase the current drop.
Sell Entry Zone
4,560–4,580 supply zone
Wait for bearish rejection and confirmation.
Stop Loss
Above 4,600
Targets
TP1: 4,480
TP2: 4,420
TP3: 4,320 or deeper liquidity
Estimated Risk:Reward
Approximately 1:2 to 1:4+
Probability Assessment
🟢 Bullish recovery from support: 58%
🔴 Bearish continuation below support: 42%
The broader trend still favors buyers, but the recent bearish momentum means confirmation is essential.
Retail Trap Areas
Bull Trap
A rally into 4,560–4,580 supply without a confirmed breakout could trap late buyers.
Bear Trap
A sweep below the 4,400 support/FVG area, followed by a strong bullish reclaim, could trap breakout sellers.
Don't chase candles. Wait for liquidity to be taken and structure to confirm.
Think of the current market like this:
The larger trend moved strongly upward.
Price reached an upper supply area and was rejected.
Now sellers are pushing price toward an important support/FVG zone.
If buyers strongly defend this zone, a bullish continuation becomes possible.
If price breaks and holds below the support zone, the correction could continue.
FINAL VERDICT: WAIT FOR CONFIRMATION
Current Price Area: Near a critical decision zone.
Preferred Plan
🟢 Look for a confirmed bullish reaction from 4,400–4,425.
🔴 If price decisively breaks and holds below this area, avoid aggressive buying and wait for the next structure/liquidity setup.
Confidence Score: 7/10
One-Sentence Trading Plan:
Wait for price-action confirmation around the 4,400–4,425 FVG support zone; buy only after bullish structure returns, or shift bearish if support breaks decisively.
If price stays above 4,400, my bias remains bullish. GOLD WEEKLY OUTLOOK 31.08.2026 to 04.09.2026# 🟡 GOLD WEEKLY OUTLOOK
Gold continues to remain **indecisive on the weekly chart**, with no clear directional breakout yet. However, the **daily chart currently shows a bearish bias**.
For this week, the key levels to watch are **4,700 on the upside** and **4,320 on the downside**. A decisive breakout of either level could provide clarity on the next major move.
### 📈 BUY ABOVE 4,700
If Gold breaks and sustains above **4,700**, the bullish targets are:
**4,750 → 4,858 → 4,890 → 4,950**
Traders should look for a convincing breakout rather than entering merely on an intraday spike.
### 📉 SELL BELOW 4,320
A break below **4,320** would confirm the bearish trend and could open the way towards:
**4,210 → 4,020**
### 🔴 AGGRESSIVE SELLING OPPORTUNITY
Aggressive traders may consider selling around the **4,500–4,510** zone, with a **25-point stop-loss from 4,510**.
Alternatively, traders may wait for a break below **4,445**, with a possible target zone of:
**4,330–4,350**
### 🔎 OVERALL VIEW
Gold has **not yet given a clear direction on the weekly chart**. The market may continue to move sideways and consolidate before giving a decisive breakout.
Therefore, **4,700 and 4,320 are the important levels for this week**:
* **Above 4,700:** Bullish momentum may strengthen.
* **Below 4,320:** Bearish trend is likely to be confirmed.
* **Between 4,320 and 4,700:** Expect possible sideways movement and consolidation.
This is what I could read from the charts at present. **However, markets are supreme, and they can always behave differently from our expectations.** Therefore, it is better to wait for the important levels to break and then trade with proper risk management and a strict stop-loss.
**Patience for the level is more important than prediction.**
### ⚠️ DISCLAIMER
This analysis is based purely on my interpretation of **technical charts, price action and market levels** and is intended for **educational and informational purposes only**. It should not be considered investment advice, a recommendation, or a solicitation to buy or sell Gold or any financial instrument.
**I am not SEBI registered.** Trading in Gold, commodities, forex or other financial instruments involves substantial risk, and losses can exceed expectations. Please conduct your own research, use appropriate position sizing and maintain strict risk management and stop-loss discipline.
**Trade only if the market confirms the levels. Markets are supreme, and no analysis can guarantee profits.**
XAU/USD: Support Under Attack —Will Gold Crash Toward the Target📊 Market Analysis
Gold has shown a strong bearish shift after sweeping the buy-side liquidity at the top. Following the liquidity sweep, price failed to maintain bullish momentum and started forming signs of a potential reversal.
🔍 Key Technical Signals
🔴 Buy-Side Liquidity Sweep:
Price swept the highs, potentially grabbing liquidity before reversing sharply downward.
📉 CHoCH → BOS Confirmation:
The chart shows a Change of Character (CHoCH) followed by a Break of Structure (BOS), suggesting that bearish momentum is gaining control.
🟨 Immediate Support / Order Block:
Price is currently reacting around a major OB / Immediate Support Reaction zone near 4,455. This is the key area bulls must defend.
⚡ FVG Zone:
An imbalance/Fair Value Gap remains above price, which could act as a resistance area if Gold attempts a retracement.
🎯 Possible Scenarios
📉 Bearish Scenario:
If price fails to hold the 4,455 support zone, sellers could push Gold toward the 4,345 target area.
📈 Bullish Reaction Scenario:
A strong defense of the current support could trigger a temporary rebound, potentially retesting nearby resistance and the FVG zone before the next major move.
⚠️ Key Level to Watch
🔥 4,455 — The battlefield between bulls and bears!
The liquidity has been swept, structure has turned bearish, and now everything depends on whether this critical support survives! 👀📉 Short 
 Long
Long


